#BTC/USDT - Are the bulls looking for a liquidity grab?#BTC
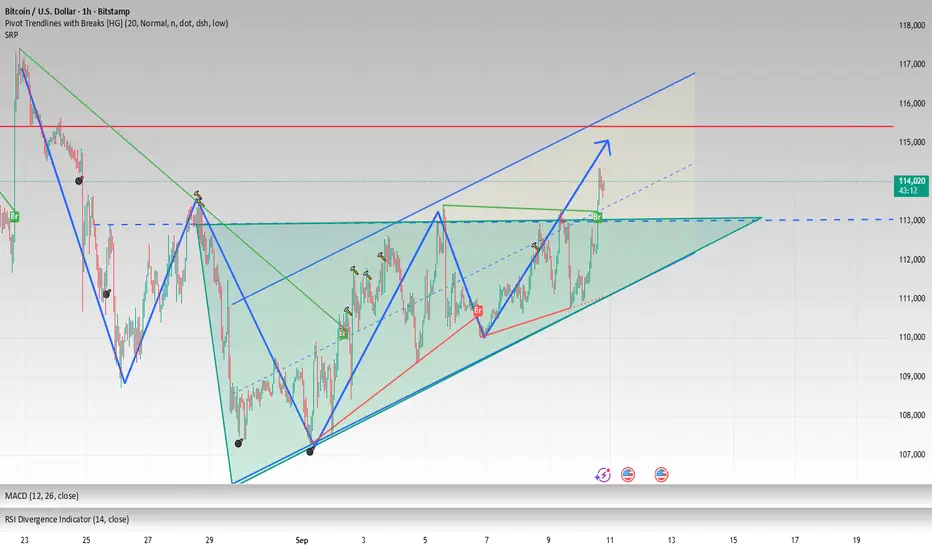
The price is moving within a descending channel on the 1-hour frame, adhering well to it, and is heading for a strong breakout and retest.
We have a bearish trend on the RSI indicator that is about to be broken and retested, which supports the upward move.
There is a major support area in green at 115,000, which represents a strong support point.
We are heading for consolidation above the 100 moving average.
Entry price: 115,600.
First target: 116,215.
Second target: 117,000.
Third target: 117,900.
Don't forget a simple matter: capital management.
When you reach the first target, save some money and then change your stop-loss order to an entry order.
For inquiries, please leave a comment.
Thank you.
BTCUSDC

BITCOIN UPDATEHello friends
According to the open cycle, we can say that our trend is bullish and is in a channel, but a resistance has stopped it, which it has hit twice. Now we have to see if this resistance will finally be broken or if the price will continue to suffer below this resistance.
If the price breaks the resistance, it will move to the specified targets.
Trade safely with us.

#BTC/USDT Breaks Resistance: Eyes on 117436 K#BTC
The price is moving within a descending channel on the 1-hour frame, adhering well to it, and is heading for a strong breakout and retest.
We have a bearish trend on the RSI indicator that is about to be broken and retested, which supports the upward move.
There is a major support area in green at 114400, which represents a strong support point.
For inquiries, please leave a comment.
We are in a consolidation trend above the 100 Moving Average.
Entry price: 114715
First target: 115650
Second target: 116518
Third target: 117436
Don't forget a simple matter: capital management.
When you reach the first target, save some money and then change your stop-loss order to an entry order.
For inquiries, please leave a comment.
Thank you.

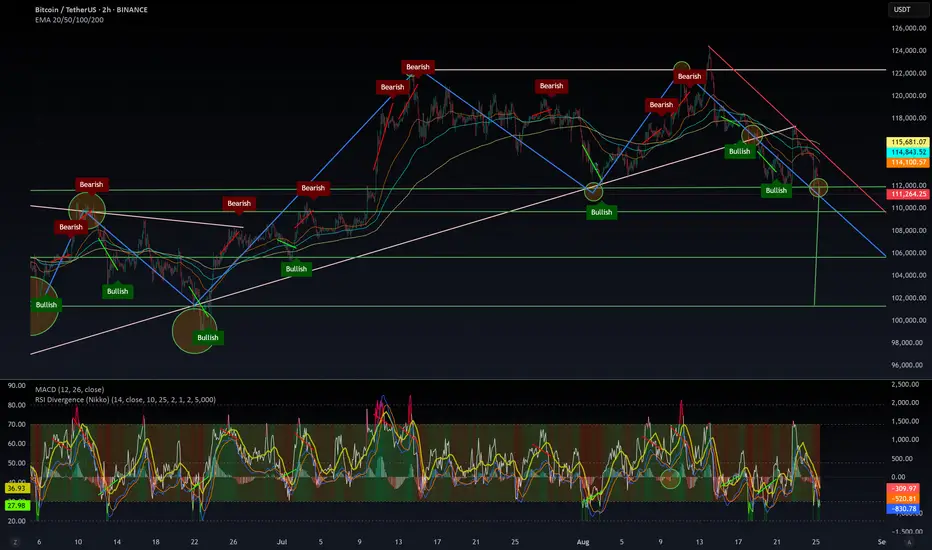
Will Bitcoin break new highs?Bitcoin has seen no major market moves. Overall, the ascending channel remains intact, and there seems little more to elaborate on. We maintain our previous view: exchange time for space.
Key Resistance: The $116,800 level has become the main battlefield for bulls and bears. If it breaks through strongly, the short-term target will look toward $118,000 or even $120,000.
Key Support: The $114,400 level is the first line of defense below; a break below this level may lead to a retracement to $113,200.
If you agree with my views, please give me a thumbs up. Thanks for your encouragement and support.

Bitcoin Price To Climb Higher Amid Rising Institutional AdoptionBitcoin Price To Climb Higher Amid Rising Institutional Adoption, Yet Ethereum's Relative Value Puzzles Investors
The digital asset landscape presents a fascinating dichotomy. Bitcoin, the undisputed leader, appears poised for a significant ascent, with analysts increasingly confident in a rally toward the coveted $120,000 mark. This optimism is overwhelmingly fueled by a powerful and sustained wave of institutional adoption, underscored by staggering inflows into U.S. spot Bitcoin Exchange-Traded Funds (ETFs). However, a perplexing counter-narrative is unfolding with Ethereum. Despite its own significant institutional embrace and the successful launch of its own ETFs, the ETH/BTC price ratio remains stubbornly low, signaling a relative weakness against Bitcoin that has left many investors searching for answers.
Bitcoin's Bullish Momentum: The Unstoppable Force of Institutional Capital
The sentiment surrounding Bitcoin is palpably bullish. After a period of consolidation, the cryptocurrency has shown remarkable resilience, holding key support levels and demonstrating renewed strength. Bitcoin is trading at elevated levels, with technical analysts and market experts setting their sights on the next major psychological barrier of $120,000. A sustained break above this level is widely expected to trigger a fresh wave of buying pressure, potentially propelling the price toward new all-time highs.
A flurry of price predictions from various financial institutions and seasoned analysts paints a picture of widespread optimism. Forecasts range from conservative six-figure targets to highly bullish projections well above $200,000. These predictions are united by a common thread: the transformative impact of institutional adoption.
The primary engine driving this bullish outlook is the unprecedented success of U.S. spot Bitcoin ETFs. These investment vehicles have served as a regulated and accessible bridge for institutional capital to flow into the digital asset space. Recent weekly net inflows have been measured in the billions of dollars, reversing previous outflows and signaling a renewed and voracious investor appetite. Leading funds from major asset managers have been the primary beneficiaries, consistently attracting hundreds of millions in fresh capital.
This influx of institutional money represents a fundamental shift in how Bitcoin is perceived. Major institutions are actively adding exposure and incorporating Bitcoin into their long-term investment strategies. This is evidenced by the behavior of "whales"—large Bitcoin holders—who have been accumulating significant amounts, viewing price dips as buying opportunities. The growing institutional presence is also contributing to a reduction in Bitcoin's notorious volatility, making it a more attractive asset for diversified portfolios.
Further bolstering the bullish case are favorable macroeconomic conditions. With expectations for lower interest rates, the appeal of risk assets like Bitcoin is on the rise. A weaker U.S. dollar and lower borrowing costs historically create a fertile environment for assets with a fixed supply to thrive. The confluence of massive ETF inflows, strategic institutional accumulation, and a supportive macroeconomic backdrop has created a powerful tailwind for Bitcoin.
The Ethereum Conundrum: High Adoption, Low Ratio
While Bitcoin basks in the glow of institutional validation, the story for Ethereum is more nuanced. On the surface, Ethereum is experiencing its own institutional renaissance. The approval of spot Ethereum ETFs has been met with considerable enthusiasm, attracting billions in capital and providing a regulated pathway for traditional investors to gain exposure to the world's leading smart contract platform.
The inflow data for Ethereum ETFs has been impressive, at times even surpassing Bitcoin's on a monthly basis. Cumulative inflows have reached a significant figure, a clear testament to the growing recognition of Ethereum's value proposition, which extends beyond a simple store of value to encompass the vast ecosystems of decentralized finance (DeFi), non-fungible tokens (NFTs), and real-world asset (RWA) tokenization.
Institutions are not just buying ETH through ETFs; they are also actively participating in the network's staking mechanism. An unprecedented surge in staking activity has seen a significant portion of ETH's circulating supply locked away to secure the network and earn yield. This "supply squeeze" is fueled by both institutional players and large individual holders, underscoring the long-term conviction in Ethereum's future. With a large percentage of the total supply staked, the available liquidity on exchanges has dwindled, a factor that would typically be expected to exert strong upward pressure on the price.
Given this backdrop of robust adoption, significant ETF inflows, and a tightening supply, one would expect Ethereum to be gaining ground on Bitcoin. However, the ETH/BTC price ratio, a key metric that reflects the relative value of Ethereum to Bitcoin, tells a different story. This ratio has remained stubbornly below the 0.05 mark, a level that signals relative weakness for ETH. It currently hovers at a low level, far from its historical peak.
This persistent underperformance is a source of considerable debate. A higher ratio indicates that ETH is appreciating faster than BTC. The current suppression suggests that while absolute demand for Ethereum is strong, the demand for Bitcoin is even stronger.
Several factors may be contributing to this conundrum. Bitcoin's established brand and its narrative as "digital gold" give it a powerful first-mover advantage, particularly among institutional investors taking a conservative, phased approach. For many, Bitcoin is the initial and primary allocation.
Secondly, Ethereum's utility introduces complexities and risks compared to Bitcoin's simpler value proposition. The ongoing evolution of the network, while bullish long-term, may present a steeper learning curve for some investors.
Furthermore, a historical trend of Bitcoin outperforming Ethereum may have created market inertia, with capital continuing to flow into the asset with stronger recent relative performance. In essence, both assets are appreciating, but Bitcoin is doing so at a faster rate, keeping the ratio suppressed.
Beyond the Big Two: Other Trending Cryptos to Watch
While Bitcoin and Ethereum dominate, the broader cryptocurrency market is a hotbed of innovation. Investors are exploring a diverse range of projects with potential for significant growth, driven by several key trends.
Layer-2 Scaling Solutions: As Ethereum faces demand-driven congestion, Layer-2 solutions have become indispensable. Projects offering faster, cheaper, and more scalable environments for decentralized applications are capturing a growing share of activity and represent a crucial investment theme for ecosystem growth.
Integration of Artificial Intelligence and Blockchain: The convergence of AI and blockchain is gaining considerable traction, creating new possibilities in automated trading, decentralized organizations, and sophisticated dApps. Projects leveraging AI to enhance blockchain capabilities are attracting significant attention.
Tokenization of Real-World Assets (RWA): This is poised to be one of the most transformative trends. Representing physical assets like real estate and commodities as digital tokens on a blockchain has the potential to unlock trillions in illiquid assets, making them more accessible and tradable globally. This is expected to drive a new wave of adoption.
Meme Coins and Community-Driven Projects: While often speculative, meme coins continue to exert significant influence, demonstrating the power of community and viral marketing. Their enduring popularity highlights the importance of cultural relevance in the crypto space.
The altcoin market is characterized by higher volatility and risk. However, for investors with a high-risk tolerance, it offers the potential for outsized returns based on technological adoption and market trends.
The Road Ahead: A Market at a Crossroads
The cryptocurrency market is a study in contrasts. The overwhelming force of institutional adoption is propelling Bitcoin toward potentially historic highs. The success of Bitcoin ETFs has fundamentally altered the market structure, creating a sustained demand that shows no signs of abating.
Conversely, the curious case of the ETH/BTC ratio serves as a reminder of the market's complexity. While Ethereum's own institutional story is compelling, it has yet to translate into sustained outperformance against Bitcoin.
Looking ahead, the market's trajectory will be shaped by key factors. Central bank monetary policy will continue to play a crucial role. The continued growth of the ETF market will be a primary indicator of institutional sentiment. And ongoing innovation in scaling, AI, and tokenization will determine the next generation of leading projects.
For investors, the current environment offers both immense opportunity and significant risk. The bullish case for Bitcoin appears robust, but volatility remains. Ethereum's long-term value is undeniable, but its short-to-medium-term performance relative to Bitcoin is less certain. The altcoin market holds promise but requires careful navigation.
In conclusion, the narrative of rising institutional adoption is powerfully reshaping the digital asset landscape. As Bitcoin bulls eye their next target, the broader market watches closely, navigating the crosscurrents of innovation, regulation, and macroeconomic forces that will define the future of this transformative technology.

#BTC/USDT Bullish Divergence on 1H, Low Risk Trade#BTC
The price is moving within a descending channel on the 1-hour frame, adhering well to it, and is heading for a strong breakout and retest.
We have a bearish trend on the RSI indicator that is about to be broken and retested, which supports the upward breakout.
There is a major support area in green at 0.0, representing a strong support point.
For inquiries, please leave a comment.
We are in a consolidation trend above the 100 Moving Average.
Entry price: 112090
First target: 112177
Second target: 113111
Third target: 113963
Don't forget a simple matter: capital management.
When you reach the first target, save some money and then change your stop-loss order to an entry order.
For inquiries, please leave a comment.
Thank you.

$BTC bounce at $112 or drop down to $101.3??CRYPTOCAP:BTC is forming a massive “M” pattern with a potential target around $101.3.
There are multiple support levels on the way down, so a bounce could happen at any of them. Ideally, this scenario gets invalidated with a strong rebound from $112K. Otherwise, the correction may drag on for weeks until a solid bottom is found.
The RSI is oversold on the 2H, but on the 1W timeframe, CRYPTOCAP:BTC looks like it’s just entering a longer-term correction.
⚠️ If the weekly bearish trend confirms, we could be facing several months of downside.
Will this trigger the start of alt season, or will altcoins get crushed even harder? Nobody can say for sure—so stay cautious and don’t get trapped by FOMO.
Here is the 1W chart, which is scary to be honest.
$BTC : bearish MACD crosover on 1WThe chart speaks for itself: we have a bearish crossover on the weekly MACD — historically a strong signal for a 3 to 6-month correction.
I know this goes against the current bullish sentiment, but every time this setup has appeared, the market corrected for several months. This time, however, the RSI isn’t extremely overbought, which could mean a shorter correction (1–2 months).
👉 Will this time be different?
If history repeats, the correction target sits around $96K–$98K at the 50-week SMA, a level that has always provided strong support in the past.
But if that support breaks… welcome to a new bear market.

BTC forms an ascending triangle, 113000 is just the beginningBITSTAMP:BTCUSD BTC saw a slight rise during the day. From the hourly and 4H charts, the MACD technical indicator formed a golden cross and broke through the upper short-term pressure of 113000. The short-term trend formed an ascending triangle. Bold and aggressive investors can rely on 113500-112000 to go long, with the target looking at 115500-116500.
BTC – Bullish Head & Shoulders Pattern!Bitcoin is currently showing signs of a bullish inverse head & shoulders pattern on the 4H chart. This setup is typically a reversal signal, suggesting potential upside if the neckline resistance is broken.
Key Highlights:
- Left Shoulder, Head, Right Shoulder formation is clearly visible.
- Neckline Resistance: Around $113,500 – a breakout above this level could confirm the pattern.
- Potential Upside: If confirmed, BTC could see a strong move toward higher resistance zones.
- Volume Watch: A breakout backed by strong volume would add conviction.
Cheers
Hexa
CRYPTOCAP:BTC BITSTAMP:BTCUSD BINANCE:BTCUSDT

#BTC/USDT Bullish Divergence on 1H, Low Risk Trade#BTC
The price is moving within a descending channel on the 1-hour frame, adhering well to it, and is heading for a strong breakout and retest.
We have a bearish trend on the RSI indicator that is about to be broken and retested, which supports the upward breakout.
There is a major support area in green at 109800, which represents a strong support point.
For inquiries, please leave a comment.
We are in a consolidation trend above the 100 Moving Average.
Entry price: 111164
First target: 111727
Second target: 112450
Third target: 113470
Don't forget a simple matter: capital management.
When you reach the first target, save some money and then change your stop-loss order to an entry order.
For inquiries, please leave a comment.
Thank you.

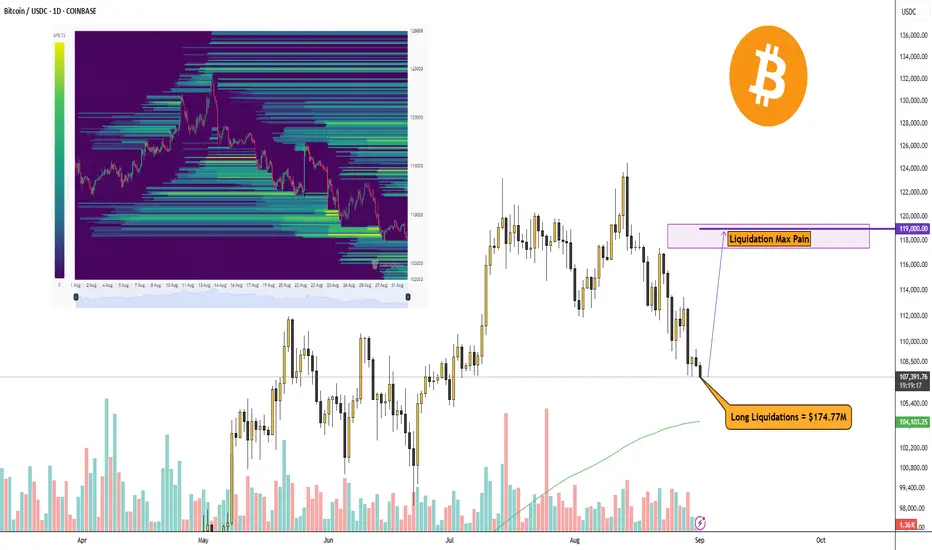
Bitcoin up or down?Bitcoin has corrected a bit more, and it looks like the main liquidations of long traders are done.
Right now, there’s a huge volume of Liquidation Max Pain at the $119,000 level, give or take. It’s the perfect time to buy Bitcoin.
Bitcoin Rally Entering Final Stages!Bitcoin Bull Cycle Analysis:
Historically, Bitcoin has moved in clearly defined market cycles, each lasting roughly 1,064–1,065 days (about 3 years) from bottom to peak, followed by a sharp correction.
2013–2017 Cycle
🔶Bitcoin bottomed in early 2015 and then entered a strong bull run.
🔶Over the next 1,064 days, Bitcoin surged by more than 12,000%, ultimately peaking in late 2017.
🔶After the peak, Bitcoin experienced an 84% decline over the following year, entering a prolonged bear market.
2017–2021 Cycle
🔶From the December 2018 bottom, Bitcoin again began a long bull phase.
🔶In the next 1,064 days, Bitcoin gained over 2,000%, reaching a new all-time high in late 2021.
🔶Similar to the previous cycle, the market corrected sharply, with Bitcoin losing around 76% of its value within a year.
2021–2025 Cycle (Current)
🔶The most recent bottom was recorded in late 2022. Since then, Bitcoin has been in a sustained uptrend.
🔶As of today, the cycle has lasted 1,000+ days, during which Bitcoin has appreciated by roughly 675%.
🔶If the historical pattern continues, this bull run may have about two months left before reaching a cycle peak.
🔶Afterward, the market could undergo a significant correction, potentially in the range of 60–70%, though smaller than previous drops.
Conclusion : Bitcoin’s market history shows a repeating cycle of multi-year bull runs followed by sharp corrections. While past performance does not guarantee future results, the consistency in cycle length and the pattern of diminishing corrections suggest that Bitcoin may soon approach its next major peak. If the trend holds, a significant pullback of 60–70% could follow, offering both risks for late entrants and opportunities for long-term investors. This highlights the importance of caution, disciplined risk management, and strategic planning as we near the potential end of the 2021–2025 bull cycle.

Bitcoin Crash Incoming?Bitcoin Cycle Analysis – Are We Nearing the 2025 Peak?
The above chart highlights Bitcoin’s historical market cycles, which have shown a remarkable pattern of consistency over the past decade. Each bull cycle has lasted roughly 1,064 days from the cycle bottom to the cycle peak, followed by a sharp correction phase.
Historical Cycles
- 2013 Peak → After the 2011–2012 bottom, Bitcoin rallied for ~1,064 days before peaking in late 2013. This was followed by a deep bear market.
- 2017 Peak → From the 2015 bottom, Bitcoin surged over 12,000% in ~1,064 days, peaking in December 2017 before dropping 84%.
- 2021 Peak → From the December 2018 bottom, Bitcoin rallied for 1,064 days again, gaining over 2,000% and peaking in late 2021. The following year saw a 76% correction.
Current Cycle (2021–2025)
- The most recent bottom was established in late 2022, marking the start of the current cycle.
- We are now over 1,000 days into this bull run, and Bitcoin has gained approximately 675% so far.
- If the historical cycle length repeats, the 2025 peak could occur around late October 2025.
Price Projection Based on Curved Support & Resistance
- Bitcoin’s price action has respected a curved support–resistance channel across the past three cycles.
- If the same pattern continues, the current cycle could see Bitcoin touch the curved resistance around the $130K–$140K level in October 2025.
- Historically, October has been a bullish month for Bitcoin, with strong momentum in previous cycles. Notably, in October 2021, Bitcoin printed a powerful bullish candle that led to the cycle peak.
- If history repeats, we could see a similar October rally in 2025, potentially marking the cycle top.
After the peak, a correction in the range of 60–70% is expected, consistent with the pattern of diminishing drawdowns (84% → 76% → projected 60–70%). This would place the potential next cycle bottom in the $50K–$60K range.
Conclusion
Bitcoin is nearing the end of its 2021–2025 bull cycle, with a potential peak around $130K–$140K in October 2025. Historically, October has been a bullish month, and past cycles suggest a 60–70% correction could follow, likely bringing prices back to the $50K–$60K range. With diminishing corrections each cycle, the market shows signs of maturity, but caution and risk management remain essential as we approach the cycle top.
Cheers
Hexa
CRYPTOCAP:BTC BINANCE:BTCUSDT BITSTAMP:BTCUSD

BITCOIN PREDICTION: SECRET PATTERN FORMING!!! (scary) Yello Paradisers! In this video, I have been analyzing Bitcoin for you on multiple time frames because we are doing professional trading analysis. On the ultra-high timeframe chart, I have been showing you the ABC corrective mode wave formation that we are doing right now and the next targets from an ultra-high timeframe perspective. Thanks to this, we can better understand the context of the overall market and make better trading ideas on lower timeframes.
On the high timeframe chart, I'm sharing with you that the zigzag of that ultra high timeframe degree B wave was, with the highest probability, finished. We are right now working on the first wave from a lower degree. I'm sharing with you also the bullish divergence.
On the medium timeframe chart, I'm putting your focus on the volume, which is dropping with the price rising. This is usually a sign of bulls being weak. Confluence this with being at resistance; it's usually a recipe for a reversal.We are also seeing two bearish divergences, which need to be confirmed, but the medium time frame is kind of bearish.
On the lower timeframe chart, I'm revealing to you the secret pattern formation: the ending diagonal. The Fibonacci sequence levels are sharing with you all the supports and resistances. I forgot to show you the confirmed bearish cross, but that's okay because the ending diagonal itself is revealing to us the next highest probability movement of Bitcoin.
Paradisers! Keep in mind to trade only with a proper professional trading strategy. Wait for confirmations. Play with tactics. This is the only way you can be long-term profitable.
Remember, don’t trade without confirmations. Wait for them before creating a trade. Be disciplined, patient, and emotionally controlled. Only trade the highest probability setups with the greatest risk to reward ratio. This will ensure that you become a long-term profitable professional trader.
Don't be a gambler. Don't try to get rich quick. Make sure that your trading is professionally based on proper strategies and trade tactics.

$BTC bounced to the 112K zone as expected, with even a shotCRYPTOCAP:BTC bounced to the 112K zone as expected, with even a shot at 115K possible, but I’m still holding my short from 116K. If we revisit my entry area, I’ll look to add more. For now, I’m staying in the trade and will share updates if anything changes. Targets remain 100K → 95K → 90K.

BTC Macro Top or Supercycle Ahead?Bitcoin’s long-term price action, alongside the monthly RSI, shows a repeating pattern at major cycle tops. Historically, whenever the RSI reached the descending resistance trendline (Above 85 level) , Bitcoin entered a cycle peak followed by a correction.
Currently, the RSI is once again approaching this key level, raising the question of whether history will repeat or if BTC can finally break through this long-term resistance.
Historical Pattern:
🔷 2013: RSI touched the upper trendline → BTC entered a cycle peak, followed by a deep correction.
🔷 2017: Once again, RSI hit the resistance → marked the bull market top.
🔷 2021: RSI faced rejection at the same line → led to a prolonged bear market.
Now, in 2025–2026, RSI is climbing back toward this resistance level, and the big question remains: Will Bitcoin break the cycle, or repeat history?
Key Points:
🔶 CRYPTOCAP:BTC has respected this RSI downtrend at previous market cycle tops (2013, 2017, 2021).
🔶 Price is trading near all-time highs while RSI nears historical resistance.
🔶 A breakout above this RSI trendline could signal a new phase of strength.
🔶 A rejection would suggest another cyclical cooling phase.
Conclusion
Bitcoin is at a macro decision point. For over a decade, this RSI trendline has defined cycle tops. A confirmed breakout would mark a historic shift in BTC’s market structure, while another rejection could mean history repeats.
Cheers
Hexa
BITSTAMP:BTCUSD BINANCE:BTCUSDT BINANCE:BTCUSDC

BTC/USDT – Bullish Momentum Brewing! Are You In?🚀 Trade Setup Details:
🕯 #BTC/USDT 🔼 Buy | Long 🔼
⌛️ TimeFrame: 1D
--------------------
🛡 Risk Management (Example):
🛡 Based on $10,000 Balance
🛡 Loss-Limit: 1% (Conservative)
🛡 The Signal Margin: $1256.28
--------------------
☄️ En1: 110559.25 (Amount: $125.63)
☄️ En2: 107509.03 (Amount: $439.7)
☄️ En3: 105389.1 (Amount: $565.33)
☄️ En4: 103310.97 (Amount: $125.63)
--------------------
☄️ If All Entries Are Activated, Then:
☄️ Average.En: 106440.29 ($1256.28)
--------------------
☑️ TP1: 118316.05 (+11.16%) (RR:1.4)
☑️ TP2: 124474 (+16.94%) (RR:2.13)
☑️ TP3: 132765.65 (+24.73%) (RR:3.11)
☑️ TP4: 144116.05 (+35.4%) (RR:4.45)
☑️ TP5: 157777.77 (+48.23%) (RR:6.06)
☑️ TP6: Open 🔝
--------------------
❌ SL: 97967.45 (-7.96%) (-$100)
--------------------
💯 Maximum.Lev: 7X
⌛️ Trading Type: Swing Trading
‼️ Signal Risk: 🙂 Low-Risk! 🙂
🔎 Technical Analysis Breakdown:
This technical analysis is based on Price Action, Elliott waves, SMC (Smart Money Concepts), and ICT (Inner Circle Trader) concepts. All entry points, Target Points, and Stop Losses are calculated using professional mathematical formulas. As a result, you can have an optimal trade setup based on great risk management.
📊 Sentiment & Market Context:
Bitcoin (BTC) is showing strong bullish momentum as it consolidates above key support zones, signaling a potential breakout after recent healthy corrections. The broader crypto market is stabilizing, and BTC continues to maintain its dominance, attracting institutional interest and retail confidence alike.
🌍 Fundamentals Remain Strong:
ETF inflows, continued network activity growth, and increasing adoption by global institutions are fueling BTC’s long-term outlook.
With the next halving cycle already on the horizon, historical trends suggest bullish continuation over the medium to long term.
Macro sentiment is also leaning risk-on, with fiat liquidity gradually increasing and global inflation concerns subsiding.
⚠️ Disclaimer:
Trading involves significant risk, and past performance does not guarantee future results. This analysis is for informational purposes only and should not be considered financial advice. Always conduct your research and trade responsibly.
💡 Stay Updated:
Like this technical analysis? Follow me for more in-depth insights, technical setups, and market updates. Let's trade smarter together!

#BTC/USDT Bullish Divergence on 1H, Low Risk Trade#BTC
The price is moving within a descending channel on the 1-hour frame, adhering well to it, and is poised to break it strongly upwards and retest it.
We have a bearish trend on the RSI indicator that is about to be broken and retested, supporting the upside.
There is a major support area in green at 108062, which represents a strong basis for the upside.
For inquiries, please leave a comment.
We are in a consolidation trend above the 100 Moving Average.
Entry price: 108450
First target: 108959
Second target: 109541
Third target: 110325
Don't forget a simple matter: capital management.
When you reach the first target, save some money and then change your stop-loss order to an entry order.
For inquiries, please leave a comment.
Thank you.

BTC Elliot Wave Count - Current Bull CycleMy current primary count for this bull cycle. Key point is the first wave 2 retracement goes to the 0.618 which rules out with a high degree of certainty that it's a wave 4. Additionally to note, RSI on the monthly peaks in the 3 of 3.

Possible conclusion to this bullrunThis bullrun is starting to look like stairs up, elevator down. Fractal analysis, an update to my previous chart.

Bitcoin Finds Support Around $110K After CorrectionMarket Dynamics
The price is trading around $112,950, with a daily growth of ≈ 1.17%, the maximum mark is $113,419, the minimum is $110,924.
The overall market sentiment is bullish:
Bitcoin found support around $110K after a correction from the historical maximum ($124K), which is facilitated by the expectation of easing the Fed's interest rate policy.
Analysts note important support at the level of $109K - a break below could trigger a short-term correction.
Investment flow remains positive: in August alone, $260 million inflow was recorded into the Bitcoin ETF; the presidential decree increases institutional interest in the asset.
Support and Resistance Levels
Level Value / Comment
Support $110K–$109K — critical zone to maintain bullish balance
Resistance $113K–$114K (current area), then $120K–$124K (breakout will open the way to growth)

BTC : LIVE TRADE!!!Hello friends
Well, you can see that in the support indicated by Fibonacci that we have obtained for you, the price has been well supported from the 3rd step of Fibonacci and currently the price is involved in the resistance indicated that if this resistance is broken, the price can move to the specified targets.
Don't forget risk and capital management.
*Trade safely with us*
