Bitcoin Analysis October 2025Bitcoin faced correction after last flash crash where bitcoin had 10% pullback, and it now has nice rally to the upside. Fixed volume range showed accumulation of buying orders. I expect price to push to the previous high on the left.
Btcusdlong

BTCUSD BUYS HELD Bitcoin’s price has been rising steadily over the last few days and the market has seen a sharp rise in to the upside, more trades are expected to be coming from a buy stop trigger

BTC UPDATE Bitcoin has been going up here’s an update, you can close partial profits if necessary to avoid losing profits already made

BTC Daily Scene — Still Not GreenAs you know from my previous publication, I’m still expecting Bitcoin to reach 100,000 and below.
The invalidation zone of my previous bearish scenario was 105,465 .
At the moment, Bitcoin tried to approach that zone but failed to even touch it , which only confirms its intention to keep heading down toward my target area — 100,000 and lower .
My global downside target is 83,000 , but for now, I only expect 100,000, since I don’t believe Bitcoin will drop straight to 83K in one go.
⸻
⚠️ Disclaimer:
This is not a trading signal, just my personal analysis.
Always trade according to your own system and use stop losses.
⸻
💬 Follow me so you don’t miss my daily Bitcoin analysis — the story continues!

LONG ON BTC/USD (BITCOIN)Bitcoin has given us a retracement to the demand zone it created after it gave a change of character from down to up.
I expect bitcoin to rise to fill imbalance to the upside for about 15k-20k points.

BTC/USD Bullish Pennant – Breakout Entry Setup✅ BTC/USD Pennant Breakout – Technical Analysis
Chart Breakdown
The chart shows Bitcoin forming a bullish pennant pattern on the 45-min timeframe.
A pennant typically forms after a strong impulsive move (pole), followed by price compression between:
Descending trendline (upper)
Ascending/flat trendline (lower)
This usually signals continuation in the direction of the previous trend, which in this case is upward.
Key Levels
Entry Zone: Just above the pennant resistance (breakout zone).
Stop-Loss: Below the pennant support — good risk management.
Target: Projected by measuring the previous impulse (the pennant pole) and extending it upward.
Market Signals
✔ Price is squeezing near the apex — breakout imminent.
✔ Buyers appear to be defending the lower trendline.
✔ If price breaks and closes above resistance, upside continuation becomes likely.
✘ But if price rejects and falls below support, the setup invalidates.
Bias
Bullish Continuation – If breakout occurs with strong volume.
✅ Title Suggestion
“BTC/USD Bullish Pennant – Breakout Setup Forming”

Bitcoin Sitting on Crucial 50 EMA Support!Finally, CRYPTOCAP:BTC has reached a key confluence zone, sitting right on the 50 EMA support, a level that has acted as dynamic support since 2023.
Technically, I’m expecting a potential bounce from here. However, if the current candle fails to reclaim this support, we could see a deeper correction, especially with ongoing geopolitical uncertainty weighing on the market. 📉
DYOR, NFA
Thanks for reading! Appreciate your support and engagement

BTCUSD: Understanding Liquidity SweepsLiquidity Sweeps: The Concept
A liquidity sweep in trading happens when price briefly moves beyond a well-known level such as, a previous high or low to trigger stop-loss orders or induce breakout entries, only to reverse immediately afterward.
In simple terms, large players (institutions, smart money) push price into zones where retail traders have placed stops or pending orders. These zones contain liquidity, meaning many buy or sell orders that make it easy to execute large trades without causing much slippage.
For example, when price moves slightly above a previous swing high, it attracts breakout buyers and triggers short traders’ stop losses (both are buy orders). Big players use this surge in buy-side liquidity to fill their sell positions. Once their orders are filled, price often reverses. This reversal is the liquidity sweep reaction. Conversely, huge buy orders are filled conveniently by absorbing sell-side liquidity.
In short:
Price sweeps above/below a key level to grab liquidity.
Traps breakout traders or stops out existing ones.
Then reverses, revealing the true direction.
Liquidity Sweeps in BTCUSD
In the above chart, we can clearly notice several instances where price action performed liquidity sweeps — some major, some relatively minor. A liquidity sweep occurs when price briefly pierces a key level to trigger stop-loss orders or attract breakout traders, only to reverse direction shortly after. This behavior often reveals where large players are collecting liquidity before moving price in the opposite direction.
Major Liquidity Sweeps
➡Below 107,270 (17th October): Price dipped below the previous significant low, sweeping sell-side liquidity before bouncing back sharply.
➡Above 116,000 (27th October): A peek-a-boo above previous swing highs, likely to hunt buy-side stops, followed by a quick rejection.
Minor Liquidity Sweeps
➡Above 113,655 (21st October): A short-lived breakout attempt that failed to sustain.
➡Above 111,049 (2nd November): Another minor sweep where price briefly went above a previous high and then retraced.
➡Below 106,137 (22nd October): A short downside sweep that was quickly absorbed by buyers.
➡Below 106,692 (30th October): Another false breakdown, signaling strong demand near the lower end.
Sweeps and the Range
All these sweeps combined have helped form a well-defined trading range between 107,100 and 116,000. The market is currently trading near the lower boundary of this range, which often acts as a liquidity-rich demand zone.
If buyers manage to defend this area, a technical bounce can be anticipated first towards 110,730, and if price sustains above that level, the move could extend back towards the upper range near 116,000.
Such liquidity-based consolidations often precede strong directional moves so, observing how price reacts at these key zones will offer valuable clues about the next major trend.
Do you ever trade near such liquidity zones or still stuck in the false breaks?
📣Disclaimer:
Everything shared here is meant for education and general awareness only. It’s not financial advice, nor a recommendation to buy, sell, or hold any asset. Do your own research, manage your risk, and make sure you understand what you’re getting into.

Bitcoin Support Zone Rebound SetupBitcoin (BTC/USDT) is approaching a key support zone around 103,000–104,000. A potential rebound from this area could trigger a bullish move toward the first target near 105,000 and the second target around 106,500.

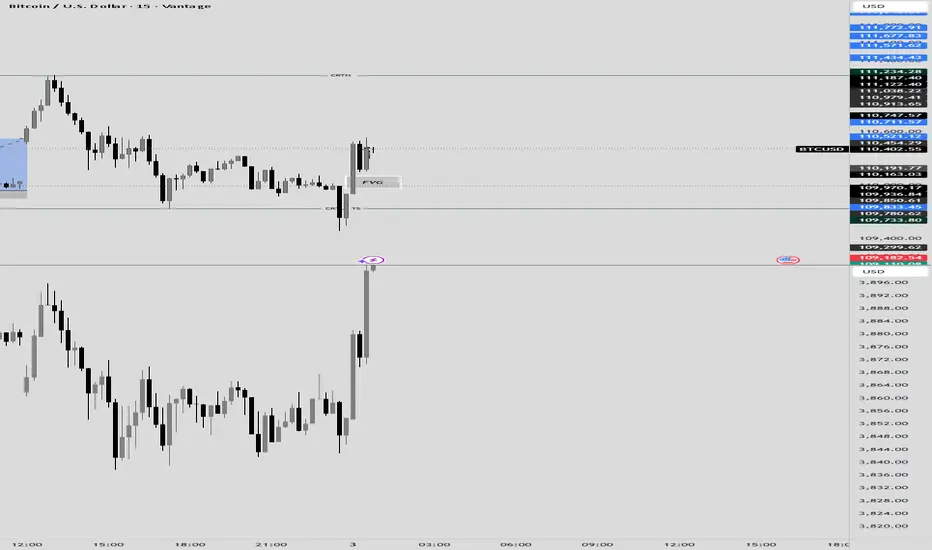
15-minute BTC/USD chart showing some clear price action pattern🚀 BTC/USD 5M - Short-Term Analysis: Bullish Displacement & FVG Fill the 5-minute chart for Bitcoin shows a significant shift in immediate order flow, characterized by a liquidity sweep followed by a strong displacement that left behind a clear price imbalance.
📊 Structure and Key LevelsCRTL + TS ($109,780.62 - $109,850.61): This zone marks a "Clear Run on the Low" (CRTL) or "True Stop-run" (TS). Price dipped below prior lows to trigger sell stops/liquidity, then immediately reversed higher. This is a classic sign of liquidity collection by institutional buyers.
FVG (Fair Value Gap/Imbalance): The strong green candles following the sweep created a significant Fair Value Gap between approximately $110,163.03 and $110,191.77. Price has recently retraced precisely into this gap.CRTH ($111,234.28): This level (a "Clear Run on the High") represents the major Buy-Side Liquidity (BSL) target that has been left un-tested and is the most likely destination for the next bullish move.
📈 Current Price Action and BiasThe chart shows a high-probability "Sweep $\rightarrow$ Displacement $\rightarrow$ Retrace to FVG" setup, which strongly favors continuation in the direction of the displacement (upward).
Stop Hunt Complete:
The market has successfully collected sell-side liquidity, providing the fuel for the move up.FVG Retest: Price has returned to the Fair Value Gap to effectively "fill" the imbalance created by the aggressive buying. This zone acts as a high-probability demand zone or entry point for bulls.
Bullish Confirmation: As long as price holds above the low of the liquidity sweep ($109,780.62), the immediate bias is bullish.
🎯 Trade Expectation
Entry: Look for confirmation (strong bullish candles or lower-timeframe shift) within or just below the FVG area.Target 1 (Liquidity): The primary target is the CRTH at $111,234.28 to clear the buy-side liquidity resting above those highs.Invalidation: A decisive close below the CRTL + TS zone (below $109,780.62) would invalidate the bullish structure and suggest a deeper drop toward the lower liquidity/support at $109,000.

BTC recovers, positive at the end of OctoberBTC Daily Analysis
Price recently swept liquidity below the key support zone around 108,000–106,000, forming a clear Liquidity Sweep Zone (LQ Sweep). This move indicates that the market collected stop-losses and liquidity from previous lows before showing a strong bullish reaction.
The recovery from this area suggests a potential short-term reversal as buyers step in to defend the lower trendline of the ascending channel. The confluence between the Liquidity Sweep Zone and the trendline support strengthens the probability of a bullish continuation.
In the coming sessions, if BTC maintains momentum above 110,000–111,000, the next upside targets will be:
First resistance: 115,500–116,000
Major resistance zone: 120,000–122,000
A clean break and retest of the 115,500 zone would likely confirm the continuation scenario toward the upper boundary of the channel near 125,000–126,000.
Summary:
Structure: Bullish reaction from key liquidity zone
Bias: Short-term bullish as long as 108,000 support holds
Targets: 115,500 → 122,000 → 126,000
Invalidation: A daily close below 106,000 would negate the bullish setup

BTC Cycle Review: know when to hold 'em & when to fold 'emReviewing the time around the halving that produces profitable trending signals.
From the chart 1 yr and 2 months before the halving and 1 year 5 months after the halving produces profitable signals
consider pre halving to be spring
consider post halving to be summer
consider the red X between the two to be winter and unprofitable to take signals.
Posting this up as reference into the next cycle. interested to see how this plays out.

BTC mainly accumulates, remaining force decreasesBTC Technical Analysis (1D Chart)
Bitcoin continues to move inside a rising channel, where the upper trendline has repeatedly acted as strong resistance (around $125,000–126,000), and the lower boundary has held as key support near $108,000.
After the recent rejection at the upper boundary, price has pulled back sharply and is now approaching the support zone at $108,000–108,500, which aligns with:
The bottom trendline of the ascending channel
The 200-day EMA (white line)
A previous reaction zone marked by strong bullish reversals in the past
If the support holds, BTC may see a technical rebound toward the EMA89–EMA34 zone around $114,000–115,000, or even back to the channel resistance near $125,000.
However, if price breaks below $108,000, it would confirm a bearish breakout from the channel, potentially opening the way toward $100,000–102,000.
Key Levels to Watch
Resistance: $114,000 – $115,800 / $125,000 – $126,000
Support: $108,000 – $108,500 (critical zone)
Trend: Neutral to bullish inside channel; bearish breakdown if $108K fails
Bitcoin Market Outlook – October 16, 2025-Today, there’s a strong possibility that Bitcoin may finally break out of its current consolidation range.
The market has been moving sideways for several sessions, showing signs of indecision among traders — but the current price action suggests that volatility could be returning soon.
-At the moment, all eyes are on the 110,400 support zone.
A confirmed breakdown below this level could provide an initial short opportunity, potentially opening the door for a deeper correction toward lower liquidity areas. Such a move would likely trigger stops and force weak hands out of the market, creating temporary downward momentum.
-However, if this breakdown turns out to be a fake move and the price quickly forms a V-shaped recovery pattern, it will be critical to shift the bias to long positions immediately.
That scenario would indicate a “risk-on” sentiment returning to the broader market, as liquidity and capital could start flowing back into Bitcoin — possibly marking the beginning of another bullish leg.
- In summary, today’s candle close around 110,400 is extremely decisive.
A clean breakdown confirms continuation of the correction, while a sharp rebound from this level could validate a strong reversal setup.
Either way, traders should stay alert, as this zone will likely define the next major directional move for Bitcoin.
For informational purposes only – not financial advice. © DIBAPRISM
Larry D.Kohn

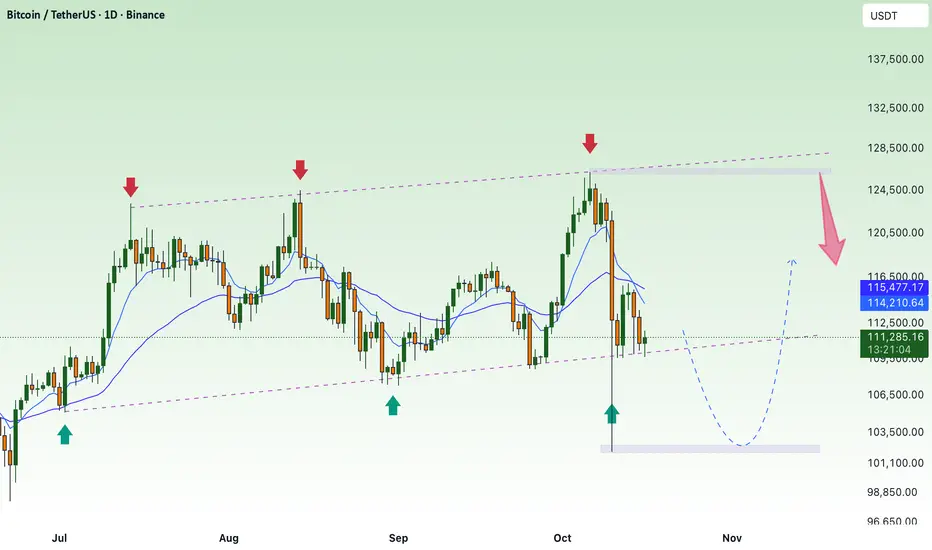
Sweep all liquidity, BTC recoversBTCUSD – Daily Analysis
The recent market move confirmed our earlier sell call at the 126K top, which played out perfectly as price reversed sharply from that resistance zone. This level aligned with the 1.618 Fibonacci extension and the upper trendline — a strong confluence area that signaled exhaustion.
Currently, BTC is rebounding from the support zone around 110K–111K, showing short-term recovery momentum. However, unless price breaks decisively above 121K, the structure still favors a potential retest toward 110K before any larger bullish continuation.
→ Key Levels:
• Resistance: 121K / 126K
• Support: 110K / 107K
• Trend: Short-term corrective uptrend within a broader range
✅ Successfully caught the 126K top — next focus on reaction around 121K zone.

BTC Bull & Bear historical Periods 3 Bull & Bear Markets
Bull markets took around 152 weeks...
then
V
v
v
v
v
Bear Markets took around 52-59 weeks..
then
v
v
v
v
v
v
v
Bull Market gain...
----------------------------------------------------------------------------------------------------------
After 2021 ATH
BTC recorded his current bottom after 52 weeks ( 15500 $).
BTC pumped after 59 weeks .
then what ?
Will the history will repeat itself again ??
if we will be alive inshallah ,we will see the next 152 weeks to ( October - November 2025 ) if this will be the New ATH of the next bull market or not :D
It is not a financial advice , PLZ DYOR

BITCOIN - The Rhythm of the CycleBitcoin moves in rhythm - not random, not reckless, but harmonic.
Each rise and retrace plays like a melody from its own history,
and once again, the chart hums that familiar tune.
After tapping 126K , price retraced, tested 120K support ,
and bounced clean - a sign the rhythm’s still intact.
The ATH–SR zone (120K–124K) now acts as the pivot,
where momentum builds for what could be another November encore.
Above this range, the next notes play at 138K, 147K, and possibly 160K+
if the tempo flows like Nov ’24–Dec ’24, now Oct ’25–Nov ’25.
But if this beat breaks, 108K remains the base of the rhythm.
CRYPTO:BTCUSD doesn’t just move in price - it moves in patterns.
Listen to the rhythm, not the noise.
- Klaus | NFX Hub 💚
---------------------------
Even in critical times - it’s okay to play a little...

Bitcoin STRONG Weekly Bounce - What's Next?Hello BTC Watchers 📈
📢 Bitcoin was trading right on top of a crucial support zone. But the price has successfully bounced in the weekly and made a strong comeback from the support zone.
The weekly moving averages
The daily moving averages
This is telling for a number of reasons. In the weekly we see a strong bounce above the moving averages as well as in the daily, and in the daily we had just bounced back from a correction which took us to the 100d MA (which is the general zone for a correction, or at least a wick towards that area. This indicate that in the short and longer term, the chart is looking up and bulls are in control.
What are you thoughts, new ATH or just a fakeout?

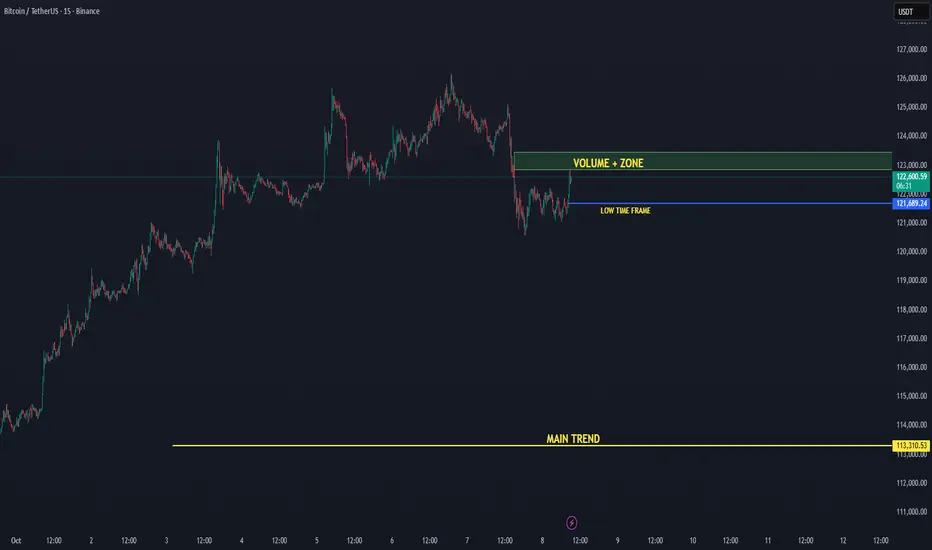
BTC/USDT — Low Time Frame Recovered, Eyes on Volume 08-10-2025Bitcoin has reclaimed its low time frame level near $121.6K, signaling renewed short-term strength. Price is now pushing upward toward the +Volume Zone, an area where increased buying activity could trigger a breakout continuation.
📈 Low Time Frame Reclaimed: BTC has stabilized above the local structure, confirming short-term bullish momentum.
🔊 Volume Zone Target: The next resistance sits around $123K, where increased trading activity could accelerate a move higher.
🟢 Main Trend Active: The primary uptrend remains strong as long as BTC holds above the $113K main trend support.
Technical Levels:
🟢 Main Trend Support: $113K
🟡 Low Time Frame Support: $121.6K
🔊 Volume Zone Resistance: $123K
🎯 Next Target: $125–$126K
Outlook:
Bitcoin is showing healthy recovery momentum, reclaiming short-term structure and heading into the Volume Zone. If it sustains above $121.6K and breaks $123K with volume confirmation, a continuation toward $125K+ becomes likely.
📊 Bias: Bullish continuation
📈 Focus: Volume reaction at $123K
Positive Market - BTC Continues to Find New ATHBTCUSD Analysis
Bitcoin is currently testing the upper boundary of a long-term ascending channel, where price has previously faced rejection several times (as shown by the red arrows).
The market recently completed a strong rally toward 124K, aligning with the 1.618 Fibonacci extension (123,609) — a significant resistance zone that triggered selling pressure.
Key observations:
• Resistance area: Around 124K–125K, aligning with the upper channel line — potential for short-term correction.
• Support zones: The first support lies near 118,100, followed by 115,000–115,500, both acting as Fibonacci retracement zones.
• Possible scenarios:
1. Price may retrace toward 118K–115K to gather liquidity before another push upward.
2. If the market holds above 123K, a breakout toward 132K–133K could be confirmed.
Overall, momentum remains bullish, but the current zone requires caution — a short-term pullback is likely before the next major move.

BTCUSD trade idea BTC/USDT 15m Analysis – Possible Breakout Setup
Price has been respecting an ascending trendline, creating higher lows (121,576 → 121,787 → 121,970) which shows buyers are stepping in earlier each time.
We can also see the time between resistance retests shrinking, which often signals seller exhaustion and builds pressure for a breakout.
📌 Key Levels:
• Short-term resistance: 122,750 – 123,000
• First TP: 123,371
• Second TP: 123,900
• Invalidation: Below 121,970 (third low)
As long as price holds above the trendline, the structure favors a bullish breakout confirmation toward the upside targets.

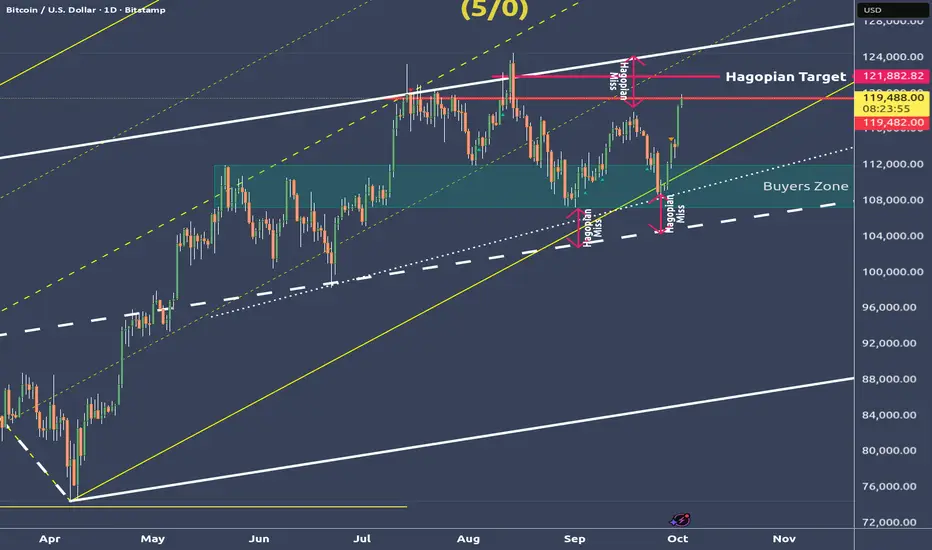
Bitcoin deep dive - We go up to the Hagopians line🔱 Up to the HAGOPIAN's line! 🔱
My last post showed what the possible moves are.
Bitcoin blew through both U-MLH's and is now on the way to the HAGOPIAN-Line.
I could imagine that we even tag the white U-MLH again.
That would be about where the confluence with the yellow forks 1/4 line is.
Because there is much more to say about this chart, I thought I'll do a video.
⛏️ I constructed the Chart from the ground up so you can see all the details and thoughts running through my Mycel Network §8-)
👉 Just check my SOM links.
🙏 Thanks you all for the Boosters I got lately. You all are absolutely awesom and I really appreciate it! 🙏