Bitcoin – Between Equilibrium and Transcendence.⊣
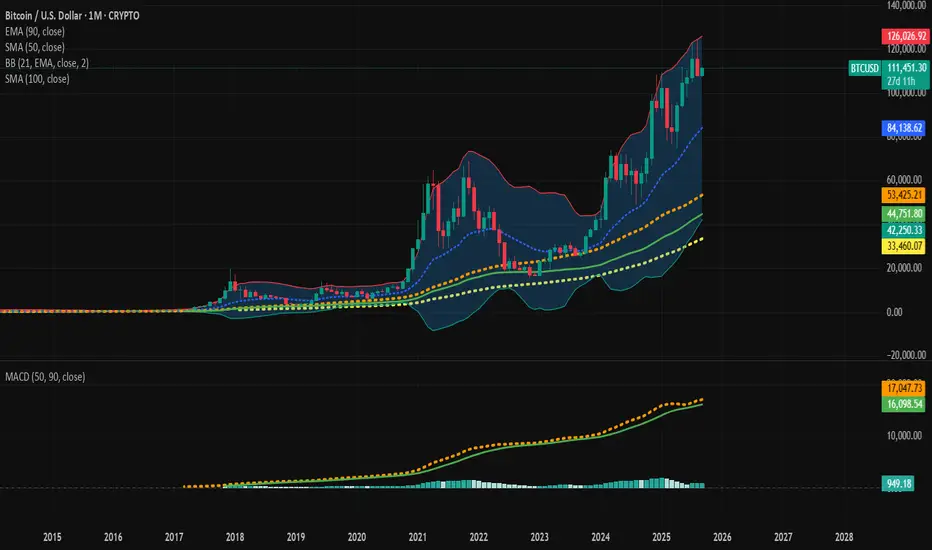
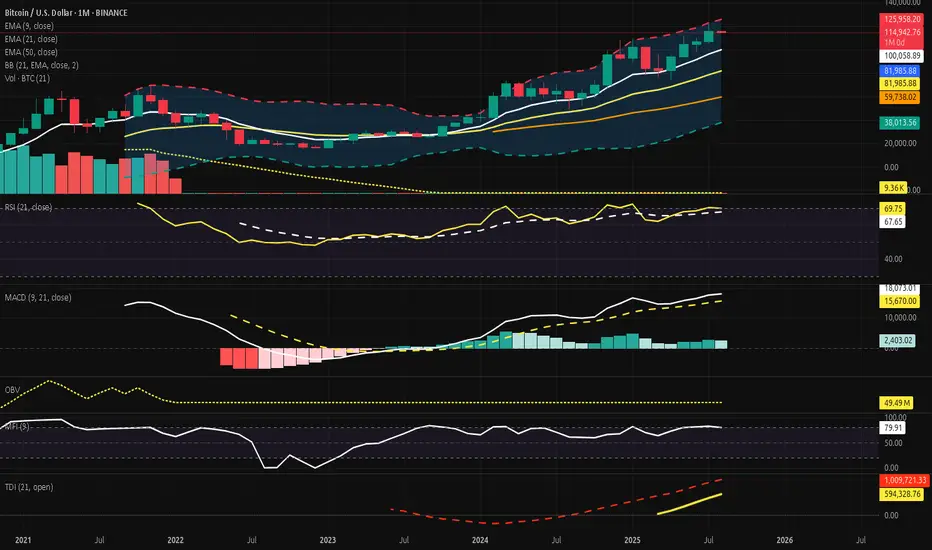
⟁ BTC/USD – BINANCE – (CHART: 1M) – (Sep 03, 2025).
◇ Analysis Price: $111,148.95.
⊣
⨀ I. Temporal Axis – Strategic Interval – (1M):
▦ EMA90 – $44,745.16:
∴ Deep-cycle moving average, historically preserved through bull markets;
∴ Distance buffer ≈ +$66.40K (+59.7%) above EMA90;
∴ No tests since the 2020 breakout -> macro trend intact.
✴️ Conclusion: EMA90 = deep structural anchor (bullish fortress intact).
⊢
▦ SMA50 – $53,419.17:
∴ Primary macro floor for post-halving cycles;
∴ Price stands +$57.73K (+51.9%) above this line;
∴ First high-timeframe defense in a major correction.
✴️ Conclusion: SMA50 = medium-term guardian support.
⊢
▦ SMA100 – $33,457.05:
∴ Extreme long-term anchor, rarely approached outside bear capitulations;
∴ Cushion +$77.69K (+69.9%) above;
∴ “Black-swan” only in current cycle context.
✴️ Conclusion: SMA100 = last-resort macro base.
⊢
▦ BB (21 ,2) - (Midline $84,111.14 / Upper $125,959.23 / Lower $42,263.04):
∴ Price rides the upper regime, sitting ~13.3% below the upper band (headroom ≈ $14.81K);
∴ Distance to midline (equilibrium) ≈ $27.04K (+24.3%) -> strong cushion;
∴ Bands are widened -> volatility expansion phase of the macro trend.
✴️ Conclusion: BB = mature expansion; (midline $84.1K) is the balance axis.
⊢
▦ MACD (50, 90) - (Line 947.03 / Signal 17,045.04 / Histogram 16,098.01):
∴ Long-cycle configuration filters noise and tracks halving waves;
∴ Histogram magnitude strong -> impulse still alive at the macro scale;
∴ No imminent bearish crossover on this slow setting; trend health preserved.
✴️ Conclusion: MACD = bullish regime with durable momentum.
⊢
🜎 Strategic Insight – Technical Oracle:
∴ Structure: Price is well above all macro bases (SMA50 $53.4K, EMA90 $44.7K, SMA100 $33.5K) and operating in the upper Bollinger regime; (midline $84.1K) marks the structural equilibrium;
∴ Momentum - (single pillar): MACD (50, 90) remains decisively positive, consistent with a continuing bull cycle;
∴ Risk rails: Upside trigger = sustained push toward/through ($125.96K - BB-upper); downside mean-reversion rails = ($99–$84K - prior clusters/BB mid).
✴️ Conclusion: The monthly chart remains Bullish-Structural and in mature expansion. As long as Bitcoin holds above the (BB midline ~$84.1K), the macro up-cycle stays intact; clearance toward ($126K) would reopen upside discovery.
⊢
𓂀 Stoic-Structural Interpretation:
✦ Structure of Trend:
∴ The price hovers far above the macro fortresses (SMA50 $53.4K, EMA90 $44.7K, SMA100 $33.5K). These remain untouched, signaling the structure’s resilience;
∴ Bollinger (midline at $84.1K) is the true axis of equilibrium: as long as it holds, the market breathes in the upper realm of expansion;
∴ The upper Bollinger bound ($125.9K) is not yet pierced, leaving the cycle suspended between present strength and future compression.
✦ Momentum of Will:
∴ The MACD (50, 90), slow and deliberate, projects a force aligned with the long halving waves: histogram positive, crossover intact, momentum unfaltering;
∴ The market’s will remains bent toward continuation, though each candle at this altitude tests the resolve of buyers;
∴ Stoic principle: strength endures until proven otherwise; momentum persists until equilibrium demands balance.
✦ Flow of Capital:
∴ Wide Bollinger bands whisper volatility unchained, inviting both euphoria and caution; liquidity expands but seeks its balance at the ($84.1K mid);
∴ Capital rotates but does not abandon the structure; the exodus of liquidity is absent from the long frame;
∴ The inflow of discipline dominates - patience governs capital flows.
✦ Interpretation of Fate:
∴ Above ($125.9K) = release into new discovery, fate embraces uncharted peaks;
∴ Between ($99K and $84K) = mean-reversion crucible, where structure is tested but not destroyed;
∴ Below ($84K) = stoic descent, a return toward (SMA50 / EMA90) bastions.
✴️ Conclusion: The monthly essence is Bullish-Structural, with fate aligned to the continuation of expansion. Yet, Stoicism reminds: no trend ascends without pause; ($84.1K) is the sacred balance, ($125.9K) the gate to transcendence.
⊢
· Cryptorvm Dominvs · MAGISTER ARCANVM · Vox Primordialis ·
· Dominivm Cardo Gyratio Omnivm · Silence precedes the next force. Structure is sacred ·
⊢
Btcusdprice
Bitcoin – The Hinge of $108K: CME Gaps Define the Path.⊣
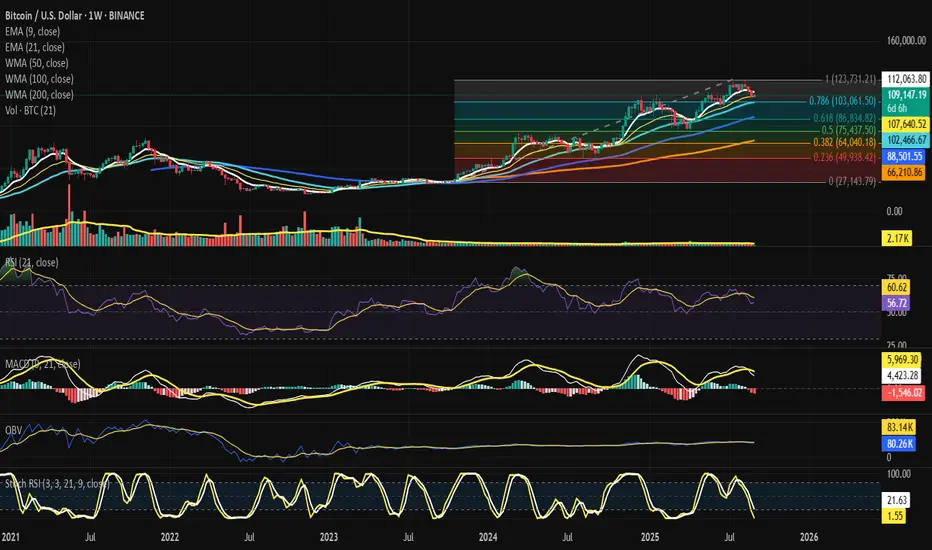
⟁ BTC/USD – BINANCE – (CHART: 1W) – (Sep 01, 2025).
◇ Analysis Price: $108,883.16.
⊣
⨀ I. Temporal Axis – Strategic Interval – (1W):
▦ EMA9 – $112,010.99:
∴ Price trades below EMA9, confirming weekly short-term weakness;
∴ Acts as dynamic resistance aligned with rejection candles;
∴ Bulls require a weekly close > EMA9 to regain strength.
✴️ Conclusion: EMA9 = first ceiling for recovery.
⊢
▦ EMA21 – $107,616.51:
∴ Price currently rests just above EMA21;
∴ EMA21 aligns with tactical support after EMA9 loss;
∴ Confluence with local structure reinforces as battle line.
✴️ Conclusion: EMA21 = current pivot, decisive for weekly trend.
⊢
▦ WMA50 – $102,456.32:
∴ Converges with Fib 0.786 ($103,061);
∴ Forms heavy support cluster;
∴ Break below exposes deeper retracement zones.
✴️ Conclusion: WMA50 + Fib 0.786 = structural shield.
⊢
▦ WMA100 – $88,496.32:
∴ Mid-term support level, far from spot;
∴ Safety net below Fib 0.618 ($86,834);
∴ Historical pivot in previous cycles.
✴️ Conclusion: WMA100 = mid-term structural base.
⊢
▦ WMA200 – $66,208.23:
∴ Ultimate macro support far below current action;
∴ Defines secular trend;
∴ Bears unlikely to reach without systemic capitulation.
✴️ Conclusion: WMA200 = macro foundation.
⊢
▦ RSI (21, close 9) – 56.57 / 60.59:
∴ RSI above 50 = positive bias, but descending from prior highs;
∴ Momentum weakening, approaching neutrality;
∴ No bullish divergence formed yet;
✴️ Conclusion: RSI fading, still positive but fragile.
⊢
▦ MACD (9,21,9) – Line: 4,394.48 / Signal: 5,963.54 / Histogram: –1,569.06:
∴ Bearish crossover confirmed;
∴ Histogram negative, momentum shifting bearish;
∴ Weekly timeframe signals mid-term risk.
✴️ Conclusion: MACD = bearish transition underway.
⊢
▦ OBV + EMA9 – OBV: 83.14K / EMA9: 80.26K:
∴ OBV above EMA9, reflecting prior accumulation;
∴ No expansion, flattening trajectory;
∴ Suggests distribution/neutral flows.
✴️ Conclusion: OBV steady but not supportive.
⊢
▦ Stoch RSI (3,3,21,9) – K: 1.09 / D: 21.48:
∴ In deep oversold (<20);
∴ Early cross attempt between K and D;
∴ Relief rally possible, not yet confirmed.
✴️ Conclusion: Oversold condition signals potential bounce.
⊢
▦ Fibonacci Retracement (0 = 27,143 -> 1 = 123,731):
0.786 -> $103,061 (≈ WMA50);
0.618 -> $86,834 (≈ WMA100);
0.500 -> $75,437;
0.382 -> $64,040;
0.236 -> $49,938.
✴️ Conclusion: $103k region = confluence fortress; loss exposes $86k.
⊢
🜎 Strategic Insight - Technical Oracle:
∴ The weekly structure is compressed between EMA9 ($112K) above and EMA21 ($107.6K) below, defining a narrow battlefield;
∴ Momentum tools diverge: RSI (56.6) still positive yet fading, while MACD confirms a bearish crossover, and Stoch RSI drifts in oversold territory;
∴ The confluence fortress at $103K (Fib 0.786 + WMA50) stands as the decisive defense; its loss would unlock the mid-cycle retracement path toward $86K (Fib 0.618 + WMA100);
∴ OBV above EMA9 indicates prior accumulation, but its flattening betrays absence of new inflows.
✴️ Conclusion: The weekly oracle confirms structural fragility: upside recovery demands a close >$112K, while downside destiny pulls toward ($103K if $107.6K) fails.
⊢
▦ CME Gap Analysis:
⌖
∴ CME daily chart highlights an open gap region in the ($112K -> $114K) zone - (from recent downside break);
∴ Historically, CME gaps tend to close with high probability, especially within 1–3 weeks;
∴ Current price ($109.4K) rests below this gap, leaving upside magnetism;
✴️ Conclusion: CME gap above acts as a gravitational pull; if price stabilizes >$108K, probability favors retrace into ($112 / $114K).
⊢
▦ Lower Gaps (Unresolved):
∴ Historical CME structure also leaves unfilled gap at ($103 / $104K) - (aligned with Fib 0.786 + WMA50 from weekly);
∴ This acts as downside magnet if $108K support fails;
∴ Market may oscillate between these dual magnets: ($103 / $104K) below, ($112 / $114K) above.
✴️ Conclusion: Dual CME gaps frame near-term battlefield; direction depends on structural defense of $108K.
⊢
𓂀 Stoic-Structural Interpretation – (BTC/USD + CME) - (Sep 01, 2025):
∴ Structure of Spot: Bitcoin clings to the Fib 0.382 ($108K), where the weekly EMA21 ($107.6K) marks the hinge of destiny. Above, the barrier of EMA9 ($112K) looms, resisting all relief. Below, the WMA50 + Fib 0.786 ($103K) stands as the fortress, the last shield before deeper descent;
∴ Structure of CME: The futures chart reveals the voids - an unclosed gap above ($112–114K) and another below ($103–104K). These voids are gravitational wells, pulling price toward their closure. Spot and CME converge: what the candle structure outlines, the gaps confirm.
∴ Momentum of Will: Indicators bear the stoic seal of decline. RSI fades from strength, MACD crosses bearish, and OBV flattens, whispering of distribution. Yet the Stoch RSI oversold breathes the faint promise of reprieve - not salvation, but respite.
∴ Fate of Flow: On-chain discipline shows no panic, whales remain silent; it is structure, not capitulation, that bends the market’s will. Thus, the battlefield is defined not by chaos but by the calm inevitability of compression between supports and voids.
✦ Structure Thus:
∴ Hold above $108K -> the path opens to the CME gap above ($112 / $114K), a short-term redemption;
∴ Fail below $107K -> the market is drawn into the CME gap below ($103 / $104K), aligning with the weekly fortress.
✴️ Conclusion: Bitcoin stands suspended between two voids - a promise above, a threat below. The stoic essence demands patience: fate will be decided by which gap the structure surrenders to first.
⊢
· Cryptorvm Dominvs · MAGISTER ARCANVM · Vox Primordialis ·
· Dominivm Cardo Gyratio Omnivm · Silence precedes the next force. Structure is sacred ·
⊢
Bitcoin - Inflows Whisper Calm, Structure Awaits Discipline.⊣
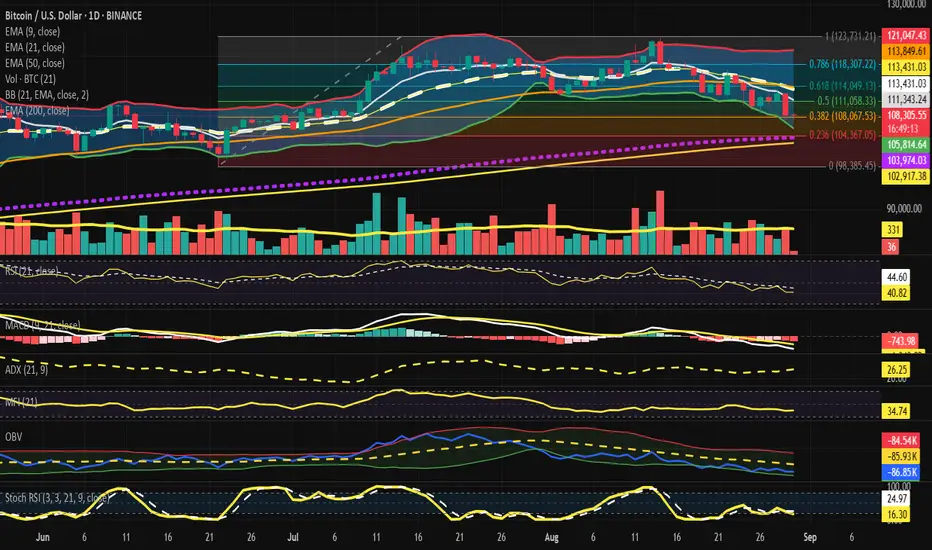
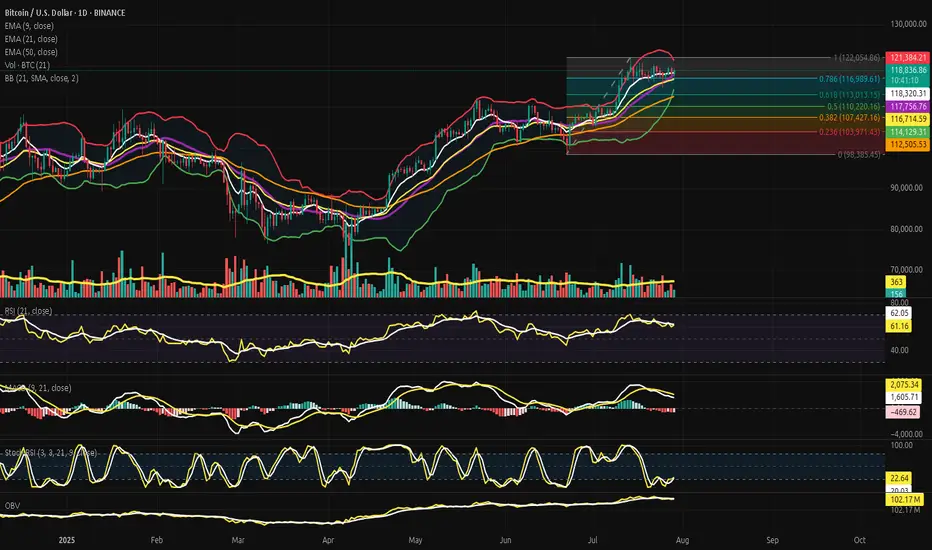
⟁ BTC/USD – BINANCE – (CHART: 1D) – (Aug 30, 2025).
◇ Analysis Price: $108,377.41.
⊣
⨀ I. Temporal Axis – Strategic Interval – (1D):
▦ EMA9 – $111,357.61:
∴ Price remains below EMA9, confirming immediate bearish control;
∴ EMA9 has flipped into dynamic resistance after multiple failed retests;
∴ Short-term recovery requires a clean daily close above EMA9.
✴️ Conclusion: EMA9 acts as near-term resistance, bearish short bias intact. Logic sealed.
⊢
▦ EMA21 – $113,437.56:
∴ EMA21 aligns with Fib 0.618 ($114,049), forming a resistance cluster;
∴ Persistent rejection since Aug 21 emphasizes mid-term weakness;
∴ Reclaiming EMA21 is the first real bullish trigger.
✴️ Conclusion: EMA21 = critical pivot to shift from bearish to neutral. Logic sealed.
⊢
▦ EMA50 – $113,852.43:
∴ Slightly above EMA21, adding weight to the $113.4 / 113.9k resistance zone;
∴ Until broken, this confluence acts as a bearish supply wall;
∴ A reclaim here reopens upside toward Fib 0.786 ($118.3k).
✴️ Conclusion: EMA50 reinforces resistance cluster. Logic sealed.
⊢
▦ EMA200 – $102,917.45:
∴ Long-term fortress, still untested in this cycle;
∴ Confluence with Fib 0.236 ($104,367) = macro defense zone;
∴ Bears’ ultimate target if current supports give way.
✴️ Conclusion: EMA200 stands as macro citadel. Logic sealed.
⊢
▦ Bollinger Bands (21, 2) – $121,042 / $113,437 / $105,833:
∴ Price riding lower band at $105.8k;
∴ Bands widening = volatility expansion with bearish tilt;
∴ Failure to revert to midline confirms continuation risk.
✴️ Conclusion: Bands highlight bearish volatility regime. Logic sealed.
⊢
▦ RSI (21, 9) – 40.90 / 44.62:
∴ RSI below neutral 50, momentum bearish;
∴ Not oversold (<30), leaving room for more downside;
∴ No bullish divergence present.
✴️ Conclusion: RSI validates sellers’ momentum. Logic sealed.
⊢
▦ MACD (9, 21, 9) – Line: –2,079.96 / Signal: –1,342.25 / Histogram: –737.71:
∴ Bearish cross intact below zero-line;
∴ Histogram remains deeply negative, no sign of contraction;
∴ Momentum acceleration still favors bears;
✴️ Conclusion: MACD entrenched in bearish phase. Logic sealed.
⊢
▦ ADX (21, 9) – 26.25:
∴ Above 25 confirms trend strength;
∴ With DI– dominance, direction is bearish;
∴ Indicates continuation rather than reversal.
✴️ Conclusion: ADX confirms strengthening bearish trend. Logic sealed.
⊢
▦ MFI (21) – 34.75:
∴ Below 50 = capital outflows dominate;
∴ No oversold signal (<20) yet;
∴ Market still has selling pressure capacity.
✴️ Conclusion: MFI aligns with distribution bias. Logic sealed.
⊢
▦ OBV (21, BB2) – (–86.84K):
∴ OBV trending lower, confirming distribution;
∴ Volume does not show accumulation footprint;
∴ Confirms sellers dominate liquidity.
✴️ Conclusion: OBV validates distribution regime. Logic sealed.
⊢
▦ Stoch RSI (3, 3, 21, 9) – K: 16.30 / D: 24.97:
∴ In oversold territory (<20);
∴ No confirmed bullish crossover yet;
∴ Relief bounce possible if crossover occurs.
✴️ Conclusion: Oversold condition may allow relief, but not structural reversal. Logic sealed.
⊢
▦ Fibonacci Retracements (0 = $98,385 -> 1 = $123,731):
0.786 -> $118,307 – (upper resistance);
0.618 -> $114,049 – (current battlefield, confluence EMA21/50);
0.500 -> $111,058 – (reclaim point for neutralization);
0.382 -> $108,067 – (current support pivot);
0.236 -> $104,367 – (deeper target, near EMA200).
✴️ Conclusion: Market clings to 0.382; Loss exposes 0.236 + EMA200 fortress; Logic sealed.
⊢
🜎 Strategic Insight - Technical Oracle:
∴ Short-term structure: price pinned under EMA9 and EMA21/50 cluster, bearish dominance confirmed;
∴ Momentum: RSI below 50, MACD negative, ADX >25 = sellers in control;
∴ Capital flows: MFI <50, OBV falling = distribution not yet exhausted;
∴ Only counterpoint: Stoch RSI oversold; potential for technical bounce, not structural reversal.
✴️ Conclusion: The battlefield is 0.382 Fib ($108k). Bulls must reclaim $111k -> $113.4k to neutralize; failure drags price toward ($104 / 103k). Logic sealed.
⊢
∫ II. On-Chain Intelligence - (Source: CryptoQuant):
▦ Exchange Inflow Total + EMA9 - (All Exchanges):
∴ Current inflow readings remain low-to-moderate, no spikes comparable to 2022 capitulation phases (>200K BTC);
∴ EMA9 of inflows trending stable/declining since Q2 2025;
∴ Lack of exchange deposits suggests no broad panic selling.
✴️ Conclusion: Inflows do not confirm capitulation; sellers are present but not aggressive. Logic sealed.
⊢
▦ Historical Context:
∴ Spikes above ~150K BTC inflow (e.g. 2022–2023) correlated with sharp price drawdowns;
∴ 2024–2025 shows inflows mostly <50K BTC/day, even during corrections;
∴ Current cycle corrections appear orderly rather than panic-driven.
✴️ Conclusion: Current inflow regime supports controlled distribution, not mass liquidation. Logic sealed.
⊢
▦ Liquidity Implications:
∴ Absence of exchange inflow surges implies supply pressure limited to tactical sellers;
∴ On-chain wallets continue holding, whales not rushing coins into exchanges;
∴ Technical breakdowns (EMA clusters, Fib 0.382) would require derivative/liquidation cascades rather than spot-led panic.
✴️ Conclusion: Structural downside must be driven by futures leverage, not spot panic flows. Logic sealed.
⊢
𓂀 Stoic-Structural Interpretation and On-Chain Oracle:
∴ Structure: EMA stack inverted; Fib 0.382 ($108k) = present bastion; EMA200 ($103k) = macro citadel;
∴ Momentum: RSI, MACD, ADX in alignment with descent, affirming stoic acceptance of downward will;
∴ Capital Flow: OBV and MFI declare liquidity leaving, distribution sealing bearish fate;
∴ Oracle: Oversold Stoch RSI whispers of fleeting respite, not salvation;
∴ Structure of Flow: Unlike past cycles, inflow discipline holds; coins remain largely in cold storage;
∴ Momentum of Will: Market decline is technical, not yet forced by whales. Bears act by structure, not by panic;
∴ Fate of Distribution: Without inflow surges, spot-driven capitulation remains unlikely; path to $103K relies on derivative liquidation.
⊢
✦ Structure Thus:
∴ The market embodies stoic compression;
∴ Only a reclaim >$113.4k reopens neutrality;
∴ Loss of $108k pulls destiny to ($104 / 103k);
∴ Fate sealed in bearish compression, awaiting expansion - logic sealed;
∴ On-chain inflows confirm the absence of mass panic;
∴ Technical charts dominate destiny;
∴ Bears have structure, but not yet blood;
∴ Bulls retain a chance if they defend $108K with low inflows sustained.
⊢
⚚ Unified Insight (Technical + On-Chain):
∴ Technical: Bitcoin clings to Fib 0.382 ($108K); failure = ($104 / 103K). Momentum + OBV favor bears.
∴ On-Chain: No whale capitulation; inflows remain muted, meaning downside is not spot-led.
✴️ Consequence: If inflows stay low, bulls may engineer a bounce at $108K -> $111K. If derivatives trigger cascade, EMA200 ($103K) becomes the stoic fortress.
⊢
· Cryptorvm Dominvs · MAGISTER ARCANVM · Vox Primordialis ·
· Dominivm Cardo Gyratio Omnivm · Silence precedes the next force. Structure is sacred ·
⊢
Bitcoin - Structure in Compression, Silence Before Expansion?⊣
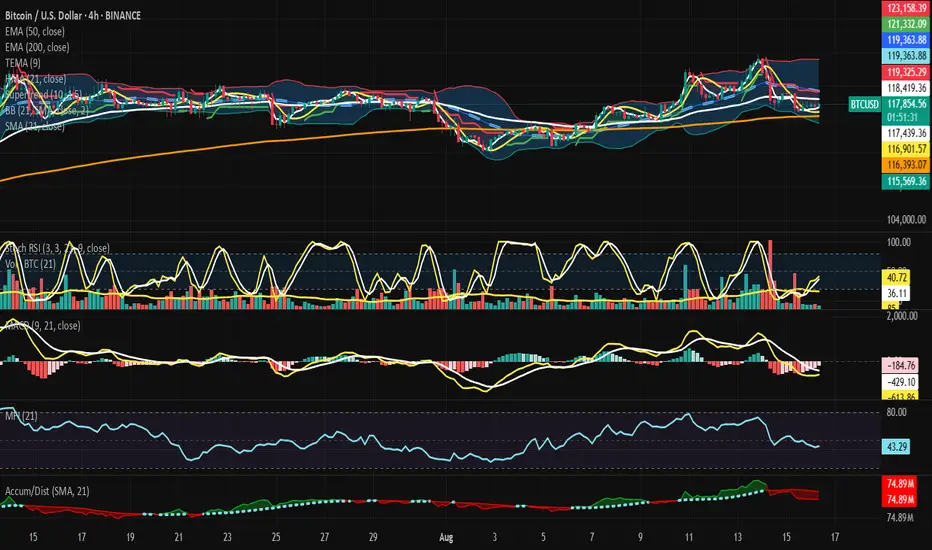
⟁ BTC/USD - BINANCE - (CHART: H4) - (Aug 16, 2025).
◇ Analysis Price: $118,020.60.
⊣
⨀ I. Temporal Axis - Strategic Interval - (H4):
▦ EMA50 - $118,425.87:
∴ The EMA50 is currently positioned slightly above the active trading price - ($118,020.60), establishing a localized resistance zone, showing that the market is struggling to sustain momentum above this median dynamic level;
∴ In recent sessions, price action fluctuated around EMA50, but failed to reclaim it as stable support, indicating weakness in short-term recovery attempts;
∴ The slope of EMA50 remains almost flat, not strongly ascending, suggesting market indecision and lack of directional strength.
✴️ Conclusion: EMA50 is a resistance barrier, neutral-to-bearish unless reclaimed decisively.
⊢
▦ EMA200 - $116,394.72:
∴ The EMA200, being a long-term stability reference, is below the current market price, acting as structural support for the mid-term;
∴ The wide gap between EMA200 and EMA50 indicates a neutral compression phase — price oscillating between medium and long horizons;
∴ If the market falls back toward EMA200, buyers may attempt defense; a breach would confirm broader weakness in market structure.
✴️ Conclusion: EMA200 is a strong support anchor, still intact, but tested boundaries are plausible.
⊢
▦ TEMA9 - $117,520.39:
∴ TEMA9 is below the current price, serving as immediate dynamic support, often used by short-term traders;
∴ Market bounces in the last sessions respected this fast-moving indicator, giving temporary confidence to bulls;
∴ However, repeated retests weaken its authority, showing fragility in momentum if volume does not sustain.
✴️ Conclusion: TEMA9 is immediate support, fragile, requiring reinforcement by volume.
⊢
▦ HMA21 - $116,919.69:
∴ The HMA21 lies under market value, acting as secondary support, confirming alignment with EMA200 as part of the supportive axis;
∴ Its curve is slightly ascending, signaling a faint bullish rebound in the short horizon;
∴ Alignment below price confirms resilience but also dependency - if price collapses, this level could break swiftly.
✴️ Conclusion: HMA21 is secondary support, dynamic yet vulnerable to volatility.
⊢
▦ SMA21 - $119,371.78:
∴ SMA21 sits above current price, working as resistance, in opposition to the supports listed (HMA21/TEMA9);
∴ This creates a compression corridor: TEMA9 + HMA21 (support) vs SMA21 (resistance);
∴ Market structure indicates stagnation inside a tight channel, waiting for breakout or breakdown.
✴️ Conclusion: SMA21 is resistance, framing the price in a boxed range.
⊢
▦ SuperTrend (10, 1.5) - $119,325.29:
∴ The SuperTrend remains above the actual price, signaling a bearish bias;
∴ Market action is still below its trigger, rejecting short-term bullish confirmation;
∴ Only a sustained breakout above this level could alter the bearish sentiment.
✴️ Conclusion: SuperTrend = Bearish stance remains active.
⊢
▦ BB (21, 2) - Upper: $123,154.36 / Basis: $119,371.78 / Lower: $115,589.21:
∴ Price is compressed between the midline (basis) and lower band, showing weakness;
∴ Recent volatility spikes touched the upper band but were rejected, confirming lack of strength;
∴ The narrowing of bands signals imminent expansion - market preparing for stronger volatility move.
✴️ Conclusion: Bollinger = Compression near lower range, potential breakout ahead.
⊢
▦ StochRSI (3, 3, 21, 9) - K: 44.11 / D: 37.23:
∴ Both K and D lines are mid-range, neither oversold nor overbought, reflecting indecision;
∴ The slight upward crossing indicates a possible rebound attempt, but weak until confirmed by momentum;
∴ Position in neutral zone diminishes conviction - signal could reverse quickly.
✴️ Conclusion: StochRSI suggests fragile recovery, neutral-to-bullish bias.
⊢
▦ Volume (21) - 9 / 85:
∴ Current volume is extremely weak compared to the SMA21, showing low conviction;
∴ This volume drought reduces the probability of sustainable breakouts;
∴ Whales or institutions are not actively engaged at this moment.
✴️ Conclusion: Volume shows lack of strength; market drifting without strong participation.
⊢
▦ MACD (9, 21, 9) - MACD: -170.26 / Signal: -425.48 / Histogram: -595.74:
∴ MACD remains negative, showing bearish underlying pressure;
∴ Histogram is contracting, indicating that bearish momentum is slowing down, but not reversed;
∴ A bullish crossover is still distant, weakening bullish recovery chances in near term.
✴️ Conclusion: MACD = Bearish pressure moderating, no reversal confirmed yet.
⊢
▦ RSI (21, 9) - 43.19:
∴ RSI is below 50, confirming bearish bias;
∴ Position not yet oversold, showing market retains room for further downside;
∴ The flat slope reflects indecision - neither strong selling panic nor buying force.
✴️ Conclusion: RSI = Bearish-neutral, momentum still under equilibrium.
⊢
▦ MFI (21) - 43.19:
∴ MFI mirrors RSI levels, confirming lack of strong inflow or outflow;
∴ Volume-weighted money flow confirms market neutrality, slightly leaning bearish;
∴ No divergence spotted to suggest imminent reversal.
✴️ Conclusion: MFI = Neutral, aligned with RSI weakness.
⊢
▦ OBV (21) - 74.89M:
∴ OBV is flat, not rising in accordance with recent small price upticks, showing lack of buyer confirmation;
∴ Absence of strong accumulation suggests price is rising on weak grounds;
∴ If OBV fails to climb, rallies will likely fail at resistance points.
✴️ Conclusion: OBV confirms weak demand, neutral-bearish stance.
⊢
🜎 Strategic Insight - Technical Oracle:
∴ The H4 structure reveals a compressed battlefield: dynamic supports (TEMA9, HMA21, EMA200) try to sustain price above $116K–117K, while layered resistances (EMA50, SMA21, SuperTrend, BB basis) weigh down overhead near $118K–119K;
∴ Volume collapse and flat OBV expose the fragility of bullish attempts, showing lack of participation. RSI and MFI align at ~43, signaling neutrality with bearish tilt. MACD remains negative, albeit moderating, hinting bearish exhaustion rather than reversal;
∴ Thus, BTC/USD stands in tense equilibrium: support corridor anchored near $116K, resistance dome at $119K;
∴ Market awaits volatility ignition, and the Bollinger Band squeeze warns a breakout is imminent;
∴ Without volume, upward attempts risk collapse; with momentum reactivation, resistance layers may fracture.
⊢
𓂀 Stoic-Structural Interpretation:
∴ The chart reveals not strength, but suspension - Bitcoin hovers between its moving average guardians, caught within corridors of compression where price neither collapses nor ascends with conviction;
∴ EMA50 denies passage above, while EMA200 anchors from below - structure is preserved not by will, but by inertia;
∴ Indicators whisper the same tale: RSI and MFI linger at 43, momentum without fire, money without decisive flow;
∴ MACD stays in the shadows, still negative, showing the bear’s hand loosening but not releasing;
∴ OBV remains flat, silence of accumulation, a desert where no buyer’s army marches;
∴ Bollinger Bands coil tighter, warning of the coming storm - when silence stretches, force prepares.
✴️ Stoic Arcane Conclusion: The market does not yield to hope nor despair, it waits - stillness before expansion. To the disciplined observer, this is not chaos, but structure: a narrowing gate where patience is the true weapon.
⊢
✦ Structure:
∴ The H4 battlefield is confined within a narrow dominion - ($116,000 to $119,500) - where supports (TEMA9, HMA21, EMA200) forge the lower bulwark, and resistances (EMA50, SMA21, SuperTrend, BB Basis) construct the ceiling;
∴ Momentum oscillators (RSI, MFI, StochRSI) hover in neutrality, neither signaling exhaustion nor ignition, mirroring the market’s stoic posture;
∴ MACD remains submerged in negative territory, its histogram contracting, a sign of fading bearish strength but absent bullish conquest;
∴ Volume and OBV betray the truth: demand is hollow, accumulation is absent, and rallies lack the blood of conviction;
∴ Bollinger compression seals the chamber, a tightening coil foretelling release - structure bends, not breaks, awaiting its destined expansion.
✴️ Structural Seal: The architecture is one of suspended energy, a locked formation where silence is not weakness, but the breath before eruption.
⊢
· Cryptorvm Dominvs · MAGISTER ARCANVM · Vox Primordialis ·
· Dominivm Cardo Gyratio Omnivm · Silence precedes the next force. Structure is sacred ·
⊢
Bitcoin – Beneath the Dual Gate, Volatility Coiled in Silence.⊣
⟁ BTC/USD - BINANCE - (CHART: H1) - (Aug 15, 2025).
◇ Analysis Price: $117,097.61.
⊣
⨀ I. Temporal Axis - Strategic Interval - (H1):
▦ EMA9 - $117,809.31:
∴ Price trades below EMA9, preserving micro‑bearish control and confirming sellers’ initiative;
∴ The slope is negative, indicating persistent downside inertia rather than mere mean reversion;
∴ First tactical recovery requires candle close above EMA9 with follow‑through, otherwise rebounds are fade‑prone.
✴️ Conclusion: EMA9 is the first gate; below it, bears command intraday flow.
⊢
▦ EMA21 - $118,360.89:
∴ EMA21 sits above price and aligns with BB mid‑band, forming a structural ceiling;
∴ The angle remains down, synchronizing with the broader short‑term trend;
∴ Failure to reclaim EMA21 after testing EMA9 typically resets momentum to the downside.
✴️ Conclusion: EMA21 is the primary ceiling for any rebound attempt.
⊢
▦ VOLUME (21) - 146 / 587:
∴ Background participation is muted outside sell‑offs, signaling weak dip‑buying interest;
∴ Climax bars are associated with down candles, not expansions up;
∴ Without buy‑side expansion, momentum reversals tend to be shallow.
✴️ Conclusion: Energy is bear‑weighted; buyers have not stepped in size.
⊢
▦ BB (21, 2) - $119,636.52 / $118,360.89 / $117,085.27:
∴ Price hovers near the lower band, evidencing pressure and travel along the band;
∴ Bands remain expanded after the drop, encoding elevated realized volatility;
∴ Mid‑band = EMA21, thus a confluence cap on rallies.
✴️ Conclusion: Volatility high; equilibrium at the mid‑band acts as resistance.
⊢
▦ RSI (21, 9) - 33.19 / 37.33:
∴ RSI sub‑40 denotes bearish momentum and risk of trend continuation;
∴ No clean bullish divergence vs. recent lows is visible;
∴ Any bounce from 30–35 must couple with price reclaim of EMA9/21 to matter.
✴️ Conclusion: Momentum weak; relief bounces need validation.
⊢
▦ ATR (21) - 591.97:
∴ ATR elevation reflects wide hourly ranges and unstable micro‑regime;
∴ Expansion followed the breakdown, favoring impulsive moves over drift;
∴ Risk management must assume larger stop distances until contraction resumes.
✴️ Conclusion: Tactical caution-range expansion risk remains.
⊢
▦ MACD (9, 21, 9) - (-146.58 / -405.01 / -551.59):
∴ MACD and Signal are well below zero, confirming bear trend state;
∴ Histogram remains negative, indicating ongoing pressure from sellers;
∴ No confirmed bullish cross—only early flattening attempts.
✴️ Conclusion: Bearish momentum dominant; confirmation for bulls is absent.
⊢
▦ Fibonacci Retracement - (High $124,474.00 / Low $116,803.99):
✦ Fibo Framework - (High/Low defined, bias rules):
∴ While price is below 0.786, the retracement ladder acts as stacked resistance;
∴ Each level demands close + acceptance (multiple candles) to unlock the next;
∴ Rejection at any level implies rotation back to prior support with risk to the swing low.
✴️ Conclusion: Framework is bear‑tilted until 0.786 is reclaimed and held.
⊢
✦ Fibo 0.786 - $118,445.37:
∴ Sits just above price and near EMA21/BB mid‑band, forming a triple confluence cap;
∴ First bullish test must be clean breakout + hold above to prevent immediate fade;
∴ Rejection here typically re‑opens a drive toward $117,085 / $116,804.
✴️ Conclusion: Primary gate; breach converts short‑term bias from survival to recovery.
⊢
✦ Fibo 0.618 - $119,733.93:
∴ Traditional “golden” test where failed rallies often reverse;
∴ If price reaches 0.618 with rising volume + RSI > 45, momentum regime improves;
∴ Rejection here frequently leads to lower‑high structures.
✴️ Conclusion: Momentum checkpoint; acceptance upgrades the bounce to trend‑threatening.
⊢
✦ Fibo 0.500 - $120,639.00:
∴ Marks the mid‑retracement; crossing it often flips narrative from counter‑trend to trend‑repair;
∴ Watch for EMA21 flatten → turn up once 0.5 is held;
∴ Failure after tagging 0.5 usually prints a bull trap.
✴️ Conclusion: Structural pivot—hold above = constructive shift.
⊢
✦ Fibo 0.382 - $121,544.06:
∴ The “no‑man’s land” where sellers often defend to keep macro swing intact;
∴ Requires higher highs/higher lows on intraday to persist;
∴ Confluence with prior supply zones strengthens defense.
✴️ Conclusion: Resistance band; acceptance here signals maturing reversal.
⊢
✦ Fibo 0.236 - $122,663.88:
∴ Late‑stage retracement where profit‑taking on longs is common;
∴ If reached quickly with volume, risk of exhaustion wick increases;
∴ Only strong breadth can push a sustained extension.
✴️ Conclusion: Overhead capstone unless momentum surges.
⊢
✦ Fibo 1.000 (Base) - $116,803.99:
∴ Final defensive line for the swing;
∴ A clean hourly close below exposes extension toward measured‑move targets;
∴ Positive response here needs divergence + reclaim of EMA9 to matter.
✴️ Conclusion: Last bastion; loss invites deeper correction.
⊢
🜎 Strategic Insight - Technical Oracle:
∴ The H1 battlefield is etched with a Dual‑Gate Resistance at ($118,360 – $118,445) - (EMA21 + BB mid + Fibo 0.786);
∴ Below it, bears keep initiative; above it, the ladder opens to ($119,734 - $120,639 - $121,544);
∴ Momentum (RSI/MACD) remains bear‑set, and volume does not yet sponsor a reversal;
∴ ATR warns that the next impulse will be forceful: rejection at 0.786 likely revisits ($117,085 - $116,804);
∴ Clean acceptance above 0.786 converts the tape into repair mode, aiming first for 0.618.
⊢
𓂀 Stoic-Structural Interpretation:
∴ The chart does not plead-it states. Bitcoin stands pressed beneath the Seal of Resistance, forged by EMA21, BB mid-band, and Fibo 0.786, a triple convergence that turns each bullish attempt into trial;
∴ Below this seal, the market breathes in short bursts, oscillating between survival near $117,085 and the abyss at $116,804, while the higher rungs of Fibonacci remain untouched fortresses;
∴ RSI lingers near exhaustion, MACD sunk deep in negative terrain-signs of a mind under weight, yet with latent potential should the first gate break;
∴ Volume’s silence betrays the absence of conviction, while ATR whispers of a coiled force, ready to erupt without warning.
⚖️The Stoic mind perceives no chaos here-only order hidden in compression.
∴ To strike prematurely is to feed the opposing force;
∴ To wait for the breach, with discipline, is to act when the veil lifts;
∴ Thus, the practitioner stands patient, knowing that in markets, as in life, the gate opens only when necessity aligns with strength.
⊢
✦ Structure:
∴ Primary Battlefield: ($118,360 – $118,445) - the Dual-Gate Resistance where EMA21, BB mid-band, and Fibo 0.786 converge into a single fortified wall;
∴ Upper Ladder: ($119,734 -> $120,639 -> $121,544 -> $122,663) - sequential Fibonacci rungs, each a higher plane of contest, demanding proof of momentum before ascension;
∴ Lower Bastions: ($117,085 -> $116,804) - defensive stones at the base of the current swing, where loss would confirm structural surrender;
∴ Momentum State: RSI anchored in bearish terrain, MACD submerged, volume muted - signaling that price remains in a defensive stance;
∴ Volatility Field: ATR expanded, forecasting sudden, decisive thrusts once either the upper or lower gates yield.
✴️ Strategic Frame: The structure is one of compression beneath a fortified ceiling, coiled with the energy to either breach into a recovery ladder or cascade into deeper correction. The next movement will not wander-it will strike.
⊢
· Cryptorvm Dominvs · MAGISTER ARCANVM · Vox Primordialis ·
· Dominivm Cardo Gyratio Omnivm · Silence precedes the next force. Structure is sacred ·
⊢

Bitcoin Structure in Stillness, Power in Silence, Just Control?⊣
⟁ BTC/USD - BINANCE - (CHART: H1) - (Aug 02, 2025).
◇ Analysis Price: $113,869.77.
⊣
⨀ I. Temporal Axis - Strategic Interval - (1H):
▦ EMA9 - ($113,889.32):
∴ The price is trading just below the EMA9, which acts as immediate reactive resistance;
∴ The short-term slope remains negative, with no breakout signal;
∴ Buyers are unable to push the price above this threshold, indicating technical weakness.
✴️ Conclusion: Momentum remains capped; the EMA9 has not been reclaimed.
⊢
▦ EMA21 - ($113,896.52):
∴ The EMA21 stands as a tactical compression line in this range;
∴ The close proximity of EMA9 and EMA21 forms a technical knot - indecision zone;
∴ Past rejections in this region reinforce it as a powerful barrier.
✴️ Conclusion: Mid-range resistance holds; continuation is blocked unless breached with volume.
⊢
▦ EMA50 - ($114,128.22):
∴ EMA50 defines the current macro resistance on the 1H chart;
∴ The price has yet to test this level directly after the last drop;
∴ For structural recovery, this line must be broken cleanly with follow-through.
✴️ Conclusion: Primary obstacle on the path to reversal - decisive zone.
⊢
▦ BB (21 + EMA9) - Status: Compression:
∴ Bands are tightening around the price, signaling low volatility;
∴ Price action is contained within the central channel;
∴ Indicates upcoming volatility spike - direction still unknown.
✴️ Conclusion: Volatility compression is active; no directional bias confirmed.
⊢
▦ Volume + EMA21 - (3.84 BTC):
∴ Trading volume remains below the EMA21 period average;
∴ No surge of bullish commitment visible;
∴ Momentum lacks conviction without participation.
✴️ Conclusion: Absence of volume undermines the strength of any move.
⊢
▦ RSI (21, 9) - (42.37):
∴ RSI hovers in the lower neutral band - weak momentum;
∴ Slight upward curve suggests a modest rebound;
∴ No divergence or strength signal confirmed.
✴️ Conclusion: Minor relief rally underway - structurally weak.
⊢
▦ MACD (9, 21, 9) - (MACD: -238.89 / Signal: -340.58):
∴ Bullish crossover confirmed, histogram positive;
∴ Both lines remain in bearish territory - (below zero);
∴ Trend momentum is building but not strong enough to reverse.
✴️ Conclusion: Technical rebound in play - not a structural shift.
⊢
▦ Stoch RSI (3, 3, 21, 9) - (%K: 58.90 / %D: 52.70):
∴ Positive crossover established and advancing in neutral-upper zone;
∴ No overbought signal;
∴ Possibility of further upside if confirmed with price action.
✴️ Conclusion: Oscillator supports continuation - contingent on volume.
⊢
▦ OBV (21, BB2) - (26.35K):
∴ OBV remains flat, indicating market indecision;
∴ No divergence with price movement;
∴ No fresh buying pressure detected.
✴️ Conclusion: Neutral volume behavior - flow not favoring bulls.
⊢
🜎 Strategic Insight - Technical Oracle:
∴ The 1H chart of (BTC/USD) reveals a battlefield sealed in compression and anticipation.
The price is locked beneath converging exponential resistances (EMA9, EMA21, EMA50), forming a triple entrenchment zone. None have been broken - each rejection reinforces the stronghold;
∴ The Bollinger Bands constrict like a ritual binding. Volatility is silent - too silent - awaiting the spark. Yet no participant steps forward with force; volume remains suppressed, showing that neither side has declared war;
∴ Momentum oscillators (RSI, Stoch RSI) hint at an upward drift, but these are echoes, not proclamations;
∴ The MACD crossover is not a trumpet - it is a murmur in the underworld, below the zero line, concealed from the living trend;
∴ The OBV confirms it: no one is entering the field with conviction. This is not a battlefield - it is a waiting room;
✴️ And yet, amidst this silence, the Code speaks:
∴ If the zone between ($114.1K and $114.6K) is breached with volume and confirmation, this will mark the first true structural challenge to the prevailing descent. If it fails - the repique folds into another trap, devoured by gravity.
⊢
∫ II. On-Chain Intelligence - (Source: CryptoQuant):
▦ Exchange Inflow Total + EMA9 - (All Exchanges) - (6.2K BTC):
∴ The total Bitcoin flowing into centralized exchanges remains subdued, with no signs of aggressive sell-side pressure;
∴ The EMA9 confirms a flat, low-intensity behavior, distinct from capitulation spikes;
∴ The absence of major inflows during price compression implies a strategic wait state.
✴️ Conclusion: No incoming threat detected - institutions are not preparing to sell.
⊢
▦ Exchange Netflow Total + EMA9 - (All Exchanges) - (-644.5 BTC):
∴ Netflow remains negative, indicating Bitcoin is being withdrawn from exchanges rather than deposited;
∴ A negative netflow during a price downtrend reflects silent accumulation behavior or rotation into cold storage;
∴ The EMA9 shows a consistent drainage pattern, not episodic outflow.
✴️ Conclusion: This confirms defensive posture by large holders - supporting the technical compression.
⊢
▦ Spent Output Profit Ratio - (SOPR) + EMA9 - (1.003):
∴ The SOPR hovers just above 1.0, suggesting coins moved on-chain are being sold at or near cost basis;
∴ No signs of aggressive profit-taking or panic selling - rather, equilibrium behavior;
∴ The 9-period EMA confirms stability in this zone.
✴️ Conclusion: Market psychology is suspended - no one is winning or losing.
⊢
🜎 Strategic Insight - On-Chain Oracle:
∴ All on-chain signals reflect preparation without declaration;
∴ No pressure enters, and no blood leaves;
∴ The field is not empty - it is coiled;
∴ Withdrawals - (Netflow) - suggest protective accumulation;
∴ Low Inflow signals no new panic supply;
∴ SOPR near 1.0 says: (We're all waiting - and none are ahead);
∴ The technical compression in price is not betrayed by the chain;
∴ The silence is consistent;
∴ But silence is not peace - it is a veil.
✴️ Conclusion: If volume does not breach $114.6K - all remains a ghost echo beneath resistance.
If broken - the coil unwinds.
⊢
⧉ III. Contextvs Macro-Geopoliticvs - Interflux Economicvs - (Aug 02, 2025):
⟁ All movements of the market's breath are influenced not only by price, nor volume, but by the tides beyond the chart. Here begins the reading of the outer realm:
▦ EVENTVM I - (Wall Street Silent Accumulation) - (U.Today + Coindesk):
∴ Institutional actors are actively acquiring BTC and ETH through stealth operations - not OTC spikes, but ETF inflows and treasury balance shifts;
∴ Tom Lee (Bitmine/Fundstrat) confirms: Wall Street is not waiting for clarity, it is accumulating in silence;
∴ SEC’s Project Crypto and “in-kind” ETF mechanisms further reduce friction for institutional entry.
✴️ Conclusion: Price stagnation conceals power transfer - retail hesitates while funds consolidate control.
⊢
▦ EVENTVM II - (SEC’s “Project Crypto” Activation):
∴ Regulatory framing under “Project Crypto” unfolds in phases: transparency, compliance infrastructure, and institutional bridges;
∴ Despite its regulatory mask, the program facilitates liquidity channels into crypto markets;
∴ Legalized ETF's now serve as strategic vacuum points for Bitcoin supply.
✴️ Conclusion: What appears as regulation is in fact an alignment mechanism - structure over rebellion.
⊢
▦ EVENTVM III - (July ETF Flows (US) - $12.8B Inflow):
∴ U.S.-based crypto ETF's report record-breaking $12.8 billion inflows in July alone;
∴ Largest flows tracked in BlackRock, Fidelity, and VanEck vehicles - no signs of reversal;
∴ These flows occurred during price weakness, not during breakout - a signature of accumulation.
✴️ Conclusion: The public hesitates while custodians act - the veil of weakness conceals a new floor.
⊢
🜎 Strategic Interpretation - Macro Context:
∴ The charts compress. The flows retract;
∴ But the outer forces converge - Wall Street is no longer watching. It is acquiring;
∴ Through structure, silence, regulation, and engineering of access;
∴ This is no longer the market of peer-to-peer rebellion;
∴ This is the codification of power into institutional hands;
✴️ Conclusion: Price may appear static - but ownership is shifting.
⊢
𓂀 Stoic-Structural Interpretation:
∴ The chart does not lie. The data does not beg. The market does not care. Bitcoin remains trapped beneath resistance - not by force, but by inaction, by lack of intention, by silent contest;
∴ On-chain signals whisper: no one is selling in panic, no one is buying in euphoria;
∴ The macro realm reveals: the hands of power are moving beneath regulation, using silence as shield;
∴ Thus we see a paradox - the technical shell compresses, the on-chain bloodstream circulates without fever, the macro structure redefines.
⚖️ The Stoic mind recognizes this not as chaos, but as necessary stillness.
∴ The Arcane practitioner does not chase a move - he maps the pressure points and waits;
∴ He acts only when the veil thins;
∴ To act prematurely is to violate the structure;
∴ To wait blindly is to betray the will;
∴ The Stoic Arcane path demands this: know the boundary, seal the insight, then act - once - with clarity;
∴ At ($114.6K) the veil may part. If it does not - the silence continues.
⊢
✦ Structure Bearish.
▦ This is a bearish containment, not a breakdown.
∴ The market is not collapsing - it is being held below by absence of volume, of intention, of structural reversal;
∴ The EMA's are stacked above like iron gates;
∴ The price has failed to break $114.6K - the veil remains intact;
∴ On-chain data confirms neutrality, not optimism;
∴ Macro signals suggest accumulation by institutions - but not defense for the public.
⊢
🜎 Therefore:
∴ Technically Bearish - (structure not yet reversed);
∴ Tactically Neutral to Bearish - (fragile repique);
∴ Strategically in Transition Phase - (institutions buying beneath silence).
✴️ Conclusion: Until ($114.6K) is broken with conviction, the structure remains bearishly biased - wrapped in stillness.
⊢
⧉
· Cryptorvm Dominvs · MAGISTER ARCANVM · Vox Primordialis ·
⚜️ ⌬ - Silence precedes the next force. Structure is sacred - ⌬ ⚜️
⧉
⊢

Bitcoin Monthly - Structure Intact, Tension Rising?⊣
⟁ BTC/USD - BINANCE - (CHART: 1M) - (Aug 01, 2025).
◇ Analysis Price: $114,994.73.
⊣
⨀ I. Temporal Axis - Strategic Interval - (1M):
▦ EMA9 - ($100,069.29):
∴ Price holds 14.93% above this dynamic threshold, indicating momentum continuation but also positioning within an overheated range;
∴ The EMA9 structure is firmly ascending, representing the spine of the short-term bullish wave;
∴ July’s candle remains fully above the EMA without testing it - no wick beneath the line-marking dominance of buyers without internal correction.
✴️ Conclusion: The EMA9 governs the tempo of the current trend and stands untouched. Elevated, but structurally intact.
⊢
▦ EMA21 - ($81,990.60):
∴ A core support vector in the macrostructure, now 28.73% below price, suggesting strong bullish detachment from equilibrium;
∴ The line maintains a smooth, upward slope, echoing the recovery arc since late 2022’s structural low;
∴ Its alignment with the Bollinger Basis and Realized Cap forms a triad of reinforced technical stability.
✴️ Conclusion: EMA21 anchors the mid-term uptrend and guards the sanctum of continuation. No breach, no threat.
⊢
▦ EMA50 - ($47,983.10):
∴ Deep beneath price, resting at 58.27% below the current level - a relic of past cycles, yet still relevant as ancestral support;
∴ The EMA50 has curved upward subtly, signaling the final stage of long-term bear cycle recovery;
∴ Price has not interacted with this zone since late 2023, preserving its status as last-resort structural bedrock.
✴️ Conclusion: EMA50 serves as the sacred foundation of the macro trend - distant, but silently upholding the higher order.
⊢
▦ BB (21, 2) - ($81,990.60, $124,871.91, $39,109.29):
∴ The Basis of the bands aligns precisely with the EMA21, confirming equilibrium at ($81,990.60) - the mid-guardian of the macro cycle;
∴ The Upper Band is currently intersecting the candle body at ($124,871.91), marking an imminent volatility ceiling that may trigger either breakout or rejection;
∴ The Lower Band rests at ($39,109.29), far beneath the trend structure, now serving as a shadow chamber rather than an active field of probability.
✴️ Conclusion: The BB channels have opened widely, signaling expansion. With price nearing the upper rim, the phase is volatile but directional. The core remains intact through the EMA21 basis.
⊢
▦ Volume + EMA21 - (37.62B, 29.71B):
∴ Monthly volume for July reached $37.62 Billion, standing above the EMA21 of volume at $29.71 Billion, indicating an active expansion phase in market participation;
∴ This is the third consecutive monthly close above the EMA21, forming a sequence of rising activity that mirrors the price climb - suggesting healthy conviction behind the movement;
∴ The volume body also aligns with bullish momentum confirmation, as it occurs within an ascending slope of the EMA21, avoiding false divergence or exhaustion patterns.
✴️ Conclusion: Volume expansion supports the current trend. The flow is consistent, not speculative.
⊢
▦ RSI (21, 9) - (69.79, 64.71):
∴ The RSI main line stands at (69.79), nearing the classical overbought threshold but not breaching it, reflecting a strong yet controlled uptrend;
∴ The signal line (9-period smoothing) trails at (64.71), confirming positive pressure without showing divergence - both curves remain aligned and ascending;
∴ There is no crossover, no rejection, and no curvature breakdown - suggesting momentum still leans bullish, but the zone is tightening.
✴️ Conclusion: RSI reveals active strength under equilibrium control. Nearing the gates of exhaustion, but no conflict yet.
⊢
▦ MACD (9, 21, 9) - (4,172.31 / 3,423.95 / +748.36):
∴ The MACD Line remains well above the Signal Line, holding a spread of (+748.36), confirming an active momentum cycle;
∴ Both lines are above the zero axis, reinforcing a long-standing bullish wave with consistent inertia since late 2023;
∴ The Histogram is positive, though it shrinks slightly from previous months, suggesting a potential slowing of force - not a reversal, but a breath.
✴️ Conclusion: The MACD still flows in favor of the bulls. The pulse continues, yet shows first signs of contraction. Momentum remains, but vigilance awakens.
⊢
▦ OBV (21, BB2) - (10.27M / 9.82M / 11.19M / 8.45M):
∴ The OBV line rests at (10.27M), positioned above the Basis (EMA21 at 9.82M), indicating a net accumulation bias over the mid-term;
∴ It remains within the upper half of the Bollinger channel, but beneath the upper band, currently at (11.19M), suggesting accumulation without climax;
∴ The bands are widening, signaling expanding participation and heightened flow volatility - yet without destabilization.
✴️ Conclusion: OBV confirms active, steady inflow. Accumulation sustains the structure. Flow is present, but not yet euphoric.
⊢
▦ MFI (EMA9) - (79.90 / 74.63):
∴ The MFI registers at (79.90), resting near the upper saturation zone, traditionally viewed as overbought - but no rejection candle has occurred;
∴ The 9-period EMA smoothing line at (74.63) trails cleanly beneath, reinforcing directional alignment without divergence;
∴ This spread between the MFI and its smoothing curve affirms a persistent inflow dominance, though now nearing exhaustion thresholds.
✴️ Conclusion: The MFI reveals an environment of strong capital influx. Though high, it is not yet reversal-bound. Compression may precede contraction.
⊢
▦ TDI + EMA21 - (69.79 / 64.71 / / 62.00):
∴ The RSI Line (TDI core) sits at (69.79), nearing the volatility band’s upper arc, denoting strong upward rhythm but with limited expansion room;
∴ The Signal Line at 64.71 lags slightly, confirming the trend with no divergence or curvature weakness;
∴ The Volatility Bands (±10 around Signal) contain price action cleanly - upper band at (74.60), lower at (58.83) - showing moderate but controlled pressure;
∴ The EMA21 overlay at (62.00) forms the base layer, maintaining upward inclination and reinforcing long-term trend security.
✴️ Conclusion: The TDI remains bullish, harmonized, and stable. Momentum leads, volatility permits. No rejection yet, but expansion space is finite.
⊢
🜎 Strategic Insight - Technical Oracle:
𓂀 The monthly structure reveals a state of controlled elevation within a structurally sound uptrend, yet with rising compression near upper bounds. The convergence of indicators outlines a field that is both fortified and tense;
∴ EMA9, EMA21, and EMA50 remain fully aligned and ascending - the Exponential Trinity forms a resilient foundation, untouched by regression;
∴ Bollinger Bands (21) have widened, and price now hovers near the Upper Band, suggesting that the volatility channel is at maximal stretch; further price advance may trigger short-term exhaust or rejection;
∴ Volume + EMA21 confirms that market participation has expanded meaningfully across three consecutive months - a sign of conviction rather than speculation;
∴ RSI (21, 9) and MFI (EMA9) hover in elevated zones, signaling latent overextension, yet without immediate signs of breakdown - still ruled by strength, not fear;
∴ MACD (9, 21, 9) retains bullish momentum, though its histogram begins to contract slightly, marking a potential early shift in impulse rhythm;
∴ OBV confirms accumulation without climax, and the TDI shows synchrony, yet the volatility band ceiling is near - a gateway, or a wall.
✴️ Synthesis Technical: The structure is strong, but stretched, all trend anchors remain intact, and no macro-reversal signal is present. However, the cluster of elevated oscillators and narrowed volatility envelopes warns:
∴ The next impulse will define the phase - either breakout beyond resistance ($125K+) or pullback to base zones near EMA21 (~$82K).
⊢
∫ II. On-Chain Intelligence - (Source: CryptoQuant):
▦ Realized Cap - UTXO Age Bands - ($437.6B):
∴ Capital density remains clustered in the 3m / 12m range, signifying strong mid-term holders anchoring price memory beneath $90K;
∴ The realized cap has risen steadily, confirming new capital commitment and reinforcing the EMA50 region as the “Arcane Bedrock”;
∴ No abrupt aging shift - holders have not fled, nor distributed heavily.
✴️ Conclusion: The realized cost base is lifting upward; Structure is strong beneath price.
⊢
▦ Whale to Exchange Transactions (Binance) - (Rising):
∴ Transfer spikes occurred in mid and late July, echoing pressure near technical ceilings;
∴ Whale flow to exchanges signals potential supply reloads, though no persistent distribution trend is confirmed;
∴ Activity suggests readiness, not execution - threat held in silence.
✴️ Conclusion: Whales signal tension, not aggression; Movement is tactical.
⊢
▦ MVRV Ratio + EMA9 - (2.257 / 2.039):
∴ The MVRV ratio holds above 2.0, implying price trades at over twice the realized cost basis - historically a zone of caution;
∴ No divergence from the EMA9; both slope upward - valuation expansion continues, but no climax;
∴ Price remains above the line of equilibrium, but not in parabolic distortion.
✴️ Conclusion: MVRV confirms overvaluation, but not detachment; Risk is elevated, but contained.
⊢
▦ Exchange Net Position Change (BTC) - (–35,871 BTC):
∴ Net outflows persist, with 35,871 BTC withdrawn in the last monthly cycle;
∴ This behavior aligns with strategic cold storage accumulation, reducing circulating pressure;
∴ On-chain confirms technical's: price rises on supply contraction, not mere speculation.
✴️ Conclusion: Bitcoin leaves the field; Supply retracts as price ascends; Structure reinforced.
⊢
🜎 Strategic Insight - On-Chain Oracle:
𓂀 The on-chain field reveals a fortified structure of conviction beneath the surface of price. Flow, cost basis, and behavior of dominant agents all signal a phase of controlled strength, though shadowed by rising valuation pressure;
∴ The Realized Cap ascends in harmony with price - an uncommon convergence. It suggests that new capital is not merely speculating, but embedding itself into the very structure of the network. The UTXO Age Bands reveal no panic rotation - holders remain;
∴ Whale Transactions to Exchanges rise in key moments, particularly around technical compression points. They do not yet dominate the flow, but stand ready - guardians or destroyers, in silence;
∴ The MVRV Ratio, though elevated, does not deviate violently. It warns, but does not collapse. It reflects a price above cost, but not a mania;
∴ The Net Exchange Position continues its descent. Bitcoin leaves the field; Supply contracts; This is not exit liquidity; This is strategic withdrawal.
✴️ Synthesis Technical: The network breathes in accumulation, not inflation; The participants anchoring this cycle are deliberate; On-chain structures confirm that value is migrating into dormancy, not into exits. The risk is not in structure collapse, but in overvaluation compression - a tightening halo around price.
⊢
⧉ III. Contextvs Macro-Geopoliticvs - Interflux Economicvs - (Jul 31, 2025 - Post-FOMC Strategic Decoding):
▦ FOMC Decision - (July 31, 2025):
∴ The Federal Reserve held its benchmark interest rate steady at (5.50%), marking the fourth consecutive pause - a clear stance of vigilant hold;
∴ The tone was neutral-hawkish, acknowledging progress on inflation while leaving the door open for future hikes if data demands;
∴ No mention of cuts. The Fed maintains narrative control - a message to both markets and sovereigns: we're not done yet.
▦ Jerome Powell’s Address:
∴ Powell reiterated the “data-dependent” framework, but expressed concern over sticky inflation in services and housing;
∴ He praised the resilience of the labor market, signaling no urgency to ease policy;
∴ His delivery was measured, ambiguous by design, injecting uncertainty - fuel for volatility, not clarity.
▦ Market Response - (Traditional Finance):
∴ The DXY (Dollar Index) swung sharply, but closed neutral, reflecting indecision over the Fed’s path;
∴ The S&P500 and Nasdaq attempted intraday rallies but reversed lower - a reaction to Powell not being “dovish enough”;
∴ Gold and Silver caught bids - hedges moved in, not out.
▦ Bitcoin (BTC/USD) Response:
∴ Bitcoin spiked on initial Fed release, tagging the upper Bollinger Band (1M) before retreating slightly - not a rejection, but a breath;
∴ No capital flight occurred. The response was measured and strategic, not speculative;
∴ On H4, Bitcoin touched the EMA200, reinforcing it as a post-FOMC decision point.
✴️ Macro Synthesis: The Fed sheathed the blade but did not lower the shield; Powell’s message: discipline remains. Markets flinched but did not panic; Bitcoin stood firm. This was not a moment of collapse - this was a moment of calibration.
⊢
⌘ Codicillus Silentii - Strategic Note:
𓂀 Let this note be written in the margin of all oracles, beneath the seals and above the motion: This is a cycle governed not by noise, but by intent restrained; The silence between macro movements, the calm in on-chain flows, and the geometry of structure all speak one truth:
The system is waiting;
There is no breakdown;
There is no climax;
There is only a tightening coil - one that neither confirms euphoria nor accepts rejection.
∴ Bitcoin holds above its sacred averages;
∴ The on-chain breath is slow, but pure;
∴ The macro field is firm, yet not soft.
⟁ The next force will not be a whisper - it will be a break or a roar.
✴️ Let no position be based in hope;
✴️ Let no assumption ignore volatility’s patience;
✴️ Let silence guide the strategy, not emotion.
⊢
𓂀 Stoic-Structural Interpretation:
∴ In the mirror of the arcane chart and the silence of on-chain flow, the Stoic lens reveals not merely price action - but the nature of motion itself;
∴ All movement is governed by tension and release, control and surrender. This cycle is no different;
∴ The trend holds, but does not rise arrogantly. It is disciplined;
∴ Capital flows, but not chaotically - it retreats where needed and commits only in strength;
∴ The macro world tempts chaos, but Bitcoin walks with its own gravity - unmoved unless chosen;
∴ Indicators show power without delusion, and pressure without collapse.
This is not a time for euphoria;
This is not a time for panic;
This is a time to observe structure, act with clarity, and remain unshaken.
✴️ The Stoic sees the signal beneath the storm:
Structure is intact;
Trend is valid;
Valuation is tense;
Strategy must remain cold.
⟁ Therefore, the Stoic does not chase candles; He waits for break of structure, or confirmation of continuation; No action is better than misguided motion.
⊢
✦ Structure: Bullish - (Controlled Phase).
∴ All key exponential moving averages - EMA9, EMA21, and EMA50 - remain aligned and ascending, with no curvature breakdown or crossover threat;
∴ Momentum indicators (MACD, RSI, TDI) are positive and synchronized, with no bearish divergence or rejection confirmed;
∴ Price holds above the EMA9 and remains well above the Bollinger Basis, signaling ongoing trend dominance;
∴ Volume exceeds its 21-month moving average, reflecting conviction, not hollow motion.
⟁ However:
∴ The structure is technically stretched - several oscillators approach saturation thresholds, signaling compression, not collapse;
∴ This is a bullish structure, but under strategic tension, not euphoria.
✴️ Final Judgment: Bullish Structure, currently in a compressed expansion state, preparing for either breakout continuation or technical correction - but showing no signs of structural reversal.
⊢
⧉
· Cryptorvm Dominvs · MAGISTER ARCANVM · Vox Primordialis ·
⚜️ ⌬ - Silence precedes the next force. Structure is sacred - ⌬ ⚜️
⧉
⊢
Bitcoin - Structural Ascendancy under Silent Momentum.⊣
⟁ BTC/USD - BINANCE - (CHART: 1D) - (Jul 29, 2025).
◇ Analysis Price: $118,996.40.
⊣
⨀ I. Temporal Axis - Strategic Interval - (1D):
▦ EMA9 - (Exponential Moving Average 9) - ($118,352.22):
∴ This short-term exponential blade reflects immediate price sensitivity, showing reactive balance across recent closes;
∴ Price currently floats above this threshold, indicating micro-support for the bulls - a soft floor in the fog of uncertainty;
∴ The EMA9 line curves gently upward, though not sharply - signaling lingering momentum, but without fury.
✴️ Conclusion: EMA9 acts as a dynamic support amid deceleration; a watchful line between calm consolidation and renewed ascent.
⊢
▦ EMA21 - (Exponential Moving Average 21) - ($116,729.10):
∴ This mid-range trend beacon provides clearer directional context - its upward slope holds the spell of continuity;
∴ Price rests safely above this median force, confirming bullish alignment;
∴ However, the arc begins to curve with less conviction, a signal that the current push is softening.
✴️ Conclusion: EMA21 maintains bullish structure but foretells potential slowing; if momentum dims further, this level may serve as magnet for retracement.
⊢
▦ EMA50 - (Exponential Moving Average 50) - ($112,511.79):
∴ The long-arm average projects the memory of the trend - the deep root under the recent canopy;
∴ Price is far above this line, a sign of strong prior conviction from bulls;
∴ Its firm inclination remains intact, yet price distance signals risk of gravitational return should upper momentum fracture.
✴️ Conclusion: EMA50 preserves bullish foundation, but may become a zone of rebalancing if the rally loses vitality.
⊢
▦ BB (21) - (Bollinger Bands + SMA21) - ($117,764.35):
∴ The Bands, ever sensitive to volatility’s breath, expand wide - a sign of elevated tension and price exploration;
∴ Price nears the upper band ($121,401.48), a common altar for speculative saturation and potential rejections;
∴ The median band (SMA) acts as equilibrium, now beneath the price - suggesting deviation from balance.
✴️ Conclusion: BB21 signals a volatile climax zone; price at the upper band often faces a verdict - continuation by force, or descent by default.
⊢
▦ Volume + MA21 - (Last - 148 vs Average - 363):
∴ Volume flows now with diminished voice - the current bar echoes only 148 units against a historical pulse of 363;
∴ Such silence beneath a rising price may betray a hollow rally - or a pause before engagement;
∴ Absence of participation often precedes reversal or sudden liquidity spikes.
✴️ Conclusion: Subdued volume undermines the bullish signal - lack of validation breeds caution in forward projection.
⊢
▦ RSI - (Relative Strength Index 21) - (61.41):
∴ RSI remains in neutral-high territory, not overbought, but clearly tilted toward bullish control;
∴ Momentum persists but shows signs of plateau - recent movement flattens after steady ascent;
∴ Without new strength, RSI may drift toward the median.
✴️ Conclusion: RSI shows bullish favor, but the fire beneath the trend cools; next candles will determine if it's pause or fade.
⊢
▦ MACD - (9, 21) - (Histogram: –455.70):
∴ MACD line at 2,078.82 vs Signal line at 1,623.12 suggests bullish dominance in structure;
∴ Yet the negative histogram tells a story of fading acceleration - as if the charge slows though direction holds;
∴ This divergence signals decay beneath strength, an omen of indecision.
✴️ Conclusion: MACD is structurally bullish, but its weakening impulse demands attention - the momentum candle dims.
⊢
▦ StochRSI - (3, 3, 21, 9) - (%K: 20.46 / %D: 23.93):
∴ The indicator rests near the lower bounds (sub-25) - a territory of emotional exhaustion and tactical reversion;
∴ A cross upward from these levels often ignites short-term rally pulses;
∴ No confirmed crossover yet - but proximity speaks of potential awakening.
✴️ Conclusion: StochRSI breathes in the lowlands, poised to reverse if kinetic force is summoned.
⊢
▦ OBV - (On Balance Volume) - (102.17M):
∴ The OBV remains elevated, suggesting previous bullish runs were volume-supported, not hollow;
∴ However, flatness in recent OBV progression warns that fresh volume is not accompanying the current price hold;
∴ It whispers of consolidation, or worse - divergence.
✴️ Conclusion: OBV confirms the history of strength, but offers no new blood to feed the advance.
⊢
🜎 Strategic Insight - Technical Oracle:
∴ The battlefield holds its shape - the banners of bullish trend still wave, upheld by structural support from EMA's and historical OBV flow. But the wind... it stills.
∴ Volume fades, momentum indicators lose their incline, and oscillators rest on edges. This is a moment of price levitation - elevated without lift. The form remains, but the force hesitates.
∴ The Arcane Pattern whispers:
Should volume return and MACD reignite, $121K may be pierced with clarity;
If silence deepens, however, the bands will contract, and price may descend toward EMA21 or even test EMA50.
∴ The Vortex of Pause has formed. From here, either ignition... or gravity.
⊢
𓂀 Stoic-Structural Interpretation:
▦ Structurally Bullish - Strategically Cautious:
∴ Price remains securely above all major (EMA's 9/21/50) on the daily chart, preserving directional integrity;
∴ Bollinger Bands expanded near upper thresholds, signaling climax zone - yet not rupture;
∴ Momentum indicators (MACD, RSI) maintain bullish structure, but histogram weakness and RSI flattening warn of interior softening;
∴ Stoch RSI in low-band suggests reversal potential, but has yet to trigger.
✴️ Conclusion: Market structure supports continuation, but momentum exhaustion and low volume raise caution flags. Bulls hold the field - but must call the wind.
⊢
▦ Tactical Range Outlook:
∴ Upper Limit: $122,054 - Fibonacci 1.0 and previous cycle top;
∴ Short-Term Support: $118,352 - EMA9 + 0.618 Fib confluence;
∴ Median Guard: $116,729 - EMA21 + 0.382 Fib;
∴ Sacred Support: $112,511 - EMA50 base + structural floor;
∴ Final Bastion: $103,971 - 0.236 Fib retrace (macro turn pivot).
✴️ Conclusion: Bullish path remains sealed while price resides above EMA50 and above $103K. Breach of that zone could awaken deeper volatility structures.
⊢
◩ Codicillus Silentii - Strategic Note:
∴ Price stands at the edge of Fibonacci climax, just below the mythic $122K - a known threshold of reaction;
∴ Volume whispers, not commands - the force of momentum now rests on belief, not confirmation;
∴ The convergence of structure without influx invites caution. This is the realm not of action, but of observation.
✴️ Final Seal: Beware the illusion of calm. A structure may stand in silence, but silence precedes collapse as often as continuation. The Sacred Frame is intact - but shall remain sacred only through vigilance.
⊢
⧉
· Cryptorvm Dominvs · MAGISTER ARCANVM · Vox Primordialis ·
⚜️ ⌬ - Silence precedes the next force. Structure is sacred - ⌬ ⚜️
⧉
⊢
Bitcoin Between Strength and Suspension Tactical Inflow Anomaly.⊣
⟁ BTC/USD – BINANCE - (CHART: 1H) – (Jul 03, 2025).
◇ Analysis Price: $109,716.55.
⊣
⨀ I. Temporal Axis – Strategic Interval – (1H):
▦ EMA 9 – ($109,510.76):
∴ Price remains above EMA9, sustaining the short-term bullish impulse;
∴ The EMA 9 is ascending with consistent candle-body support across recent sessions.
✴ Conclusion: Tactical momentum persists as long as price holds above EMA9 on closing basis.
⊢
▦ EMA 21 – ($109,064.37):
∴ EMA 21 serves as dynamic support, unbroken since the July 2nd surge;
∴ Distance between EMA9 and EMA21 confirms preserved trend integrity.
✴ Conclusion: No structural weakness observed; trend foundation remains intact under current volatility.
⊢
▦ Volume – (Visual estimation, TradingView):
∴ Volume surged during July 2 rally; subsequent bars show diminishing interest;
∴ Last high-volume candle aligns with recent local top attempt.
✴ Conclusion: Buyer aggression is fading. Volume must return for any continuation to be credible.
⊢
▦ Bollinger Bands (20, 2.0) – (Upper: $110,050.15 / Lower: $108,545.25):
∴ Price recently tapped upper band and pulled back slightly without breakdown;
∴ Bands are widening after expansion, indicating active volatility but no climax.
✴ Conclusion: System operates in elevated volatility regime, with breakout potential still valid if supported.
⊢
▦ Price Action (66, 6, 5) – (Visual structure, local range):
∴ Price formed a clean higher low and higher high sequence starting July 2nd, confirming bullish microstructure;
∴ Current candles show upper wick formation at ~$110,050, indicating rejection and absorption at resistance.
✴ Conclusion: Uptrend structure is valid but approaching short-term exhaustion. If support holds at $109,100–108,900, continuation remains viable.
⊢
▦ RSI + EMA9 – (RSI: 62.69 / EMA: 63.27):
∴ RSI dipped below its own EMA9, indicating weakening strength in recent hours;
∴ RSI remains above 60, preserving bullish territory but signaling caution.
✴ Conclusion: Early-stage exhaustion detected. Zone of hesitation active.
⊢
▦ ATR (14, RMA) – (447.69):
∴ Average volatility is still elevated relative to June baseline;
∴ Slight decline in ATR may suggest slowing force behind directional moves.
✴ Conclusion: Tactical volatility is active but not expanding. Suitable for traps or distribution setups.
⊢
🜎 Strategic Insight – Technical Oracle:
∴ The structural setup holds a bullish bias with dynamic supports (EMA9/EMA21) intact;
∴ Bollinger expansion and RSI positioning signal a zone of heightened interest, but the fading volume and early RSI crossover inject caution;
∴ This is a tactically suspended state where continuation is possible but dependent on incoming confirmation volume.
⊢
⟁ II. ARCANVM SIGNAL - (Bitcoin Inflow +5,000):
∴ Current Hourly Inflow: 20,788.10 BTC;
∴ Structural Threshold (30EMA): ~3,200 BTC;
∴ Trigger Threshold: ≥ 5,000 BTC.
✴ Conclusion and Interpretation: This event constitutes a critical liquidity anomaly under the Silent Sentinel Protocol. While it does not inherently dictate trend direction, its magnitude-6.5x above the structural average-configures:
∴ A probable institutional move for redistribution or liquidity unlocking;
∴ Elevated risk for short-term distortion events, particularly across the H1–H4 timeframes;
∴ An urgent need to monitor subsequent Netflow, to confirm whether real outflow pressure follows.
⊢
∫ III. On-Chain Intelligence – (Source: CryptoQuant):
▦ Exchange Netflow Total - (All Exchanges):
∴ Current: +555 Bitcoin net inflow;
∴ The ARCANVM inflow (+20,788 Bitcoin) has not been fully absorbed or reversed.
✴ Conclusion: Some liquidity remains inside exchanges. Potential for redistribution or silent preparation.
⊢
▦ Exchange Reserve - (All Exchanges):
∴ Continuously declining; current: ~2.44M Bitcoin;
∴ The inflow did not shift the macro trend of reserve depletion.
✴ Conclusion: Structural scarcity preserved. Inflow likely tactical and non-systemic.
⊢
▦ Futures Perpetual Funding Rate 7D-SMA - (All Exchanges):
∴ Holding near 0.01% – neutral bias;
∴ No evidence of directional crowding in perpetuals.
✴ Conclusion: Perpetual markets in tactical balance. Spot-driven price action dominates.
⊢
🜎 Strategic Insight – On-Chain Oracle:
∴ Despite the aggressive ARCANVM signal, the absence of structural reversals in reserves and neutral derivatives positioning confirms the move is non-structural.
∴ Markets remain in equilibrium.
∴ No emergent directional force-just silent posture-shifting.
⊢
⧈ Codicillus Silentii – Strategic Note:
∴ This is a state of tactical ambiguity. Breakout or failure depends on external triggers, as neither volume nor derivatives offer decisive guidance.
∴ The structure listens, not speaks.
⊢
▦ Tactical Range Caution:
∴ Resistance Watch Level: $110,050;
∴ Tactical Support: $109,100;
∴ Structural Alert Level: $108,400.
⊢
𓂀 Stoic-Structural Interpretation:
∴ Structurally Bullish – Tactically Suspended;
⊢
⧉
⚜️ Magister Arcanvm – Vox Primordialis!
𓂀 Wisdom begins in silence. Precision unfolds in strategy.
⧉
⊢

Bitcoin H1 Reversal – Codex Arcanvm + Tactical Breakdown.⊢
⟁ BTC/USD – BINANCE – (CHART: 1H) – (Date: Jun 30, 2025).
◇ Analysis Price: $107,599.99.
⊢
⨀ I. Temporal Axis – Strategic Interval – (1H):
▦ EMA 9 – ($107,799.64):
∴ The 9-period EMA remains above the current price, signaling downward rejection from short-term momentum line;
∴ It recently crossed below the EMA21, reinforcing a weakening of bullish impulse.
✴ Conclusion: EMA9 now acts as intraday resistance, confirming that immediate market strength has decayed and volatility expansion may continue unless reclaimed.
⊢
▦ EMA 21 – ($107,861.93):
∴ EMA21 is sharply curved downward, validating loss of directional conviction from the previous bullish run;
∴ This level aligns with a former consolidation zone, now potentially serving as a resistance pivot.
✴ Conclusion: EMA21 confirms a short-term trend break, and the inability to reclaim this line would prolong corrective action.
⊢
▦ EMA 50 – ($107,703.87):
∴ The EMA50 was breached decisively in the previous candle cluster, now positioned above price;
∴ Slope is turning neutral-to-down, reflecting a transition from trend to turbulence.
✴ Conclusion: EMA50 shift implies structural vulnerability in the intermediate frame, amplifying bearish tactical weight if no recovery emerges swiftly.
⊢
▦ SMA 100 – ($107,007.08):
∴ SMA100 is currently positioned just below price, offering momentary support in case of further weakness;
∴ Horizontal alignment indicates a pause or inflection zone, lacking directional strength.
✴ Conclusion: SMA100 is a neutral-bullish support shelf, but could flip to active resistance if breached intraday.
⊢
▦ SMA 200 – ($105,890.26):
∴ The SMA200 remains firmly upward-sloping and untouched — a sign of medium-trend resilience.
∴ It defines the lower structural boundary for this time-frame.
✴ Conclusion: SMA200 still holds bullish structural integrity, but if reached, it would represent a full reversion of recent strength.
⊢
▦ Volume + EMA 21 – (Current Vol: 5.31 BTC):
∴ Volume shows an uptick during bearish candle clusters — indicative of active sell-side participation;
∴ The EMA21 on volume reveals a rising slope, confirming that volatility is not passive, but driven by conviction.
✴ Conclusion: Volume action supports the thesis of deliberate distribution, not merely rotational choppiness.
⊢
▦ VWAP (Session) – ($107,995.35):
∴ Price has broken decisively below VWAP, showing institutional disengagement or absence of bid reinforcement;
∴ VWAP now serves as magnetic resistance during any mean-reversion attempts.
✴ Conclusion: VWAP position confirms that price is under fair-value, and current path is dominated by tactical sellers.
⊢
▦ Bollinger Bands – (Lower Band: $107,007.08):
∴ Bands have widened, with price hugging the lower edge - a hallmark of volatility expansion;
∴ Mean price ($107,895.00) sits significantly above spot, reinforcing downside pressure.
✴ Conclusion: BB's suggest momentum breakdown, with price entering statistically stretched, yet uncorrected territory.
⊢
▦ RSI + EMA 9 – (RSI: 87.06 | EMA: 92.92):
∴ RSI has sharply fallen from extreme overbought, but remains above the 70-level — reflecting ongoing exit from euphoric levels;
∴ The EMA over RSI is crossing below, signaling loss of short-term strength and potential trend reversal.
✴ Conclusion: RSI behavior implies a momentum peak has passed, though correction may still be in early phase.
⊢
▦ MACD – (MACD: 1.87 | Signal: -99.46 | Histogram: 101.33):
∴ MACD histogram turned sharply positive following a steep drop, suggesting a potential pause in bearish acceleration;
∴ Lines are converging but remain well below the zero axis - no bullish crossover yet.
✴ Conclusion: MACD reflects oversold relief, but not reversal. Current state favors tactical caution rather than confidence.
⊢
▦ ATR (14, RMA) – (315.31):
∴ ATR remains elevated, confirming ongoing high volatility and larger-than-average candle bodies;
∴ This level sustains a risk zone scenario, where price swings may be unpredictable.
✴ Conclusion: ATR indicates volatility expansion persists, further validating the need for defensive tactical posture.
⊢
🜎 Strategic Insight – Technical Oracle:
∴ The technical constellation on the 1H chart reveals a clear breakdown of short-term bullish structure, now transitioning into a tactically bearish phase;
∴ The rejection from VWAP and convergence of all EMA's above price confirm that any recovery must reclaim the 107.800–108.000 cluster to negate downside bias;
∴ The current support rests on SMA100, yet its flat orientation and proximity to price suggest fragility, not strength. Meanwhile, SMA200 at 105.890 represents a more significant structural floor - its breach would mark a deeper tactical deterioration;
∴ Volatility metrics (BB and ATR) indicate that the market is no longer coiled - it has entered expansion, and directional bias is momentarily controlled by sellers. RSI exiting overbought and MACD’s unresolved negative zone further support the thesis of ongoing correction, not mere pause;
✴ Conclusion: In essence, the market has shifted into a correctional pulse, guided by structural breakdowns and expanding volatility. Tactical recoveries remain possible, but fragile and likely limited unless EMA's are reclaimed with force.
⊢
∫ II. On-Chain Intelligence – (Source: CryptoQuant):
▦ Exchange Netflow Total – (All Exchanges) – (Last Recorded: +2.1K BTC):
∴ Recent spike in netflow reveals a sudden influx of Bitcoin into centralized exchanges, marking the first positive divergence after a long series of outflows;
∴ Such inflows historically precede tactical distribution events or profit-taking phases, especially following extended rallies.
✴ Conclusion: Netflow confirms that holders are actively preparing to sell, giving real on-chain weight to the price rejection seen on the 1H chart.
⊢
▦ Short-Term Holder SOPR – (Latest Value: 1.012):
∴ SOPR sits slightly above 1.0, but descending - indicating a transition from profit realization to potential break-even or loss selling;
∴ If the trend continues and dips below 1.0, it marks capitulation from recent buyers — often a trigger for volatility spikes or local bottoms.
✴ Conclusion: Current STH SOPR signals weakening conviction among short-term holders, supporting a corrective narrative rather than trend continuation.
⊢
🜎 Strategic Insight – On-Chain Oracle:
∴ The on-chain substrate aligns precisely with the tactical weakness shown in the chart. The positive exchange netflow acts as a material indicator of sell-side readiness;
∴ This inflow, breaking the historical trend of outflows, marks a shift in intent - from holding to liquidation;
∴ Simultaneously, the Short-Term Holder SOPR sits on a critical edge. Its descent toward the 1.0 threshold implies that recent buyers are either approaching breakeven or beginning to capitulate;
∴ This fragile posture typically amplifies local corrections, especially when coupled with rising volatility;
∴ On-chain momentum no longer supports bullish continuation. Instead, it reflects hesitation, rotation, and distribution - all hallmarks of a short-term correction phase, in alignment with the temporal analysis;
✴ Conclusion: The on-chain field confirms that the technical breakdown is not speculative - it is supported by active internal dynamics, signaling a pause or reversal in trend strength at a structural level.
⊢
⧈ Codicillus Silentii – Strategic Note:
∴ The current H1 formation is a textbook example of post-euphoric fragility. What appeared as steady accumulation has now transitioned into a volatile de-leveraging phase. The confluence of bearish momentum, increased volume, and netflow reversal suggests the market is entering a tactical contraction zone;
∴ No structural collapse is yet confirmed - but the absence of bullish defense at VWAP and EMA clusters denotes reduced resilience. Until these are reclaimed, all attempts at recovery must be viewed with caution.
✴ Conclusion: Silence in structure signals preparation - not passivity. The next move shall emerge not from noise, but from the void left by exhaustion.
⊢
𓂀 Stoic-Structural Interpretation:
∴ Structurally Bearish – Tactically Suspended ;
∴ The 1H chart shows a break below short-term momentum zones (EMA's, VWAP), confirming structural fragility;
∴ Despite momentary support on SMA100, the loss of upward slope across the EMA's and RSI reversal validate a structural bearish bias;
✴ Conclusion: Tactical direction remains suspended until one of two pivots is breached: either VWAP (~107.995) reclaimed, or SMA200 (~105.890) broken.
⊢
⧉
⚜️ Magister Arcanvm – Vox Primordialis!
𓂀 Wisdom begins in silence. Precision unfolds in strategy.
⧉
⊢

Bitcoin Strategic Risk Framework & Market Structure Assessment.⊢
⟁ BTC/USD – BINANCE – (CHART: 1D) – (Jun 25, 2025).
⟐ Analysis Price: $107,191.94.
⊢
⨀ I. Temporal Axis – Strategic Interval – (1D):
▦ EMA21 – ($105,207.93):
∴ Price has reclaimed EMA21 decisively after testing below;
∴ EMA21 maintains upward slope, indicating reactivation of short-term bullish sentiment;
∴ Dynamic support now resides at ~$105.2K.
✴️ Conclusion: EMA structure favors bullish continuation while price holds above.
⊢
▦ SMA200 – ($96,064.16):
∴ SMA200 remains strongly upward sloped, untouched since March 2024;
∴ Long-term momentum remains firmly bullish;
∴ No contact with SMA200 confirms macro support far below.
✴️ Conclusion: Structural support intact; macro uptrend fully confirmed.
⊢
▦ Ichimoku Cloud – ($103,065.53 / $104,456.43):
∴ Price positioned above Kumo; bullish structure remains intact;
∴ Kijun-sen ($104,456.43) and Tenkan-sen ($103,065.53) both flat, signaling short-term consolidation;
∴ Chikou Span approaches historical resistance zone; Span A and B flattening.
✴️ Conclusion: Bullish trend preserved, but lacking forward thrust; potential stagnation if breakout fails.
⊢
▦ Volume (MA21) – (~129 BTC):
∴ Current volume ~128.73 BTC, slightly under the moving average;
∴ No breakout volume confirmation despite recent price thrust;
∴ Weak volume expansion reduces reliability of short-term breakout.
✴️ Conclusion: Momentum requires validation through volume escalation.
⊢
▦ MACD – (-4.44 / 36.48 / -40.92):
∴ Histogram contracting upward, bearish momentum fading;
∴ MACD Line (-4.44) still below Signal Line (36.48);
∴ No confirmed bullish crossover, but compression phase active.
✴️ Conclusion: Latent bullish reversal potential; not yet validated.
⊢
▦ RSI – (55.95):
∴ RSI reclaimed level above 50, positioning in neutral-bullish zone;
∴ RSI MA at 48.78 confirms momentum shift;
∴ Positive slope suggests rising momentum, but lacks steepness.
✴️ Conclusion: Momentum entering constructive zone, still not impulsive.
⊢
🜎 Strategic Insight – Technical Oracle:
∴ Structure remains technically bullish with constrained momentum;
∴ Indicators are aligned toward continuation, yet breakout conviction is hindered by insufficient volume and pending oscillator confirmation;
∴ Short-term path is upward-biased, conditional on validation.
⊢
∫ II. On-Chain Intelligence – (Source: CryptoQuant):
▦ Exchange Netflow – (All Exchanges):
∴ Netflow remains negative on 7-day average;
∴ Sustained outflows indicate strategic accumulation or self-custody preference;
∴ No evidence of large-scale exchange inflows that signal distribution.
✴️ Conclusion: Net capital migration continues favoring off-exchange security; bullish underlying tone.
⊢
▦ Stablecoin Supply Ratio (SSR):
∴ SSR near 17.5 indicates relatively low stablecoin dominance;
∴ Reduced buying power vs Bitcoin implies cooling short-term demand;
∴ Historically elevated SSR levels precede price consolidations or local tops.
✴️ Conclusion: Stablecoin reserves insufficient for sustained upward pressure; caution warranted.
⊢
▦ Exchange Whale Ratio – (All Exchanges):
∴ Whale Ratio near 0.59 denotes moderate large-holder activity;
∴ Ratio not in critical zone (>0.7), yet above accumulation range (<0.4);
∴ Potential soft distribution behavior if ratio trends upward.
✴️ Conclusion: Mixed signal - no panic, but latent whale presence requires monitoring.
⊢
▦ Miner Reserve:
∴ Miner balances steadily declining over past 30 days;
∴ Consistent outflows suggest controlled selling behavior;
∴ No aggressive miner dumping detected.
✴️ Conclusion: Miner pressure exists but remains tactical and non-destructive.
⊢
▦ Long-Term Holder SOPR (LTH-SOPR):
∴ Metric above 1.0 indicates long-term holders are in profit and realizing gains;
∴ No sharp spike detected, suggesting rational distribution;
∴ Structure consistent with healthy bull cycle mechanics.
✴️ Conclusion: Profit-taking underway in equilibrium; not a signal of panic.
⊢
▦ Funding Rate – (Futures):
∴ Funding mildly positive (~0.002–0.004%), reflecting long positioning bias;
∴ Rates remain low, indicating lack of overcrowded trades;
∴ No sign of speculative overheating in derivatives.
✴️ Conclusion: Derivatives sentiment is constructive, not euphoric; room for further upside exists.
⊢
🜎 Strategic Insight – On-Chain Oracle:
∴ On-chain metrics reflect a stable yet cautious accumulation phase;
∴ Absence of sell pressure, tempered long-term holder realization, and moderate derivative sentiment suggest foundation for continuation, albeit with reduced immediate force;
∴ Confirmation must align with price and volume.
⊢
⧉ III. Contextvs Macro–Geopoliticvs – Interflux Economicvs:
▦ Geopolitical Axis – Middle East Ceasefire:
∴ Ceasefire between Israel and Iran eased global tension, triggering flight from commodities into risk assets;
∴ Brent crude declined over -2.5% following truce reports, reducing inflationary pressure;
∴ However, geopolitical fragility remains - peace is provisional, not structural;
✴️ Conclusion: Tactical relief observed; no systemic safety guaranteed.
⊢
▦ Monetary Policy – US Federal Reserve Outlook:
∴ Jerome Powell signals continued rate hold, citing sticky inflation and fragile global equilibrium;
∴ Futures markets price ~20% chance of July cut, ~60% for September;
∴ Bond yields retreating (2Y at ~3.78%), suggesting easing expectations embedded;
✴️ Conclusion: Macro liquidity conditions marginally favorable to crypto; policy risk remains asymmetric.
⊢
▦ Equities & Global Sentiment – Dow Jones / Nasdaq Futures:
∴ Dow Futures flat (~+0.02%), Nasdaq Futures rise on tech optimism;
∴ Equity markets supported by decline in oil, stabilization in rates, and AI-sector inflows;
∴ No VIX spike – volatility subdued;
✴️ Conclusion: Macro-risk appetite firming up, enhancing crypto’s speculative appeal.
⊢
▦ Derivatives Behavior & Institutional Flow:
∴ Option markets show accumulation of BTC calls at 108K–112K strike zones;
∴ Futures funding positive but low, consistent with healthy long-side conviction;
∴ No structural imbalance detected;
✴️ Conclusion: Derivatives support scenario of moderate bullishness without speculative overreach.
⊢
⌘ Codicillus Silentii – Strategic Note:
∴ Temporal architecture remains bullishly aligned, but lacks velocity – movement is present without ignition;
∴ On-chain metrics reveal quiet distribution among long-term holders, yet without aggressive miner displacement or exchange flooding;
∴ Market tension is suspended in a state of equilibrium – neither contraction nor breakout assert dominion;
∴ The asymmetry of opportunity lies dormant, awaiting conviction in participation and volume.
⊢
𓂀 Stoic-Structural Interpretation:
▦ Structurally Bullish – Tactically Suspended:
∴ Price structure above EMA21 and SMA200 confirms preservation of macro uptrend – foundation remains unbroken;
∴ Miner reserve reduction and stable LTH-SOPR suggest controlled realization, not structural weakness;
∴ However, Ichimoku flattening and low volume expansion indicate stalling momentum, lacking breakout substance.
⊢
▦ Tactical Range Caution:
∴ Whale Ratio mid-levels and SSR elevation highlight proximity to potential resistance exhaustion;
∴ MACD crossover remains unconfirmed; RSI enters constructive zone without strength – reactionary rather than initiative-based;
∴ Until volume and oscillator confirmation emerge above $108.2K, posture remains protective and selective.
⊢
⧉
⚜️ Magister Arcanvm (𝟙⟠) – Vox Primordialis!
𓂀 Wisdom begins in silence. Precision unfolds in strategy.
⧉
⊢

Bitcoin - The Elevated Cycle and the Silence Before Powell.⊢
⟁ BTC/USD – Bitstamp – (CHART: 1M) – (June 18, 2025).
⟐ Analysis Price: $104,044.00
⊢
⨀ I. Temporal Axis – Strategic Interval – (1M):
▦ EMA90 – ($39,909.00):
∴ Rising steadily, serving as long-cycle structural support since 2020;
∴ Price remains well above this average, with no signs of downward pressure;
∴ The positive slope confirms ongoing bullish macro structure.
✴️ Conclusion: EMA90 holds the foundational base of the long-term uptrend with ample buffer.
⊢
▦ SMA50 – ($48,924.00):
∴ Key axis of mid-to-long-term structure, validated by multiple touches during 2022–2023;
∴ Current price distance suggests technical room for retracement;
∴ Still rising with no sign of flattening or decay.
✴️ Conclusion: SMA50 confirms trend integrity, though overextension calls for caution.
⊢
▦ Ichimoku (Kumo & Lines) – (85,434 | 68,378 | 104,044 | 76,906 | 63,740):
∴ Price remains well above the Kumo cloud – full bullish confirmation;
∴ Tenkan and Kijun are aligned in bullish configuration, widely spread;
∴ Future cloud projects bullish momentum continuation.
✴️ Conclusion: Complete Ichimoku structure signals dominant cycle strength.
⊢
▦ MACD (12,26,9) – (2,344 | 16,426 | 14,083):
∴ MACD line remains above the signal, maintaining a monthly buy signal;
∴ Histogram shows mild expansion, but slower than previous bull cycles;
∴ Momentum is positive but decelerating.
✴️ Conclusion: Momentum remains intact, but peak cycle force may have passed.
⊢
▦ RSI (14) – (68.82 | MA: 67.35):
∴ RSI approaching overbought threshold, hovering near 70;
∴ Momentum is firm but shows resistance to further extension;
∴ Historical comparison to 2020 suggests possible ignition or exhaustion point.
✴️ Conclusion: RSI signals potential tension zone - breakout or reversal ahead.
⊢
▦ VPT (14,8) – (100):
∴ Volume Price Trend has plateaued at its max threshold;
∴ Lack of new highs despite price advance suggests fading directional volume;
∴ Often a signal of accumulation slowdown or redistribution.
✴️ Conclusion: Buyer strength may be waning beneath the surface.
⊢
🜎 Strategic Insight - Technical Oracle:
∴ Market structure remains bullish across all core indicators;
∴ Overextension from key moving averages and flattening momentum call for tactical caution;
∴ Any macroeconomic pressure could trigger a local top, without compromising the broader trend.
⊢
∫ II. On-Chain Intelligence – (Source: CryptoQuant):
▦ Realized Price & LTH – ($47,000):
∴ Market price is well above the realized price baseline;
∴ Indicates majority of holders are in profit — structurally bullish;
∴ However, this also creates a risk of profit-taking if confidence drops.
✴️ Conclusion: Strong support floor, but latent pressure exists.
⊢
▦ SOPR - (Spent Output Profit Ratio) – (1.013):
∴ Above 1 means active profit-taking;
∴ Downward slope shows this is starting to cool;
∴ Critical to monitor for a break below 1 - would shift dynamic.
✴️ Conclusion: Still healthy, but at the edge of distribution risk.
⊢
▦ NUPL – (Net Unrealized Profit/Loss) - (0.554):
∴ Unrealized profit remains dominant;
∴ Readings above 0.5 historically precede consolidation or pullbacks;
∴ Still distant from euphoric tops, but entering alert zone.
✴️ Conclusion: Market still in profit expansion phase - but under surveillance.
⊢
▦ MVRV - (STH vs LTH) – (STH: 1.0 | LTH: 3.1 | Global: 2.2):
∴ STH neutral, LTH moderately elevated but not excessive;
∴ Market is mature, but not overheated;
∴ Still in a zone that supports further upside with restraint.
✴️ Conclusion: Healthy balance between holders - no imminent top confirmed.
⊢
▦ CME Futures Open Interest:
∴ Sharp rise in open interest across expiry horizons;
∴ Sign of speculative leverage building;
∴ Historically correlates with volatile price action post-FOMC or macro events.
✴️ Conclusion: Liquidity pressure is rising - extreme caution warranted.
⊢
🜎 Strategic Insight - On-Chain Oracle:
∴ On-chain structure mirrors technical signals - strong trend, but cautious undertone;
∴ No major signs of reversal, but profit saturation could act as gravity if macro shocks occur;
∴ Market is exposed, not exhausted.
⊢
⧉ III. Contextvs Macro–Geopoliticvs – Interflux Economicus:
▦ Fed Chair Powell (Upcoming):
∴ Powell speaks today (June 18); core expectation is rate hold;
∴ Market bracing for hawkish tone: fewer projected cuts and emphasis on inflation resilience;
∴ Historically, Bitcoin has reacted with -2% to -5% dips to hawkish FOMC tone.
✴️ Conclusion: Macro tension peak. Powell’s tone may dictate the next 30-day candle.
⊢
⚜️ 𝟙⟠ Magister Arcanvm – Vox Primordialis!
⚖️ Wisdom begins in silence. Precision unfolds in strategy.
⊢
⊢
⌘ Codicillus Silentii – Strategic Note:
∴ The technicals are strong, the on-chain base is stable, and the macro setup is explosive;
∴ This is a tension point, not a resolution point - silence before decision;
∴ Precision now is not found in action, but in observation.
⊢
⌘ Market Status:
✴️ Position: " Cautiously Bullish. "
✴️ Tactical Mode: Observation Priority – No immediate entry without Powell clarity.
⊢

BTCUSDT TRADING POINT UPDATE >READ THE CHAPTIAN Buddy'S dear friend 👋
SMC Trading Signals Update 🗾🗺️ crypto Traders SMC-Trading Point update you on New technical analysis setup for crypto BTC USDT crypto currency 💲 crypto Traders BTC
USD ready for. A New. ATH that month Technical patterns support and Resistance level 🎚️ Look good bullish trend 📈 114k don't dare qt Hit but soon 🔜😁
Key Resistance level 106k + 107k + 109k + 114k
Key Support level 97222 - 94219 - 92105 - 89219
Mr SMC Trading point
Pales support boost 🚀 analysis follow)

BTCUSD TRADING POINT UPDATE > READ THE CHAPTIAN Buddy'S dear friend 👋
SMC Trading Signals Update 🗾🗺️ crypto Traders SMC-Trading Point update you on New technical analysis setup list time post signals 💯 reached target 🎯 point now post NEW analysis setup BTC USD. Tast diamond zone orderblok take. Bullish trend 📈 🚀 patterns 109k target 🎯 point ☝️
Key resistance level 101k) 105k)107k) 109k)
Key support level 98k) 97k)
Mr SMC Trading point
Support 💫 My hard analysis setup like And Following 🤝 me that star ✨ game 🎮

BTCUSD TRADING POINT UPDATE > READ THE CHAPTAINBuddy'S dear friend 👋
SMC Trading Signals Update 🗺🗾 Cryptocurrency Traders SMC-Trading Point update you on BTC USD Trading Signals BTC USD still holding it down trand 107k 3 Time rejected oderbolk ) 105k) rejected again Short Trade now 3H Time Frame 🖼️ target point 99k)
Key resistance level 107k) 109k)
Kye support level 102k) 101k ) 99k)
Mr SMC Trading point
Support💫 My hard analysis Setup like and following me 🤝 that star ✨ game 🎮

BTC Bull above $44.000Here is my count on low TF.
Above 44k => Bull
if it stays under 44k we will visit under 40k
btw: i don't believe in halving and ETF etc ... :D
Check my main count for BTCUSD

Bitcoin trading planBitcoin corrected from the highs by about 15%, you and I have been tracking all this movement, with constant monitoring of trades, and we managed to make good profit on it.
At the moment the price is consolidating in a narrow range with the upper boundary where sales appear at 27600, and buy back the price at the lower boundary around 26500-26700, from this zone there are possible exits up and down. Trading inside this range will not bring any profit, and one has to wait for the exit of the price from this range, till this time buying or selling will be just a guessing attempt. Therefore, I will monitor the breakout or false-breakout and the appearance of volume for the entry set-up and try to make updates of this idea.
Of the important events that may influence the price is the release of US macrostatistics data - Tuesday 23.05 - PMI, 25.05 - GDP data.
Support the author subscribe ✅ and start rocket 🚀.
Good luck and profits to all.

Bitcoin Bottom SoonFrom the start, I thought 27k was unlikely to be a real bottom. And with real bottom I mean the bottom that would kickstart a new uptrend that would take Bitcoin back to 30k.
So knowing that Bitcoin takes roughly 65 days to complete a daily cycle, the bottom of April 23 was not the real bottom. However, I believe that the next one is near. I expect it will happen around mid of May.
Now at what prices can we expect that bottom? I think the worst case would be 25k. Because we're so close to the new bottom, timing the market at this point seems unwise. Especially if you do not have any Bitcoin yet.

BTC to see a slight uptrend(4Hr)! | Bollinger Band squeezes Market in last 24hrs
-BTCUSD saw a sideways movement
-Price volatility was relatively low. The market moved ~2.17%, between $11.85\\94k and $11.69k
Today’s Trend analysis
-BTCUSD expected to see a slight uptrend as Bollinger band squeezes and price trading above the midline band
-Price at time of publishing: $11,887
-BTC’s market cap: $218 Billion
-Oscillator indicators are mostly neutral. RSI at 56
-Moving average indicators are biased towards an uptrend. Ichimoku Cloud is neutral
-Volume indicators observed were very low somewhat around the same value
Price expected to see a slight uptrend as Bollinger band squeezes and price trading above the midline band. Most of the Oscillator indicators are neutral. MACD crossed below the signal line with histogram increasing in size in a negative direction. RSI at 56, above the midline still in the neutral region. CCI at 60, in the neutral region. Another interesting point to notice here is that the volume has been very low in recent candles.
----------------------------------------------------------------------------------------
The analysis is based on signals from 28 technical indicators, out of which 17 are moving averages and the remaining 11 are oscillators. These indicator values are calculated using 1 D candles.
DM to get details of the above analysis and list of indicator & their values used to arrive at the above conclusion.
Note: Above analysis would hold true if we do not encounter sudden jump in trade volume .
----------------------------------------------------------------------------------------
If you find the analysis useful, please like and share our ideas with the community!
- Mudrex

BTCUSD expected to see an uptrend! | Bollinger Band squeezes Market in last 24hrs
-BTCUSD moved sideways below the midline Bollinger Band
-Price volatility was high. The market moved ~4%, between $11.44k and $11k
Today’s Trend analysis
-BTCUSD expected to see an uptrend as after squeezing of Bollinger Band it is followed by expansion and breakout
-Price at time of publishing: $11,404
-BTC’s market cap: $210 Billion
-Oscillator indicators are mostly neutral. RSI at 56
-Moving average indicators are biased towards an uptrend. Ichimoku Cloud is neutral
-Volume indicators observed a constant volume in the recent candles.
Price expected to see a sideways movement as price got rejected from midline Bollinger Band. Most of the Oscillator indicators are neutral. MACD histogram is negative, size decreasing in the negative region about to cross up zero indicating an uptrend. RSI at 56, above the midline with an upmove indicating an uptrend. CCI at 151, in the overbought region increasing upwards. Another interesting point to notice here is that from last few candles Bollinger Band has started to squeeze.
----------------------------------------------------------------------------------------
The analysis is based on signals from 28 technical indicators, out of which 17 are moving averages and remaining 11 are oscillators. These indicator values are calculated using 4 hr candles.
DM to get details of the above analysis and list of indicator & their values used to arrive at the above conclusion.
Note: Above analysis would hold true if we do not encounter sudden jump in trade volume .
----------------------------------------------------------------------------------------
If you find the analysis useful, please like and share our ideas with the community!
- Mudrex

BTCUSD (bitcoin) congratulations on previous sellwe wait for a short sell as pattern shows a sell pattern
see old analysis tagged below

BTCUSD at Level 5 of Livermore Accumulation Cylinder: Send it!"When price and volume move alike - up up or down down - the market is bound to post higher price levels... The rationale for this is obvious: an INCREMENT in price should rarefy the buying power... But it does not: hence higher prices. a DECLINE in price, on the other side, should stimulate the SELLING PRESSURE... But it does not: hence higher prices." -- Jesse Livermore
See Livermore's Speculative Chart: i1.wp.com

