Continue waiting for a reboundFor BTC, stick to buying low as we suggested yesterday 🐂. As long as the support level between 110000 and 111000 holds 🛡️, we can continue waiting for a rebound 📈
Buy @111000 - 111500
TP 113000 - 113500 -114000
Accurate signals are updated every day 📈 If you encounter any problems during trading, these signals can serve as your reliable guide 🧭 Feel free to refer to them! I sincerely hope they'll be of great help to you 🌟 👇
Btcusdshort
Bitcoin - Looking To Sell Pullbacks In The Short TermH1 - Strong bearish move.
Currently it looks like a pullback is happening.
No opposite signs.
Expecting bearish continuation until the two Fibonacci resistance zones hold.
If you enjoy this idea, don’t forget to LIKE 👍, FOLLOW ✅, SHARE 🙌, and COMMENT ✍! Drop your thoughts and charts below to keep the discussion going. Your support helps keep this content free and reach more people! 🚀

Drop to around 115300 at midnightAt midnight, BTC saw a significant pullback, dropping to around 115300. Currently fluctuating around this level, and we still maintain that it will stay in an upward trend during the daytime.

BTC’s sharp pullback: Going long for a rebound is preferredBTC has seen a sharp pullback today , forming a stark contrast with gold . Seizing this pullback opportunity to go long ✅ and waiting for a rebound is the best chance
Buy @111000 - 111500
TP 113000 - 113500 -114000
Accurate signals are updated every day 📈 If you encounter any problems during trading, these signals can serve as your reliable guide 🧭 Feel free to refer to them! I sincerely hope they'll be of great help to you 🌟 👇
BTC fell sharply todayBTC has sharply dropped to around 111672 today, its lowest position since September 10 in a sudden flash crash. Judging from the recent data, the BTC price closed at 115699 on September 20 and 115231 on September 21. And on September 22, the price broken below the support level and continued to decline and further declined to around 111672, showing a continuous downward trend. Currently, BTC is fluctuating around 112800, and we can seize the opportunity to go short.
Sell 113000 - 113500
TP 112000-111500 - 111000
Daily-updated accurate signals are at your disposal. If you run into any problems while trading, these signals serve as a reliable reference—don’t hesitate to use them! I truly hope they bring you significant assistance

BTC Analysis TodayAs we’ve maintained all this time, BTC dipped to around 115500 at one point today and that was a great time to buy. Right after the pullback, it rebounded and started rising. the overall upward trend holds, and support level strong.
Buy 115000 - 115500
TP 116000 -116500 - 117000
Daily-updated accurate signals are at your disposal. If you run into any problems while trading, these signals serve as a reliable reference—don’t hesitate to use them! I truly hope they bring you significant assistance

BTCUSD 4H chartAs we mentioned yesterday, BTC dipped to around 115500 at one point today and that was a great time to buy. Right after the pullback, it rebounded and started rising. BTC is now trading between 115600–115700, but the overall upward trend holds, and support level strong.
Buy 115000 - 115500
TP 116000 -116500 - 117000
Daily-updated accurate signals are at your disposal. If you run into any problems while trading, these signals serve as a reliable reference—don’t hesitate to use them! I truly hope they bring you significant assistance

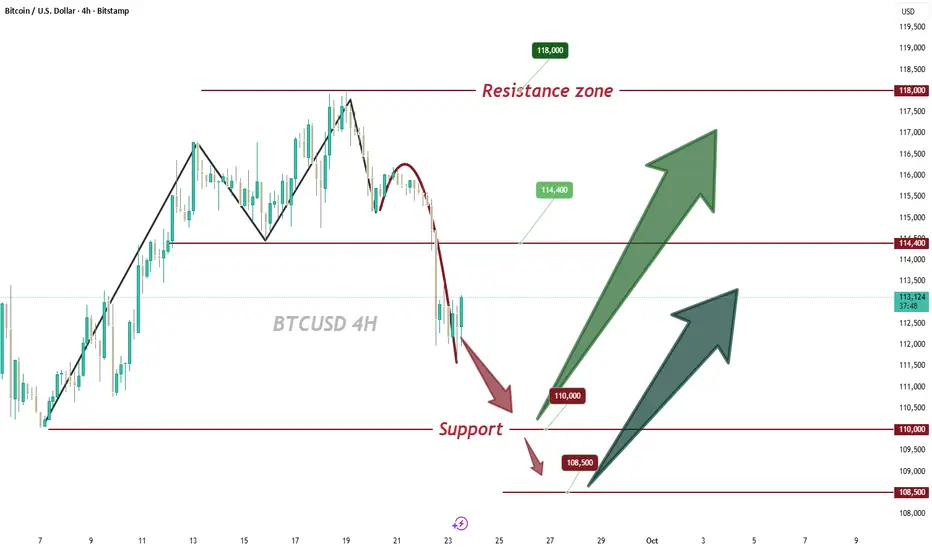
Nailed it! Accurate Prediction of BTCAs we accurately predicted on the 16th, BTC’s resistance level would be concentrated between the 117000 and 118000 and that is exactly what occurred. After advancing to around 117000, it pulled back; subsequently, it rebounded to near 118000 before retreating immediately.
Currently, the support level at 114400 remains solid, and the overall trend continues to be upward.
Buy 115500 - 116000
TP 116500 -117000 - 117500
Daily-updated accurate signals are at your disposal. If you run into any problems while trading, these signals serve as a reliable reference—don’t hesitate to use them! I truly hope they bring you significant assistance

BTC crossing DEATH CROSS (SMA200)You can't say I didn't tell you so. BTC and Nasdaq are highly correlated and the market is just wayyy too hot. All the FOMO in the world won't help now. Overnight we saw a big dip in the Japanese market and the cracks are starting to show. Next will the long term yields spiking as risk goes up and investors want to be compensated for long term risk. Strategy is using VIX, MSTZ, BTCZ as relatively cheap "insurance." The volatility is great, but many don't know how to enter and exit.
The technicals here show weakness at the top, and going from a historical / fundamental perspective we are bound for a nice / deep pullback. When short term rates are cut, and the market bumps up long term rates it is big FU and we all know what happens next. Could be wrong, but worse case you bought into cheap insurance with a massive high reward / risk ratio!
Best of luck out there....!

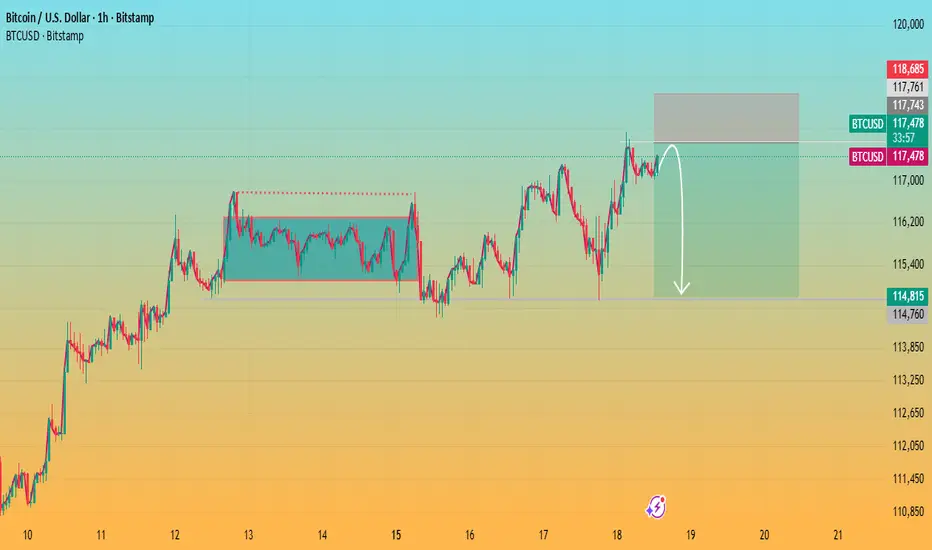
Bitcoin Testing Resistance with Potential Pullback AheadKey observations:
Range Breakout: Earlier, Bitcoin broke out of a consolidation zone (marked box), which triggered the recent upward move.
Resistance Zone: Price is hovering near the 5.15%–5.42% gain zone, where selling pressure has historically emerged.
Pullback Signal: The drawn arrow suggests a possible rejection at this resistance, pointing to a corrective move down toward the 3% zone.
Momentum Check: If BTC fails to hold above this resistance, a retracement is likely. However, a strong breakout could open the door toward 6% gains.
BTCUSD – Key Levels & Outlook Bitcoin trades near $115,445 as mBitcoin trades near $115,445 as markets weigh the upcoming FOMC rate decision that could spark broad risk-asset moves.
Key Levels
Resistance (1H): $115,668 – 116,318. A clean breakout above this zone could open the door to $116,600+.
Intermediate Zone: $115,532 – 115,477 around the 30m FVG (fair value gap).
Support (1H): $115,100, with deeper bids around $114,744 – 114,376 and a final line near $114,134.
Scenarios
Bullish: A dovish Fed or rate-cut surprise could lift BTC through the 1H resistance toward $116,600–117,000.
Bearish: If the Fed stays hawkish or signals fewer cuts, watch for a slide toward $115,100 and potentially $114,700.
Fundamentals
The FOMC decision (8 pm UTC-2) is pivotal. A rate cut would generally weaken USD liquidity costs and may boost crypto demand.
Risk sentiment is key—BTC often mirrors equity volatility during major Fed events.
⚠️ Plan: Expect heightened volatility around the announcement; confirmation of direction likely comes after the Fed press conference.
This is market commentary, not financial advice.
Greetings,
MrYounity

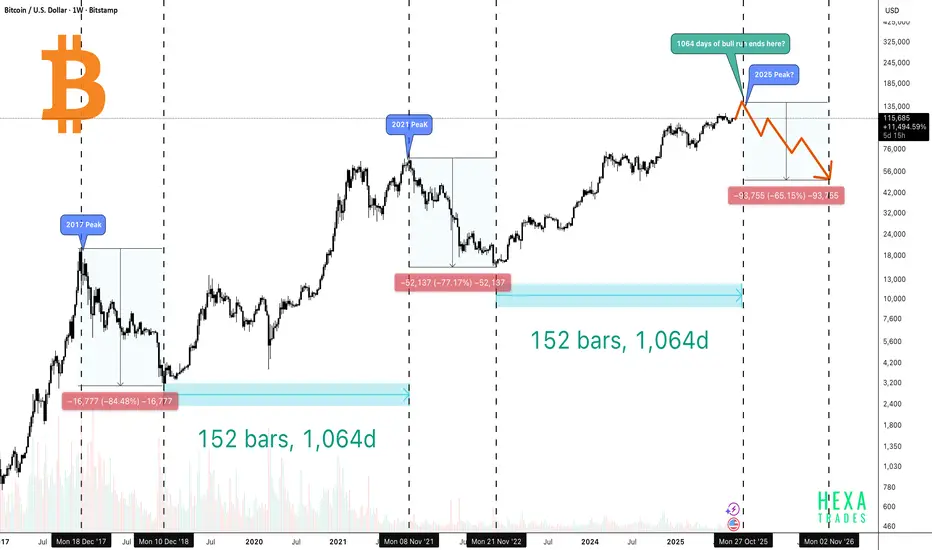
Bitcoin Peak Coming in 45 Days?The above chart compares Bitcoin’s previous market cycles (2017 and 2021) with its current trajectory in 2025, aiming to identify whether history might be repeating. It highlights how long Bitcoin’s bull runs last, how steep the crashes are afterward, and when the next peak and correction could happen.
🔶 2017 Peak
- Bitcoin topped out in December 2017.
- After the peak, BTC crashed by -84%, dropping from around $20K to nearly $3K.
- The bear market lasted about 1 year of decline, followed by roughly 1,065 days of bull run from the bottom before a new cycle peak.
🔶 2021 Peak
- Bitcoin peaked again in November 2021.
- Price fell by -77%, retracing from nearly $69K to about $15K.
- Similarly, the downturn lasted around 1 year of drop, and the recovery phase extended for about 1,065 days of bull run from the bottom.
🔶 2025 Peak?
- If the pattern repeats, the next top could align around late October 2025 and reach the $140K–$150K range.(1,064–1,065 days from the December 2022 bottom).
- In every cycle, Bitcoin’s crash percentage has decreased, suggesting the asset is maturing. If this pattern repeats, we could see a 60–70% drop, pushing the price back toward the $40K–$60K range.
Conclusion
Bitcoin’s historical cycles suggest a repeating rhythm of 1 year of decline followed by ~3 years of recovery and growth. Both the 2017 and 2021 cycles lasted about 1,065 days from bottom to top, with each new bull run setting higher all-time highs and each crash becoming less severe.
If this pattern continues, Bitcoin could potentially reach the $140K–$150K range by late October 2025, before facing another correction in the 60–70% range, possibly pulling the price back to the $40K–$60K zone.
While the market shows signs of maturity with institutional adoption and reduced crash percentages, history reminds us that sharp corrections often follow euphoric peaks. For long-term investors, the lesson remains clear: cycles repeat, but opportunities also return.
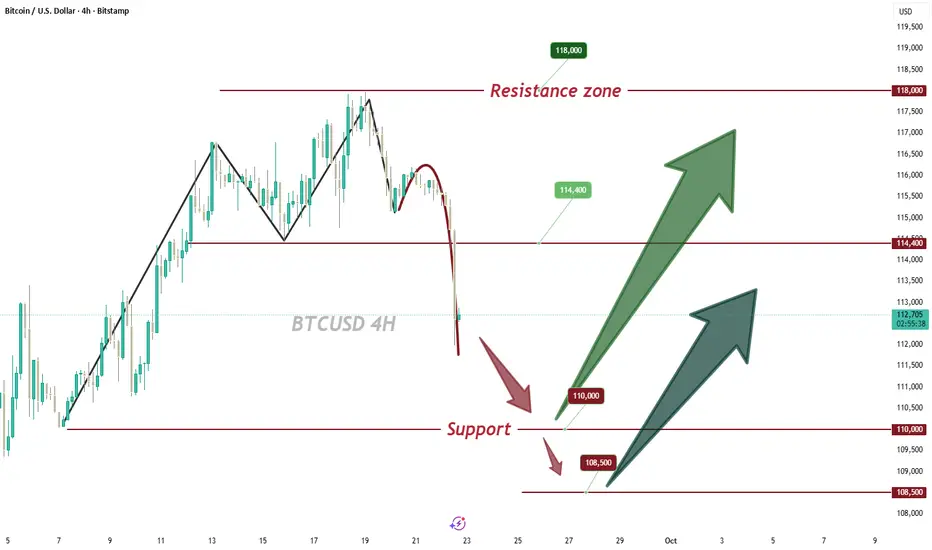
Today's BTCUSD Market AnalysisBTCUSD has shown little overall change compared to yesterday, with the broader market structure remaining intact. The support level remains firm, while esistance level continues to be concentrated in the 117,000–118,000
Buy 114500-115000
TP 115500-116500-117500
Daily-updated accurate signals are at your disposal. If you run into any problems while trading, these signals serve as a reliable reference—don’t hesitate to use them! I truly hope they bring you significant assistance

BTCUSD Market AnalysisObserving price movements, BTCUSD experienced a brief pullback lately after a wave of upward momentum, but the broader bullish structure stays intact. During this pullback, the underlying support proved effective, and the price subsequently rebounded. When it comes to upper resistance, the focus remains on the 117,000 to 118,000 interval.
Buy 114500-115000
TP 115500-116500-117500
Daily-updated accurate signals are at your disposal. If you run into any problems while trading, these signals serve as a reliable reference—don’t hesitate to use them! I truly hope they bring you significant assistance

High-level fluctuations, BTC short-term trading arrangements#BTCUSD
After BTC started to rise from 113500, it continued to fluctuate and consolidate at a high level, and is also waiting for the specific basis point of the Federal Reserve's interest rate cut. In the short term, BTC is experiencing a retracement. Aggressive traders can consider trying to arrange long orders at 115500-115000. Once it falls below 115000, SL is carried out in time, with the target looking at 116500-117500.

Daily Market Analysis of BTCUSDFrom the observation of price movements, recently, after a wave of rise, BTCUSD has experienced short-term pullback, but the overall bullish structure remains intact. During the pullback, the support below was effective, and then the price rose again.
For upper resistance, the focus remains on the 117,000–118,000 USD range.
Buy 114500-115000
TP 115500-116500-117500
Daily-updated accurate signals are at your disposal. If you run into any problems while trading, these signals serve as a reliable reference—don’t hesitate to use them! I truly hope they bring you significant assistance

BTC/USD Sell Setup: Overbought Signals a Pullback!COINBASE:BTCUSD The price is currently approaching a key resistance zone at the upper boundary of the ascending channel. This level often marks the point where a pullback could occur, especially as the price nears the top of the channel. If a correction takes place, the next key support level to watch is 113,500 USD.
Should buyers manage to defend this support, the bullish trend could continue, with potential for the price to break through previous highs. However, if the price breaks below the support level, we may see a deeper retracement back to the lower part of the channel.
This setup offers a potential opportunity to enter if a pullback occurs, especially with confirmation from price action, candle patterns, and volume around the key levels. Make sure to manage risk appropriately and only take trades when your setup is validated.
What are your thoughts on this setup? Drop your comments below, and let’s discuss!
Wishing you successful trades!

Precise Prediction and Forecast for BTCUSD MarketYesterday, we accurately predicted that BTC would rally to around 116,000 USD and face certain resistance. Today, after breaking through 116,000 USD as expected, the price retraced to hover around 115,000 USD.
Looking ahead, if BTC can stabilize near the 115,000 USD level, it is highly likely to continue its upward trajectory, with the potential to retest the 120,000 USD mark. For upper resistance, the focus remains on the 117,000–118,000 USD range
Buy 114000-114500
TP 115000-116000-1175000
Daily-updated accurate signals are at your disposal. If you run into any problems while trading, these signals serve as a reliable reference—don’t hesitate to use them! I truly hope they bring you significant assistance

BTCUSD 4-Hour Chart Analysis
In terms of resistance, the 116,000 level is a key hurdle to watch. If the price can successfully break through 116,000 with strong momentum, it would open the door to further upside potential. Before that, the 115,000 level could act as a near-term resistance to test the bulls' strength.
For traders, the strategy could be to monitor the price action around the 112,500 support. If the support holds and there are signs of a bullish reversal , it may be an opportunity to consider long positions with a target towards 115,000 and then 116,000. Conversely, a breakdown below 112,500 would shift the bias to the downside, with the next support level to watch at 110,640
Overall, the near-term trend hinges on the price's interaction with the 112,500 support and the subsequent attempt to challenge the 115,000 - 116,000 resistance zone.
Buy 112500 - 113500
TP 114500 - 115500 - 116000
Daily-updated accurate signals are at your disposal. If you run into any problems while trading, these signals serve as a reliable reference—don’t hesitate to use them! I truly hope they bring you significant assistance

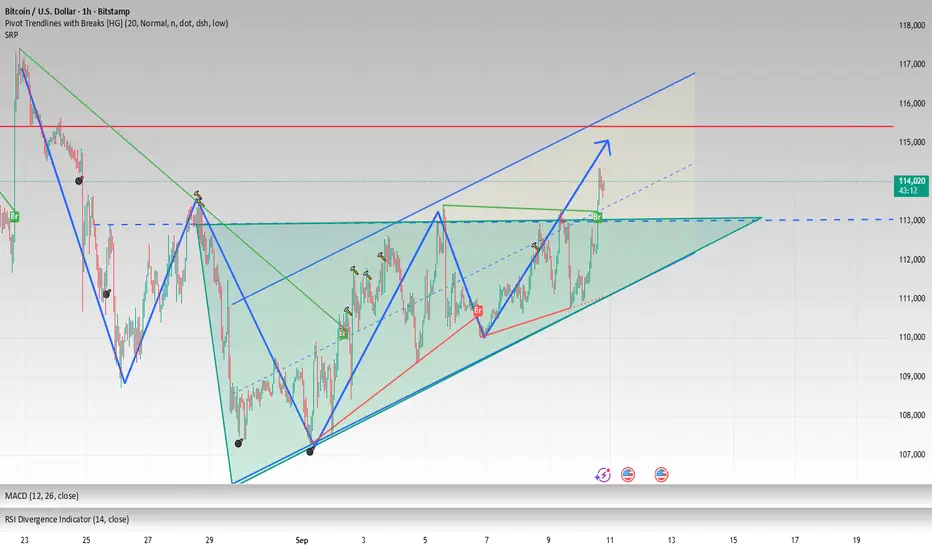
BTC forms an ascending triangle, 113000 is just the beginningBITSTAMP:BTCUSD BTC saw a slight rise during the day. From the hourly and 4H charts, the MACD technical indicator formed a golden cross and broke through the upper short-term pressure of 113000. The short-term trend formed an ascending triangle. Bold and aggressive investors can rely on 113500-112000 to go long, with the target looking at 115500-116500.
BTC Accumulates and Recovers, Rate Cut Near💎 BTC PLAN UPDATE – Early Week (09/08 )
BTC Analysis (D1 timeframe)
Main trend:
BTC is in a recovery phase after breaking out of the downtrend channel (blue).
Currently, the price is hovering around 112K–113K, approaching a key resistance zone.
Key levels:
• Near resistance: 113,590 – 114,124 (confluence of Fib 0.382 and EMA 34).
• Stronger resistance: 116,150 – 117,600.
• Near support: 111,200 (Fib 0.5) and the rising trendline.
• Deeper support: 108,400 – 104,800 (previous lows + Fib 0.618–0.786).
Possible scenarios:
• Scenario 1 (preferred): Price tests resistance at 113,590 → pulls back to 111K–110K → then bounces upward again.
• Scenario 2: If strong buying pushes through 113,590 and holds above 114K, the next target will be 116K–117K.
Overall outlook:
The short-term trend is leaning towards recovery.
However, the 113K–114K resistance zone will determine whether BTC continues higher toward 116K–117K, or drops back to retest supports below 111K.
👉 In summary: BTC is recovering, but 113K–114K is the key zone. A successful breakout could open the way to 116K–117K. A rejection could bring price back to test 111K or even deeper at 108K.

Bitcoin on the road to ZEROCycles and HSI (week 97 today) work alone says CRYPTOCAP:BTC has topped for this cycle and is set to lose at minimum 80%. There is always a clear 5 up, 3 down wave count for BTC and it has completed now. All the massive ETF and Ponzi Treasury Buys couldn't even muster up BTC price to $150k. Its totally cooked.. In my view, its going much lower since the absolute inherent value of all crypto is ZERO. No major central bank will touch it and wants to kill it as BTC presents a threat to the member banks. Come on guys, 2.1 TRILLION UNITS of something makes it rare and scarce. The GENIUS act was the final nail in the coffin for crypto. They will kill it for good soon. The whole coinmarketcap will deflate in the 2026-2031 Greatest Depression. Nobody will have any money and everything will be sold off. The pain will be intolerable for many. Jobs are going away (not because of AI) and crypto will be the last thing people need to survive. This was the final hurrah for Bitcoin. A symbol of the massive speculative excess liquity will be drained in short order shortly...

BTC Ready to Dump?Liquidity Grab Done – Next Stop: Demand Zone! Bitcoin just tapped into a key premium zone, grabbed liquidity above recent highs, and is now showing signs of distribution.
✅ Equal highs? Swept.
📦 Imbalance below? Still open.
📉 Structure shifting bearish? Confirmed.
We're seeing clear signs of a sell-off brewing, with price likely targeting the 109.3k → 108.2k demand zone next.
This isn’t just a dip — it's a potential smart money move to fill that imbalance and hunt liquidity sitting below.
🛑 Don’t get trapped in the chop — watch for continuation below 109.7k to confirm the slide.
Trying to post daily.
