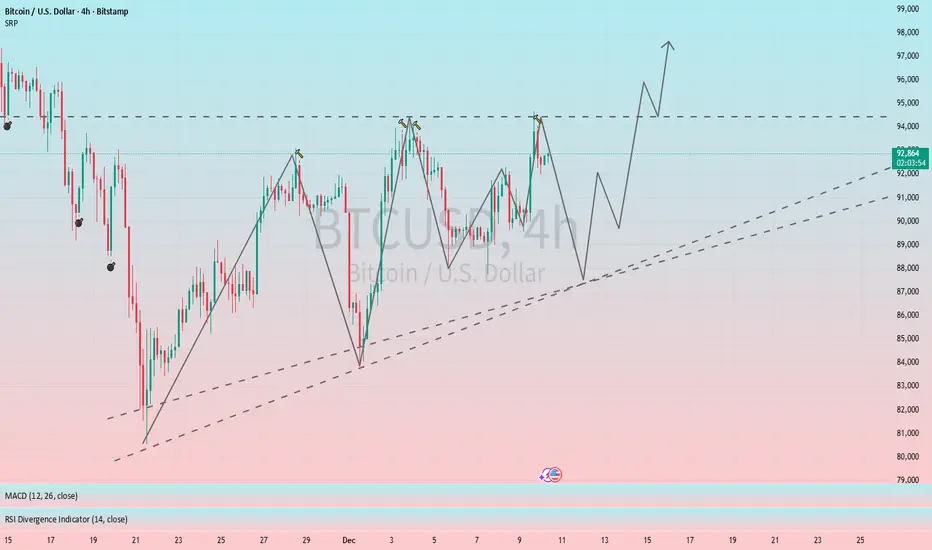
DeGRAM | BTCUSD broke the resistance line📊 Technical Analysis
● BTC/USD completed a prolonged consolidation inside a symmetrical triangle after the November–December decline. Price has broken above the descending resistance line, confirming a bullish breakout with higher lows holding along the rising support trendline.
● The breakout is supported by compression release and range expansion, with price now targeting the upper trendline zone near 95,000–98,000. Former resistance around 90,000–92,000 acts as key support on pullbacks.
💡 Fundamental Analysis
● Bitcoin remains supported by expectations of looser global liquidity conditions, sustained institutional demand, and continued ETF inflows, reinforcing medium-term upside bias.
✨ Summary
● Bullish breakout confirmed. Support: 90,000–92,000. Targets: 95,000–98,000. Structure favors continuation above triangle support.
-------------------
Share your opinion in the comments and support the idea with a like. Thanks for your support!
Btcusdsignal

ElDoradoFx – BTCUSD ANALYSIS (25/12/2025, BANK HOLIDAY UPDATE)HI EVERYONE PLEASE SUBSCRIBE TO OUR YOUTUBE CHANNEL FOR FREE DAILY FORECAST.
LINK IN OUR BIO.
1. Market Overview
BTCUSD is in a higher-timeframe corrective phase inside a broader bullish macro structure.
After rejecting the HTF supply around 126k earlier in the year, price has been trending lower but is now stabilising above a major structural demand zone between 86.4k – 84.4k.
The current market state is:
• Macro: Bullish market → medium-term correction
• Structure: Range / compression after sell-off
• Liquidity: Sell-side has been partially taken, buy-side remains above 88.8k and 90.6k
• Momentum: Bearish impulse exhausted, bullish momentum building
This suggests we are transitioning from distribution → markdown → accumulation / rebalancing.
⸻
2. Technical Breakdown
🔹 Daily (D1)
• Market printed a full impulse down from ~116k → ~80.6k (clean bearish leg).
• Price is now holding above the D1 strong low (80,630) and forming higher lows.
• White 50 EMA is flattening; yellow 200 EMA still above price (bearish pressure remains).
• Daily structure is neutral → early recovery, not yet bullish.
Key read:
As long as 80.6k holds, this is a corrective leg — not a trend reversal.
⸻
🔹 H1
• Trendline break to the upside after the 80.6k low.
• BOS up toward 90.5k failed and created a lower high → rejection → pullback.
• Price now compressing between:
• Resistance: 88.0k – 88.6k
• Support: 86.4k – 87.0k
Structure: Range inside recovery channel.
⸻
🔹 30M
• Market swept below 86.4k liquidity, then reclaimed it.
• Internal BOS printed bullish, but price is now ranging under supply.
• Strong reaction every time price hits 86.4k demand.
This is accumulation behaviour.
⸻
🔹 15M
• Equal highs taken near 88.0k, but continuation failed.
• Price remains above trendline support and demand.
• CHoCH bullish → then sideways compression.
⸻
🔹 5M
• Micro structure alternating — no directional control.
• Liquidity sitting:
• Above: 88.4k – 88.8k
• Below: 86.8k – 86.4k
Market waiting for a liquidity trigger.
⸻
3. Fibonacci Analysis
Swing used:
Low → High = 80,630 → 90,588
Fib Level Price
38.2% 86,960
50.0% 85,609
61.8% 84,258
🟩 Golden Zone: 86.9k – 84.2k
(Current price is sitting at the top of the Golden Zone)
This is a classic re-accumulation zone after a sell-off.
⸻
4. High-Probability Trade Scenarios
📈 BUY Scenario (Primary Bias)
Zone: 86,900 – 84,300 (Golden Zone / HTF demand)
Confirmation:
• 5M or 15M bullish BOS from the zone
• Rejection wick + volume increase
Targets:
• 88,100
• 89,400
• 90,600
• 93,900 (if weekly breakout occurs)
Invalidation: Daily close below 84,000.
⸻
📈 BUY Breakout
Trigger: Break & hold above 88,800
Retest: 88,200–88,500 holding
Targets: 90,600 → 93,900 → 98,800
⸻
📉 SELL Scenario (Countertrend)
Only valid on rejection from 88.6k–90.6k.
Targets: 87,200 → 86,400 → 85,600
Invalidation: Break above 90.6k.
⸻
📉 SELL Breakdown
Trigger: Daily close below 84,000
Targets: 82,000 → 80,600 → 76,000
This would signal a deeper macro correction.
⸻
5. Fundamental Watch
• Bank holiday liquidity → false moves possible.
• No major crypto or macro catalysts scheduled.
• ETF flows + risk sentiment likely dominate next week.
⸻
6. Key Technical Levels
Resistance
• 88,100
• 88,800
• 90,600
• 93,900
Support
• 86,900
• 86,400
• 85,600
• 84,300
• 80,600
⸻
7. Analyst Summary
BTCUSD is not bearish — it is correcting inside a long-term bull market.
The sell-off has done its job. The market is now compressing above HTF demand and preparing for its next directional move.
This is a classic:
Sell-off → Stabilisation → Accumulation → Expansion structure.
⸻
8. Final Bias Summary
🟢 Short-term bias: Neutral → Bullish above 86.4k
🟢 Weekly bias: Bullish recovery unless 84k breaks
🔴 Bearish only if: Daily close < 84k
Primary expectation for next week:
👉 Range early → liquidity sweep → bullish continuation toward 90.6k+.
⸻
✅ Conclusion
• The downside is largely exhausted.
• Smart money is building positions in the 86k–84k zone.
• The next clean break is likely up, not down.
Patience + confirmation buys > aggressive sells.
⸻
🥇 ElDoradoFx PREMIUM 3.0 – PERFORMANCE 24/12/2025 🥇
⚡ Precision execution. Swing objectives completed.
📈 BUY +40 PIPS
⚖️ SELL – BE
❌ SELL −40 PIPS (SL)
📉 SELL +20 PIPS
📈 BUY +90 PIPS
📉 SELL +210 PIPS
📉 SELL +20 PIPS
━━━━━━━━━━━━━━━
💎 SWING TRADES – FULL TP HIT
• Entry 3959 ➤ +5,410 pips
• Entry 4000 ➤ +5,000 pips
• Entry 4124 ➤ +3,760 pips
• Entry 4275 ➤ +2,250 pips
• Entry 4293 ➤ +2,070 pips
• Entry 4325 ➤ +1,750 pips
• Entry 4406 ➤ +940 pips
📊 Swing Total: +21,180 pips
━━━━━━━━━━━━━━━
💰 DAY RESULT: +340 PIPS
(BE excluded, SL deducted)
🎯 6 Counted Signals → 5 Wins | 1 SL
🔥 Accuracy: 83%
━━━━━━━━━━━━━━━

DeGRAM | BTCUSD seeks to the $80k📊 Technical Analysis
● BTC/USD remains under a descending dynamic resistance after a series of bear flags and a completed triangle breakdown. The failure to reclaim and hold above the 90,000 resistance confirms bearish continuation within the broader downtrend.
● Price is compressing below former support turned resistance, with momentum favoring a move toward the major demand zone near 80,000–82,000. Any rebounds toward 90,000 are viewed as corrective while below the resistance line.
💡 Fundamental Analysis
● Bitcoin faces pressure from tighter global financial conditions and reduced risk appetite, with capital rotating away from high-beta assets amid yield support for USD.
✨ Summary
● Bearish structure intact. Key resistance: ~90,000. Downside target: 80,000–82,000. Invalidation above descending resistance.
-------------------
Share your opinion in the comments and support the idea with a like. Thanks for your support!

DeGRAM | BTCUSD is forming an ascending wedge📊 Technical Analysis
● BTC/USD remains inside a broad descending structure, with price repeatedly rejecting the main resistance trendline. Multiple falling triangles and continuation patterns confirm sustained bearish control and lower highs across the 16H timeframe.
● The latest consolidation formed below trend resistance near 95,000–96,000, followed by rejection, signaling continuation risk toward the major demand zone around 84,000–82,000, where the long-term support line aligns.
💡 Fundamental Analysis
● Bitcoin faces pressure from tighter global liquidity conditions and cautious risk sentiment as markets reassess rate-cut expectations and ETF inflows lose momentum, keeping upside demand limited in the medium term.
✨ Summary
● Bearish bias below 96,000. Targets: 88,000 → 84,000. Key resistance: 100,000.
-------------------
Share your opinion in the comments and support the idea with a like. Thanks for your support!

Ascending triangle formation indicates a bullish outlook for BTC#BTCUSD BITSTAMP:BTCUSD BINANCE:BTCUSDT
From the 4H chart, BTC's short-term trend has formed an ascending triangle pattern, which is a typical bullish pattern. Short-term resistance is located at 93500-94500, a break above this level would likely lead to further gains. The key support level to watch is 88000-87500. If the price retraces to this range, we can consider going long on BTC.
DeGRAM | BTCUSD will test the $80k level📊 Technical Analysis
● BTC is retesting the multi-month support zone near 80K, aligning with the long-term ascending base and the lower boundary of the falling trend, creating conditions for a medium-term rebound.
● A break above the descending resistance line could trigger recovery toward 92K as the structure shows exhaustion of bearish momentum.
💡 Fundamental Analysis
● Recent ETF inflows and easing macro pressure from U.S. yields support accumulation near major support zones.
✨ Summary
● Bullish bias from 80K support. Targets: 88K → 92K. Key support: 80K.
-------------------
Share your opinion in the comments and support the idea with a like. Thanks for your support!

DeGRAM | BTCUSD will rebound to $92k level📊 Technical Analysis
● BTC/USD formed a false break below the 82K support zone while bouncing off the long-term dynamic support line, signalling seller exhaustion and a potential mid-trend reversal.
● Price is reclaiming structure inside the descending channel; a push toward 90–92K becomes likely if buyers break the local diagonal resistance.
💡 Fundamental Analysis
● Bitcoin sentiment improves as risk appetite stabilizes and institutional inflows show signs of recovery.
✨ Summary
Support: 82K. Targets: 90K → 92K. Medium-term bullish bias while above dynamic support.
-------------------
Share your opinion in the comments and support the idea with a like. Thanks for your support!

DeGRAM | BTCUSD continues to decline below $85k📊 Technical Analysis
● BTC/USD continues to move within a broad descending channel, rejecting the dynamic resistance line multiple times and forming lower highs.
● Price is failing to reclaim the 88–90K resistance zone, and the structure points toward a continuation lower into the 82–80K support region as momentum weakens.
💡 Fundamental Analysis
● Bitcoin remains under pressure as risk sentiment cools and ETF inflows slow, with stronger USD liquidity weighing on crypto.
✨ Summary
Resistance: 88–90K. Targets: 82K → 80K. Medium-term bearish bias while below channel resistance.
-------------------
Share your opinion in the comments and support the idea with a like. Thanks for your support!

DeGRAM | BTCUSD is testing the $90k level📊 Technical Analysis
● BTC/USD is testing a major support cluster near 88–90K, where price aligns with the long-term dynamic support line formed from previous triangle and flag breakdowns.
● The new rejection wick at support and the descending channel structure suggest a potential medium-term rebound toward 95–97K if buyers defend this level.
💡 Fundamental Analysis
● Bitcoin sentiment stabilizes as ETF inflows resume and risk assets recover after easing US inflation expectations.
✨ Summary
Support: 88–90K. Rebound potential: 95–97K. Medium-term bullish scenario valid while holding the dynamic support.
-------------------
Share your opinion in the comments and support the idea with a like. Thanks for your support!

DeGRAM | BTCUSD BTCUSD is aiming to reach a key support level.📊 Technical Analysis
● BTC is approaching a major confluence zone where the long-term support line meets the key demand area near 94k–92k. This level previously triggered strong reversals.
● Price remains inside a broad falling structure, and a bounce from the lower boundary would confirm trend exhaustion and open room for recovery toward 102k–108k.
💡 Fundamental Analysis
● FXStreet reports renewed inflows into BTC ETPs and improving risk sentiment as markets expect milder Fed policy, supporting medium-term bullish pressure.
✨ Summary
BTC nearing 94k–92k demand; bounce may target 102k–108k. Key support: 92k. Break above falling trend = continuation.
-------------------
Share your opinion in the comments and support the idea with a like. Thanks for your support!

ANFIBO | BTCUSD - $94.000 or $70.000? [11.6.2025]Hi traders, Anfibo's here!
BTCUSD – Technical Outlook
Technical Structure:
Price action currently respects a descending channel, with:
- Upper boundary (resistance): around $106,000 – $107,000
- Lower boundary (support): converging with the D1 trendline and the 0.618 Fibonacci retracement zone, located between $94,000 – $95,000
This confluence area at $94,000 – $95,000 will be crucial. It not only represents technical alignment between multiple structures (Trendline + Fibonacci) but also marks the boundary where short-term sentiment could shift from corrective to impulsive.
Trading Strategy:
Our tactical approach remains straightforward and adaptive:
“Trade the trend when touched – reverse the bias if the trend breaks.”
#1 – Rejection at Upper Boundary:
Should BTC retest the 106–107k resistance and fail to break through, short-term sell opportunities may arise targeting the mid-range or lower boundary (95k region).
#2 – Reaction at Lower Boundary:
If price reaches the 94–95k support zone and holds, this area could offer high-probability long entries, particularly if accompanied by bullish divergence or strong volume confirmation.
#3 – Breakdown of Structure:
A clean break below $90,000 would signal structural weakness, exposing BTC to the next major support cluster between $80,000 and $70,000. Such a move would represent a deeper corrective leg in the broader cycle and could reset the market’s medium-term trend.
Trading Plan:
>>> SELL ZONE: (x1000)
ENTRY: 106 - 108
SL: 109
TP: 95
>>> BUY ZONE:(x1000)
ENTRY: 93 - 95
SL: 90
TP: 120
Risk Management:
- Stick to small-to-medium positions within the range; increase size only on confirmed breakouts.
- Keep stops tight, as sideways phases tend to trigger false signals.
- Maintain Risk:Reward ≥ 1:2 and avoid overtrading in choppy conditions.
- Reassess bias once the channel is clearly broken.
Conclusion:
BTC is currently in a compressed, corrective phase, moving within a defined range. The key battleground lies between $95,000 and $107,000. Traders should remain flexible, respecting both boundaries of the channel and reacting based on breakout confirmations rather than anticipation.
As long as BTC holds above the $94,000 – $95,000 confluence, the broader bullish structure on the daily timeframe remains intact. However, a decisive break below $90,000 would open the door for a larger-scale correction toward the $80,000 - $70,000 zone—where long-term accumulation could once again become attractive.
GOODLUCK GUYS!!!

DeGRAM | BTCUSD will rebound from the $100k level📊 Technical Analysis
● Bitcoin is trading above the long-term support zone near $100 K, where a double-bottom formation took shape, suggesting base formation ahead of a potential breakout.
● The market approaches a descending resistance line around $106 K–$108 K, with recent upside momentum hinting at a retest of this resistance while preserving the higher-low structure.
💡 Fundamental Analysis
● Bitcoin’s bullish case is reinforced by renewed institutional accumulation and broader digital-asset adoption, while improving macro risk sentiment lessens safe-haven crowding.
✨ Summary
• Support: ~$100 K region
• Resistance: ~$106 K–$108 K
• Bias: Long above support with breakout potential toward ~$110 K on momentum and accumulation signals.
-------------------
Share your opinion in the comments and support the idea with a like. Thanks for your support!

DeGRAM | BTCUSD will test the $101k level📊 Technical Analysis
● BTC/USD is approaching a key confluence of descending resistance lines after rebounding from the $101,000 support area. This level aligns with the broader resistance channel that has capped price since mid-September.
● Despite recent recovery attempts, the structure remains bearish, with lower highs signaling that sellers may regain control near $107,000–$108,000, potentially driving a retest of $101,000.
💡 Fundamental Analysis
● Bitcoin faces pressure from stronger U.S. economic data and rising Treasury yields, reducing appetite for risk assets in the near term.
✨ Summary
● Resistance: $108,000. Support: $101,000. Rejection at resistance could trigger a correction toward $98,000–$101,000.
-------------------
Share your opinion in the comments and support the idea with a like. Thanks for your support!

ElDoradoFx – BTCUSD ANALYSIS (09/11/2025, WEEKEND EDITION) (09/11/2025, WEEKEND EDITION)
⸻
1. Market Overview
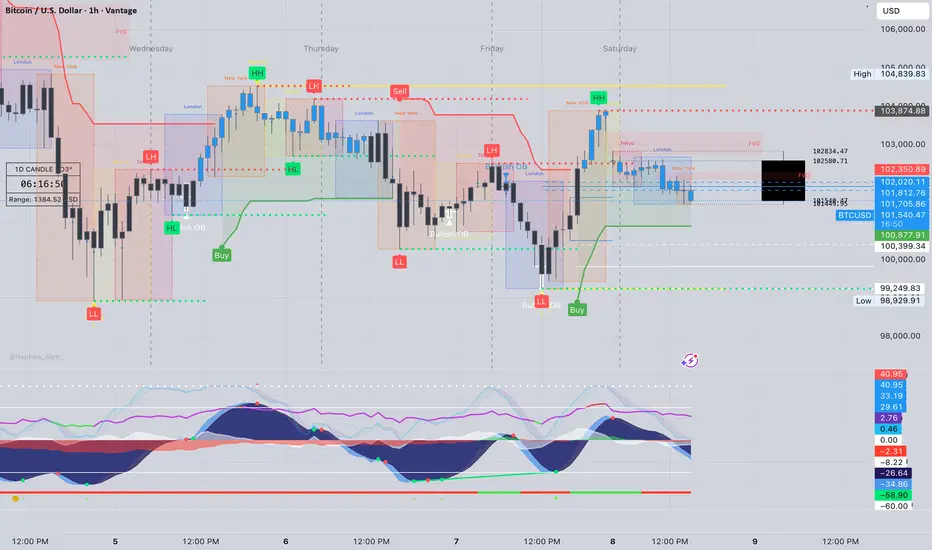
Bitcoin (BTCUSD) remains under bearish pressure around $101,500, extending its correction from the recent $103,800 recovery peak. Price action confirms a sustained rejection at the $102,600–$103,000 supply zone, with downside continuation now favored as sellers maintain control.
The broader market context shows BTC trapped between the $102,600 ceiling and $99,200 floor, forming a descending channel. Unless bulls reclaim $102,600+, momentum remains bearish heading into next week’s macro calendar (CPI & PPI releases).
⸻
2. Technical Breakdown
🔹 Daily (D1):
• BTC continues trading below the 20EMA, 50EMA, and 100EMA — confirming sustained bearish structure.
• RSI ~38, indicating weak momentum and no signs of trend reversal.
• MACD histogram continues printing red bars, showing continuous sell-side pressure.
• Price remains within a macro range between $99,000–$108,000, with downside favored until structure shifts.
🔹 H1:
• Strong rejection from descending trendline at $102,300–$102,600.
• CHoCH confirmed to the downside below $101,800.
• EMAs aligned bearish (20 < 50 < 200).
• RSI below 45; MACD momentum fading — signals bearish continuation likely.
🔹 15M–5M:
• Structure shows lower highs and weak pullbacks.
• Minor demand zone at $101,000–$100,900; break of this level could trigger a liquidity sweep toward $99,200.
• RSI near 36 with weak MACD cross — short-term bounce possible but unsustainable without strong volume.
⸻
3. Fibonacci Analysis (Last Swing: 103,896 → 99,249)
Level Price (USD) Comment
38.2% 101,037 First retracement / initial resistance
50.0% 101,570 Mid-zone equilibrium
61.8% 102,090 Key reaction level within supply zone
🎯 Golden Zone: 101,000 – 102,090 → Acting as intraday supply zone for high-probability sells.
⸻
4. High-Probability Trade Scenarios
📉 Bearish Continuation Setup (Main Bias)
• Entry Zone: 101,900 – 102,400 (Golden Zone retest)
• TPs: 101,000 → 100,000 → 99,200 → 98,800
• SL: Above 102,600
• Confirmation: Rejection candle + RSI failure to cross 50
• Rationale: Retest of former support turned resistance within descending structure; EMAs and momentum indicators favor continuation.
💥 Breakout SELL Setup
• Trigger: 1H candle close below 100,900
• Retest Zone: 101,100 – 101,300
• TPs: 100,000 → 99,200 → 98,500
• SL: Above 101,600
• Rationale: Structural break of key demand; confirms continuation of broader downtrend.
📈 Countertrend BUY Setup (Low Probability)
• Entry Zone: 99,200 – 98,900 (Liquidity Sweep Zone)
• TPs: 100,800 → 101,600 → 102,400
• SL: Below 98,700
• Confirmation: Bullish divergence on RSI or MACD + absorption wicks
• Rationale: Potential liquidity collection zone where short covering may occur; low conviction long setup.
⸻
5. Fundamental Watch
• Weekend volatility remains thin; potential for stop-hunts before Monday’s open.
• DXY holding above 105 supports bearish sentiment in BTC.
• No major macroeconomic catalysts until early next week — expect range-bound but reactive price behavior.
• CME futures gap near $102,800 could attract a brief fill before resumption lower.
⸻
6. Key Technical Levels
Type Levels (USD)
Resistance 102,400 / 102,600 / 103,000 / 105,800
Support 101,000 / 100,000 / 99,200 / 98,900
Golden Zone 101,000 – 102,090
Break Buy Trigger > 102,600
Break Sell Trigger < 100,900
⸻
7. Analyst Summary
BTC is consolidating under the 102K–103K ceiling, showing clear exhaustion from buyers and renewed strength from sellers. The Golden Zone (101,000–102,090) offers the highest-probability sell opportunities for continuation to 99K.
Momentum, EMAs, and trend alignment all support a bearish outlook unless price cleanly reclaims 102,600+ on H1 structure.
⸻
8. Final Bias Summary
✅ Primary Bias: Bearish below 102K — selling rallies within the 101–102K zone targeting 99K.
⚠️ Secondary Bias: Bullish recovery only if 102,600 breaks with volume and structure shift confirmed.
⸻
— ElDoradoFx PREMIUM 3.0 Team 🚀
DeGRAM | BTCUSD is continuing to correct📊 Technical Analysis
● BTC/USD is testing the main support trendline of a long-term ascending structure. A confirmed close below this level could trigger a decline toward the $100,000–$97,000 zone.
● The price has repeatedly rejected from the descending resistance channel, showing weakening bullish momentum and confirming potential continuation of the correction phase.
💡 Fundamental Analysis
● Bitcoin faces pressure as risk sentiment cools following Fed comments about higher-for-longer rates and slowing institutional inflows.
✨ Summary
● Short bias below $107K; targets $100K–$97K. Breakdown confirmation may extend medium-term bearish movement.
-------------------
Share your opinion in the comments and support the idea with a like. Thanks for your support!

DeGRAM | BTCUSD returned to the $111k level📊 Technical Analysis
● BTC/USD has rejected the dynamic resistance line near 114,000, confirming continuation of the descending structure visible since mid-October.
● A breakdown below 111,000 could accelerate losses toward the 106,000–105,000 dynamic support zone, completing a corrective leg within the broader channel.
💡 Fundamental Analysis
● Bitcoin faces pressure from hawkish Fed expectations and reduced ETF inflows, while profit-taking among large holders weighs on sentiment.
✨ Summary
● Short bias below 114,000; target 106,000–105,000. Technical rejection and macro tightening support bearish continuation.
-------------------
Share your opinion in the comments and support the idea with a like. Thanks for your support!

ElDoradoFx – BTCUSD WEEKEND ANALYSIS (02/11/2025, US SESSION)
🧭 1️⃣ Market Overview
Bitcoin retraced after testing the intraday resistance near 111,238, facing rejection at the upper boundary of the descending channel. Price remains supported above 110,000, respecting both the dynamic ascending trendline and 200 EMA on intraday charts. Momentum has cooled but the market still holds a mildly bullish structure unless 109,700 breaks. Volatility is expected to remain moderate heading into early-week sessions.
⸻
📊 2️⃣ Technical Breakdown
✅ Daily (D1)
• Structure: Rangebound between 108,300 and 111,800.
• EMAs: Price hovering between 50 and 200 EMA, equilibrium zone.
• RSI (47): Neutral – no divergence.
• MACD: Histogram flattening; momentum loss after prior bullish impulse.
→ Interpretation: Consolidation phase, waiting for directional breakout.
✅ 1-Hour (H1)
• Clean BOS from 109,600 led to impulsive rise to 111,200.
• Currently retracing toward the 50 EMA and trendline support.
• Key support: 110,100–109,900.
→ Interpretation: Market retesting support after profit-taking; potential bullish re-entry if structure holds.
✅ 15M–5M (Intraday)
• Price rejecting 111,238 and forming short-term lower highs.
• RSI rebounding from 35 – possible micro bullish correction.
• MACD showing first red bars, indicating short-term retracement nearing exhaustion.
→ Interpretation: Possible liquidity sweep around 110,000 before upward continuation.
⸻
📐 3️⃣ Fibonacci Analysis
Swing Range: 109,703 → 111,238
Level Price Observation
38.2% 110,671 Minor support zone
50.0% 110,470 Golden mid-level + EMA confluence
61.8% 110,268 Trendline & structural confluence
✅ Golden Zone: 110,671 – 110,268 (high-probability buy zone)
⸻
🎯 4️⃣ High-Probability Trade Scenarios
🟢 BUY SCENARIOS (Primary Bias)
Scenario A – Golden Zone Reversal (Ideal Setup)
• Entry Zone: 110,671 – 110,268
🎯 TP1 → 111,000 TP2 → 111,238 TP3 → 111,800
🛑 SL → Below 109,900
Scenario B – Breakout Continuation
• Trigger: Break & retest above 111,238
🎯 TP1 → 111,800 TP2 → 112,200 TP3 → 112,800
🛑 SL → Below 110,800
⸻
🔻 SELL SCENARIOS (Alternative)
Scenario A – Breakdown from Structure
• Trigger: Break & retest below 109,700
🎯 TP1 → 109,200 TP2 → 108,600 TP3 → 108,000
🛑 SL → Above 110,200
Scenario B – Rejection from 111,200–111,400 Zone
• Trigger: Bearish engulfing candle rejection.
🎯 TP1 → 110,600 TP2 → 110,000
🛑 SL → Above 111,500
⸻
🕐 5️⃣ Fundamental Watch
• Weekend volatility lower than average; price reactive to liquidity sweeps.
• DXY steady near 104.8 – neutral macro tone.
• ETF accumulation flows remain supportive for mid-term trend.
• Watch US macro data midweek (PMI & NFP) for volatility spikes.
⸻
⚙️ 6️⃣ Key Technical Levels
Type Levels
Resistance 111,238 / 111,800 / 112,200
Support 110,268 / 109,900 / 109,700
Golden Zone 110,671 – 110,268
Breakout Confirmation Above 111,238 or Below 109,700
⸻
🧾 7️⃣ Analyst Summary
BTC continues consolidating within a controlled retracement phase, currently resting in the Golden Zone (110,671–110,268) that aligns with the ascending trendline. Holding above this range favors bullish continuation, while a confirmed break below 109,700 would open downside space. Short-term trades favor long positions within the zone, targeting 111,200–111,800.
⸻
📈 8️⃣ Final Bias Summary
🟢 Bullish bias above 110,200 → Targets 111,200 / 111,800
🔻 Bearish bias below 109,700 → Targets 108,800 / 108,000
⸻

DeGRAM | BTCUSD broke the dynamic resistance line📊 Technical Analysis
● BTC/USD has broken above its dynamic resistance line, signaling a shift toward bullish momentum after consolidating near the 110K zone.
● A potential retest of 114K–115K could act as a springboard for continuation toward the key 118K resistance, aligning with the upper channel boundary.
💡 Fundamental Analysis
● Bitcoin’s rally is fueled by ETF inflows and renewed institutional demand, while easing U.S. inflation expectations support risk-on sentiment.
✨ Summary
● Long bias above 114K; targets 118K. Bullish breakout and improving fundamentals favor medium-term upward continuation.
-------------------
Share your opinion in the comments and support the idea with a like. Thanks for your support!

DeGRAM | BTCUSD seeks to test the support area📊 Technical Analysis
● BTC/USD broke key ascending support near 110,000, turning it into resistance and confirming a bearish continuation structure.
● The price is moving within a descending channel targeting the 102,700 demand zone, suggesting further downside momentum.
💡 Fundamental Analysis
● Bitcoin faces selling pressure as U.S. yields rise and risk appetite weakens, while ETF inflows slow and market liquidity remains tight.
✨ Summary
● Short bias below 110,000; objectives 103,000–102,700. Technical breakdown and weaker macro backdrop reinforce medium-term bearish outlook.
-------------------
Share your opinion in the comments and support the idea with a like. Thanks for your support!

DeGRAM | BTCUSD defended the $110k level📊 Technical Analysis
● CRYPTOCAP:BTC rebounded sharply from the 108K–109K demand zone, confirming strong buyer defense and maintaining the rising channel structure.
● Daily close above 111.5K turned previous resistance into support, setting the stage for a climb toward 123K as momentum strengthens.
💡 Fundamental Analysis
● Bitcoin sentiment improves as ETF inflows rise and the U.S. CPI outlook supports reduced rate hike expectations, boosting risk assets.
✨ Summary
● Long bias above 111.5K; target 123K. Technical recovery aligns with improving macro backdrop and renewed institutional demand.
-------------------
Share your opinion in the comments and support the idea with a like. Thanks for your support!

DeGRAM | BTCUSD seeks to reach the resistance line📊 Technical Analysis
● BTC/USD broke above key resistance at 122,000, confirming a strong bullish continuation. The breakout from the descending channel and the retest of the former resistance as support signal sustained buying interest.
● The next technical target lies near 126,700, with potential extension toward the 130,000 zone if momentum remains intact.
💡 Fundamental Analysis
● Optimism around Bitcoin ETF inflows and growing institutional accumulation continue to support bullish sentiment, while easing U.S. yields enhance risk appetite.
✨ Summary
● Momentum favors continuation above 122,000 toward 126,700–130,000. Pullbacks to the support zone could offer renewed buying opportunities.
-------------------
Share your opinion in the comments and support the idea with a like. Thanks for your support!

DeGRAM | BTCUSD near the $120k level📊 Technical Analysis
● BTC/USD rebounded strongly from the 117,000 support, showing consistent higher lows along the support line, with bulls driving momentum toward resistance.
● Chart structure points to a pullback before continuation, targeting 124,450, as the pair remains within a broad rising channel.
💡 Fundamental Analysis
● Bitcoin gains support from increasing institutional inflows and optimism around U.S. regulatory clarity, with traders positioning ahead of potential spot ETF approvals.
✨ Summary
● BTC/USD maintains bullish structure above 117,000, with upside targets near 124,450, supported by both technical continuation and strengthening fundamental sentiment.
-------------------
Share your opinion in the comments and support the idea with a like. Thanks for your support!

DeGRAM | BTCUSD seeks to the $118k level📊 Technical Analysis
● BTC/USD bounced from the demand zone near 111K and reclaimed 114K resistance, signaling a structural shift toward bullish momentum.
● Current price action shows potential continuation with targets around 118K–124K if higher lows sustain above 112K.
💡 Fundamental Analysis
● Optimism in crypto markets is supported by rising institutional inflows and growing expectations of U.S. rate cuts, boosting risk assets.
✨ Summary
BTC/USD holds above 114K, with upside targets at 118K and 124K. Support rests at 112K for medium-term bullish continuation.
-------------------
Share your opinion in the comments and support the idea with a like. Thanks for your support!
