BITCOIN making the FINAL PUSH! Only 6 months of BULL left!Bitcoin (BTCUSD) has had n astonishing symmetry among its Cycles in the past 11 years, as all three of the Bear Cycles have had identical durations (13 and 12 months twice) as well as the two Bull Cycles (both 35 months).
As a result, there is no reason to assume otherwise for the current Bull Cycle as well, which if it also lasts for 35 months, it will peak in October 2025. This means that BTC might 'only' have another 6 months of Bull Cycle ahead of it but that's not bad news as historically this phase tends to be the most aggressive part.
Even if it's not, various studies we've done before point out that a price around $150k would be more than fair and practically a 'pessimistic' scenario for the Cycle High.
Do you think that will be the case? Feel free to let us know in the comments section below!
-------------------------------------------------------------------------------
** Please LIKE 👍, FOLLOW ✅, SHARE 🙌 and COMMENT ✍ if you enjoy this idea! Also share your ideas and charts in the comments section below! This is best way to keep it relevant, support us, keep the content here free and allow the idea to reach as many people as possible. **
-------------------------------------------------------------------------------
💸💸💸💸💸💸
👇 👇 👇 👇 👇 👇
Btcusdsignals

(BTC/USD) Short Trade Setup: Key Resistance Rejection with Targe1. Entry Point: 104,855
This is where the trader plans to enter a short position (sell).
Price is slightly below this level at the moment (103,775).
2. Stop-Loss Zone: ~104,807
Highlighted in purple above the entry.
Indicates where the trader will exit if the market moves against them to limit losses.
3. Resistance Point: 103,086
This level has been tested multiple times and may act as a ceiling for prices.
If broken and held, it might invalidate the short setup.
4. Target Point: 93,159
This is the take-profit level for the short trade.
Represents a drop of approximately -10.76% from the entry point.
5. Trend Analysis:
The chart shows an uptrend leading into a potential distribution or topping pattern near the resistance zone.
A potential bearish move is anticipated, hence the short strategy.
6. Support Zones:
Highlighted in purple near the target area (around 93,159).
Historically strong buying areas.
Interpretation:
The trader expects the current resistance level to hold, prompting a downward correction toward the target zone at 93,159. If price moves above 104,807, the setup is invalidated, hence the stop-loss placement.

BITCOIN on similar spot as before the U.S. elections! 155k next?Bitcoin (BTCUSD) broke last week above the Lower Highs trend-line of its December 2024 High and so far on the current 1W candle, it's consolidating on it.
This is the exact same price action we saw on the October 21 2024 1W candle, which after breaking above that Lower Highs trend-line at the time, it spend 2 weeks consolidating on it before the November 05 U.S. election result started a relentless 7 week rally just below the 2.0 Fibonacci extension.
Note that on both fractals, the Lower Highs break-out and then re-test, took place on the 0.786 Fibonacci retracement level. If BTC manages to close above it at all times, we will have a strong case to expect again a Bullish extension as last December. The symmetrical level just below the 2.0 Fib ext in today's terms is $155000.
Do you think that will be next after a short-term consolidation? Feel free to let us know in the comments section below!
-------------------------------------------------------------------------------
** Please LIKE 👍, FOLLOW ✅, SHARE 🙌 and COMMENT ✍ if you enjoy this idea! Also share your ideas and charts in the comments section below! This is best way to keep it relevant, support us, keep the content here free and allow the idea to reach as many people as possible. **
-------------------------------------------------------------------------------
💸💸💸💸💸💸
👇 👇 👇 👇 👇 👇

#BTC/USDT Bullish Crossover in Play!CRYPTOCAP:BTC Update: Bitcoin is currently holding support and showing signs of strength with a bullish EMA crossover — the 50 EMA crossing above the 100 EMA, which historically signals upward momentum based on past fractals.
The lower support zone is marked in blue, in case the price dips further.
Immediate resistance remains at the GETTEX:98K level — a confirmed close above this could trigger a move toward $103K.
Stay tuned for more real-time updates.
Do hit the like button if you like it, and share your views in the comments section.
Thank you
BITCOIN about to test its ATH following HUGE U.S. - China deal!Bitcoin (BTCUSD) is marching towards the $109000 Resistance, which is its All Time High (ATH), following the U.S. - China trade agreement 3 hours ago. This can be a huge fundamental boost to the bullish trend as technically, every time the Resistance level broke during this Bull Cycle, the break-out that followed was extremely aggressive.
On October 2 2023, the Resistance test resulted into a strong break-out, which completed a +96.18% rise from the bottom before a 1D MA100 (green trend-line) pull-back. At the same time of the Resistance break-out, we had a 1D MA50/100 Bullish Cross and a 1W MACD Bullish Cross.
The October 29 2024 Resistance test on the other hand was initially unsuccessful and made a 5 day rejection back near the 1D MA50 (blue trend-line) before the next successful test. Again the rise was more than +96.18%.
As a result, we are expecting to see at least $145k by July (+96.18%) once the Resistance breaks.
Do you think that is a realistic time-frame for $145000? Feel free to let us know in the comments section below!
-------------------------------------------------------------------------------
** Please LIKE 👍, FOLLOW ✅, SHARE 🙌 and COMMENT ✍ if you enjoy this idea! Also share your ideas and charts in the comments section below! This is best way to keep it relevant, support us, keep the content here free and allow the idea to reach as many people as possible. **
-------------------------------------------------------------------------------
💸💸💸💸💸💸
👇 👇 👇 👇 👇 👇

Strategic Analysis of Bitcoin for Next WeekRecently, Bitcoin has broken through the $100,000 mark, and its market dominance has risen to over 60%. Investors are highly bullish. Such a positive market sentiment is likely to attract more investors to enter the market, further driving up the price. 👉👉👉
In the short term, the price of Bitcoin has continuously broken through multiple key technical resistance levels. For example, on May 8th, it broke through the psychological barrier of $100,000, demonstrating strong bullish momentum. The market dominance has risen to over 60%, and investors are highly bullish. Such a positive market sentiment is likely to attract more investors to enter the market, further driving up the price.
BTCUSD Trading Strategy
buy @ 103500-103200
sl 101000
tp 104300-104600
If you approve of my analysis, you can give it a thumbs-up as support. If you have different opinions, you can leave your thoughts in the comments.Thank you!👉👉👉

BTC/USD) Resistance level pullback Read The ChaptianSMC Trading point update
Technical analysis of Bitcoin (BTCUSDT), highlighting key levels and potential price movements based on trend channels, support/resistance, and RSI. Here's the breakdown:
---
Key Elements in the Analysis:
1. Trend Channel:
BTC is trading within an ascending channel, indicating an ongoing bullish trend.
The recent price action hit the upper boundary (resistance) of the channel, suggesting potential for a pullback.
2. Resistance Zone:
105,586.06 is marked as a resistance level, where price faced rejection.
Strong reaction here suggests sellers are defending this area.
3. Support Zone:
A new support level is established around 98,000.
This zone aligns with the lower boundary of the ascending channel and previous breakout structure.
4. Target Point (Bearish Projection):
The chart projects a potential drop to the 97,367.51 level, representing a ~7.4% correction.
This move mirrors the prior leg up, applying a measured move concept.
5. RSI Indicator:
RSI is around 66–71, indicating overbought conditions.
A bearish divergence or trendline break on RSI suggests weakening momentum.
Mr SMC Trading point
---
Summary of Trading Idea:
Bias: Short-term Bearish (correction within an overall bullish trend)
Expected Move: Potential dip toward 97,367.51 support
Confirmation: Rejection at resistance, RSI divergence, and trendline break
Invalidation: A strong breakout above 105,586.06 would nullify the correction setup and favor continued bullish movement
pelas support boost 🚀 analysis follow)

(BTC/USD) 1H Trade Setup – Key Entry, Stop Loss & Dual TargetEntry Point: 95,431
Stop Loss: 95,264
Target Points:
Upside (Target 1): 100,674 (Potential gain: +5.36%)
Downside (Target 2): 86,614 (Potential loss: -7.57%)
Trade Setup:
Risk-Reward Ratio:
Approx. 1:0.7 (Not ideal; the reward is smaller than the potential loss)
Support Zones:
Highlighted in purple beneath the entry zone — this indicates a historically strong support area.
Resistance Zones:
The upper purple zone marks the next significant resistance around 100,000–100,795.
Technical Indicators:
50 EMA (Blue Line): Indicates mid-term trend support, currently holding price action.
Price Action: BTC appears to be retracing toward support after a bullish rally.
Interpretation:
The setup implies a long (buy) position with a very tight stop loss.
The price is nearing a support zone, and if it holds, there's potential for an upward move to the target at 100,674.
However, if price breaks below 95,264, a sharp drop to 86,614 is anticipated.

BTCUSDT: Safe Zone Vs Risk Zone, Which one would you choose? Dear Traders,
WE have possible buying opportunities, with the first entry, the only reason that we think that price would reverse is, possible end of year bullish push which may take price to another record higher high. Although, since the price already has rejected we think price is unlikely to reject at the level, and may drop to 75k region.
good luck.

BITCOIN Monthly RSI Heatmap reveals ultimate Cycle Sell Zone!Bitcoin (BTCUSD) has resumed the long-term bullish trend and as of the writing of this analysis, it is about to test the $100k key psychological level. Now that the Bull Cycle is entering its final stage (most likely for the next 6 months at most), it is time to see potential exit levels as close to the expected Top as possible.
There is no better long-term indicator to assist us on this than the 1M RSI, which historically offers a great level to Sell when it enters the 0.786 - 1.0 Fibonacci range of its Channel Down. Currently it is still considerably distanced from that Zone, so the upside potential despite the recent break-out, is huge.
The Sine Waves indicate that in symmetrical terms, the Cycle Top should be priced around November 2025 (previous ones on November 2021, December 2017, December 2013). The closer the 1M RSI is to this date when it enters the 0.786 - 1.0 Fib Zone, the better as the higher the price will most likely be.
Based on this Cycle's Channel Up (blue), a fair Cycle Top range would be $150k - $200k. Would you agree? Feel free to let us know in the comments section below!
-------------------------------------------------------------------------------
** Please LIKE 👍, FOLLOW ✅, SHARE 🙌 and COMMENT ✍ if you enjoy this idea! Also share your ideas and charts in the comments section below! This is best way to keep it relevant, support us, keep the content here free and allow the idea to reach as many people as possible. **
-------------------------------------------------------------------------------
💸💸💸💸💸💸
👇 👇 👇 👇 👇 👇

BITCOIN Mirror fractal from the past calls for massive rally!Bitcoin (BTCUSD) appears to be repeating almost the exact same price action as mid-late 2020 as it has broken above the Pivot trend-line that separates the recent distribution from the 2nd Accumulation phase and has successfully re-tested it while the MA50 (blue trend-line) is holding as Support.
If the latter continues to hold, then it might fuel a massive rally similar to October 2020 - April 2021. As you can see both fractals started of with a 1st Accumulation Phase (blue Rectangle) being supported always by their respective MA200 (orange trend-line), which led to the eventual Distribution Phase (red Arc). Even their RSI sequences are identical.
Is this another pattern supporting that BTC will reach at least $150k next? Feel free to let us know in the comments section below!
-------------------------------------------------------------------------------
** Please LIKE 👍, FOLLOW ✅, SHARE 🙌 and COMMENT ✍ if you enjoy this idea! Also share your ideas and charts in the comments section below! This is best way to keep it relevant, support us, keep the content here free and allow the idea to reach as many people as possible. **
-------------------------------------------------------------------------------
💸💸💸💸💸💸
👇 👇 👇 👇 👇 👇

Bitcoin is likely to rise after its declineFrom the perspective of historical trends and technical indicators, when the short-term moving averages show a bullish arrangement, it is usually a relatively strong signal. However, the previously mentioned signs of a bearish divergence in the MACD indicator imply the risk of a pullback. If Bitcoin can break through the recent resistance level, such as $95,000, it may trigger a new round of upward trend. Conversely, if it fails to break through and the selling pressure continues to increase, there may be a certain degree of decline.👉👉👉
From the demand side, although the inflow of ETF funds is still lower than the level in 2024, the apparent demand has turned positive since the end of February, indicating a certain purchasing power. If this kind of demand continues to grow, it will provide support for the price of Bitcoin. On the supply side, the total amount of Bitcoin is fixed, and the increase in mining difficulty has slowed down the growth rate of new currency supply, which is conducive to price stability or increase to a certain extent.
BTCUSD Trading Strategy
buy @ 93500-9370
sl 925000
tp 94800-95000
If you approve of my analysis, you can give it a thumbs-up as support. If you have different opinions, you can leave your thoughts in the comments.Thank you!👉👉👉

BITCOIN Climbing the Fibonacci Staircase..Bitcoin (BTCUSD) has come into the Fed Rate Decision week stronger that ever, having staged an impressive rebound from the early-April Low. The consolidation of the last few days is of course a market reaction in anticipation of the big interest rate news.
Regardless of that, the Channel Up that is the underlying pattern from the start of this Bull Cycle has been filling on an impressive symmetrical scale all .382 Fibonacci extensions one by one. The most recent has been the 4.382 and naturally the next in line is the 5.382 Fibonacci extension.
Since the last one (4.382) was almost hit before the price pull-back, it would be more fitting to assume the next peak slightly below the 5.382 Fib ext as well as $170000.
This may very well be the final High i.e. the Cycle's Top before the next Bear Cycle begins, depending on the time it hits it.
Do you think that would be the case? Feel free to let us know in the comments section below!
-------------------------------------------------------------------------------
** Please LIKE 👍, FOLLOW ✅, SHARE 🙌 and COMMENT ✍ if you enjoy this idea! Also share your ideas and charts in the comments section below! This is best way to keep it relevant, support us, keep the content here free and allow the idea to reach as many people as possible. **
-------------------------------------------------------------------------------
💸💸💸💸💸💸
👇 👇 👇 👇 👇 👇

BTCUSD short-term view.It is a good opportunity to sell BTCUSD in real time. Short-term is based on the right side of the swing trading, with a target of 93000-92500. In addition, the uncertainty of the news on BTCUSD. It is a good time to sell now.

BTCUSD Daily Trend Analysis from May 05, 2025Based on my analysis, BTCUSD is likely to experience a bearish trend over the next four trading days. A sell signal has been confirmed, with a stop-loss set at 97,939. Key support levels to watch are 83,974 and 80,491 — the latter becoming relevant only if the price breaks and closes below 83,974.
Please note: this is a personal market outlook and not a trading recommendation. Traders should rely on real-time technical analysis and implement appropriate risk management practices before making any trading decisions.

BITCOIN 1st 1W MACD Bullish Cross in 7 months!Bitcoin (BTCUSD) is ahead of completing this week a Bullish Cross on its 1W MACD, which will be the first one after 7 months (since October 14 2024).
This is a major technical bullish development as since the very first one (Sep 26 2022) right before the November 21 2022 Bear Cycle bottom, it has always kick-started the Bullish Legs of this 2.5-year Channel Up.
In addition to that, this was accompanied by an Ichimoku Bullish Cross, where the Conversion Line (green) crossed above the Base Line (black). Considering also that exactly 4 weeks ago BTC found Support and rebounded on the 1W MA50 (blue trend-line), we can safely confirm a Bottom there and call for the minimum +100.73% rise, similar to the first Bullish Leg of this Channel Up. We remain consistent to our $150000 Target.
So do you think this 1W MACD Bullish Cross is the final confirmation we need for the new Bullish Leg? Feel free to let us know in the comments section below!
-------------------------------------------------------------------------------
** Please LIKE 👍, FOLLOW ✅, SHARE 🙌 and COMMENT ✍ if you enjoy this idea! Also share your ideas and charts in the comments section below! This is best way to keep it relevant, support us, keep the content here free and allow the idea to reach as many people as possible. **
-------------------------------------------------------------------------------
💸💸💸💸💸💸
👇 👇 👇 👇 👇 👇

Sell@97500, TP 96000 - 95000 - 94000🎉 Yesterday, I accurately predicted that the price of BTC would break through 97,000! 🚀 Now, a pullback is on the horizon ⬇️. Keep an eye on the support level at 93,000! 👀
⚡⚡⚡ BTCUSD ⚡⚡⚡
🚀 Sell@97500
🚀 TP 96000 - 95000 - 94000
Accurate signals are updated every day 📈 If you encounter any problems during trading, these signals can serve as your reliable guide 🧭 Feel free to refer to them! I sincerely hope they'll be of great help to you 🌟

Summary of the Bitcoin Market This WeekThis week, the Bitcoin market showed a trend of steady increase and broke through the key resistance level.👉👉👉
Technically, the MACD indicator on the daily chart shows a strong bullish signal, and the price has also held above the key moving average, confirming the short - to medium - term upward trend. Overall, market sentiment is relatively optimistic, and investors' expectations for it to break through the psychological barrier of $100,000 have increased. However, when Bitcoin approaches the $98,000 level, it may form a short - term resistance, and as the price gets closer to the $100,000 mark, the overly optimistic market sentiment also increases the risk of a pullback.
The better than expected performance of the US job market has alleviated recession concerns, boosted the sentiment of risky assets, and provided support for Bitcoin. Meanwhile, the signs of easing in US - China trade relations have had a positive impact on the global financial markets, including the cryptocurrency market.
This week, the Bitcoin market has performed strongly driven by various factors. Both on-chain data and market indicators have shown positive signals. However, during the process of price increase, it's also necessary to pay attention to the potential risk of a pullback.

The decisive day of major data (BTCUSD)Yesterday, it was mentioned that the expectation of continuing to buy after a retracement of 96k was completely correct. Followers also made good profits.
BTCUSD bulls are still strong. The retracement is mainly long trading, which needs to be paid attention to at present. 96k/95k are both good buying opportunities.
TP98K-100K

Can BTCUSD continue to be purchased? The answer is definitely.Can BTCUSD continue to be purchased? The answer is definitely.
The current trend is a rebound trend after a volatile decline. The space for a short-term increase of 1,500 points is very simple. The target position is 94,700-95,200. Friends who like to do short-term swing trading can follow.

BITCOIN is filling all gaps as it should.Bitcoin (BTCUSD) is having its strongest 1D green candle since April 22 (for now) and basically today's analysis is a continuation/ modification of our April 14 buy call (see chart below):
Our Target was $99500 but we now update it to $106000 as we see a different pattern through filling the Lower Highs gaps. As you can see, since BTC's April 07 bottom, the rebound has filled one Lower High of the downtrend after the other.
At the same time, it has posted identical rallies before consolidating, the 1st one +15.37% and the 2nd +15.11%. We are currently on the 3d and if it makes again +15.11%, then it gets us to $106.9k. That is marginally above the Lower High of January 30, practically the first Lower High after the January 20 All Time High (ATH).
Moreover, the 2.0 Fibonacci extension level is at $106k and this is why we've moved our short-term Target there. This fills all dynamic conditions of this uptrend.
Do you think that's a fair estimate? Feel free to let us know in the comments section below!
-------------------------------------------------------------------------------
** Please LIKE 👍, FOLLOW ✅, SHARE 🙌 and COMMENT ✍ if you enjoy this idea! Also share your ideas and charts in the comments section below! This is best way to keep it relevant, support us, keep the content here free and allow the idea to reach as many people as possible. **
-------------------------------------------------------------------------------
💸💸💸💸💸💸
👇 👇 👇 👇 👇 👇

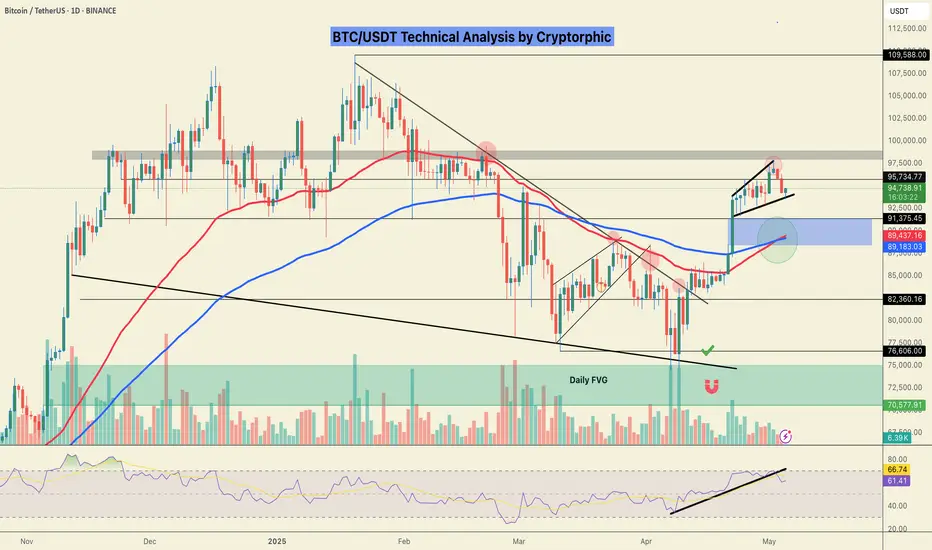
BITCOIN (BTCUSD): Strong Bullish Signs?! ₿
Bitcoin has probably completed the accumulation
stage after a completion of a strong bullish wave a week ago.
I see a breakout of a resistance line of a symmetrical triangle
on a daily time frame.
It is an important sign of strength of the buyers.
The price may continue going up now and reach 98.180 level.
❤️Please, support my work with like, thank you!❤️

Bitcoin Repeating 2022 Structure? Same Setup, Same Outcome?Bitcoin’s current market structure is starting to mirror its 2022 setup—right before the big drop.
This chart shows a familiar pattern: a rally, a peak, first drop from the ATH, a bull trap… then the major second leg down.
If history repeats, CRYPTOCAP:BTC could be on the verge of another significant move.
Will it break the cycle this time—or follow the same path again?
📉 What do you think?
Share your take in the comments below.
Please support this idea with a LIKE👍 if you find it useful🥳
Happy Trading💰🥳🤗
