BTCUSD: Test the resistance zone of 89,000 - 90,000BTC is in a phase of sideways consolidation following a rebound. Its price fluctuates within the trading range of 88,000 - 89,000. Although the bulls still possess upward momentum, the obvious resistance lies ahead. Meanwhile, the market sentiment has been gradually recovering from the previous panic, and the overall market is in a pattern where both bulls and bears are conducting cautious tentative moves.
After stabilizing around the 85,000 level earlier this week, the asset has launched a three - consecutive - day rebound, with a relatively solid support level in place.
Focus on the short - term resistance zone of 89,000 - 90,000 ahead. If this zone is broken through, the price may surge towards the range of 92,000 - 94,000.
Buy 85500 - 86000
SL 85000
TP 87000 - 88000
Sell 89000 - 89500
SL 90500
TP 86000 - 85000
Btcusdsignals

BITCOIN The Bear Cycle's High Volatility period has just begun..Bitcoin (BTCUSD) closed last week brutally below its 2W MA20 (red trend-line) and has started this week off with the first signs of a potential rebound. We explained on previous analyses the dynamics of the 1W MA50 bearish closing as well as the rebound potential on the 1W MA100 but today are looking at what this 2W MA20 bearish closing means.
First of all, observe for a moment the remarkable symmetry between the 2W MA20 bearish closings across all Bear Cycles. The date range between the March 31 2014 and March 26 2018 2W MA20 closings was 104 candles (1456 days), March 26 2018 and December 06 2021 was 97 candles (1351 days) and December 06 2021 and today's November 10 2025 was again 103 candles (1435 days).
As you can see on two of those three occasions, BTC initially rebounded above the 2W MA20 again but then got rejected back below and consolidated while turning the 2W MA20 into its main Resistance for the rest of the Bear Cycle. In 2022 it just fell below it and consolidated for 4 months before getting violently rejected to new Lows.
As a result, given also the amazing symmetry of the 2W RSI sequence among those fractals, we still expect the market to potentially deliver the first counter-trend rally (limited) of the Bear Cycle, namely 'Santa's Rally' but then get strongly rejected below the 2W MA20 again.
We call this the start of the 'Bear Cycle's High Volatility Period' and needless to say, it is the phase where due to the aggressive ups and downs in range, most traders/ investors can potentially get trapped. Following Bitcoin's 4-year Cycle Theory (and our 2020 Golden ratio) has historically never let us down and until invalidated will continue to be the way to go for us.
So do you think BTC is entering a brutal High Volatility period? Feel free to let us know in the comments section below!
P.S. For reference take a look at our legendary 2020 Golden 51%-49% Ratio, viewed 400k times on TradingView and its 2024 update to see how well macro Cycles work at timing (entries and exits on) the market:
---
** Please LIKE 👍, FOLLOW ✅, SHARE 🙌 and COMMENT ✍ if you enjoy this idea! Also share your ideas and charts in the comments section below! This is best way to keep it relevant, support us, keep the content here free and allow the idea to reach as many people as possible. **
---
💸💸💸💸💸💸
👇 👇 👇 👇 👇 👇

BTC’s 85k-87k Range: 80k Risk or 100k Rebound Next WeekBTC plummeted to around 80,000 last Black Friday, now ranging between 85,000 and 87,000. A breakdown below 85,000 risks breaching the 80,000 support; holding above confirms a rebound, with a potential retest of 100,000 next week
Sell 88000 - 87500
TP 86500 - 86000 - 85000
Accurate signals updated daily. They serve as a reliable guide for trading issues – feel free to refer to them. Hope they help!

BTC/USD/ Bullish. Trend Read The captionSMC Trading point update
Technical analysis of summary of this BTC/USDT H1 chart:
---
Overall Bias: Bullish Short-Term
The chart shows a bullish continuation structure after mitigation of the Fair Value Gap (FVG) and support from EMAs.
---
Key Technical Points
Price retested and respected the FVG zone
Located around 85,300 – 86,000 area, acting as demand.
Price above EMA 50 (blue) and approaching EMA 200 (black)
→ Indicates building bullish momentum and potential trend reversal if EMA 200 breaks.
Structure
Higher lows forming
Price breaking minor structure highs
Strong bullish impulse candles
Target Zone Target highlighted near 90,000 – 90,100
---
Trade Idea Concept
Entry Idea:
Look for retracement back into the FVG/EMA zone for continuation long (mitigation + breakout strategy).
TP Target:
90,000 – 90,100 resistance and liquidity level
Invalidation / Stop:
Clean break below 85,300 demand zone would negate the bullish setup.
---
Smart Money Concept Perspective
FVG used as institutional demand
Liquidity grab below previous lows during correction phase
Targeting premium pricing near EMA 200 and liquidity pool
Mr SMC Trading point
---
Summary
BTC is showing strength and continuation potential. As long as price stays above 85,300–86,000 zone, the path of least resistance is upward toward 90,000.
---
Please support boost 🚀 this analysis

ElDoradoFx – BTCUSD ANALYSIS (22/11/2025, WEEKEND)1. Market Overview
BTCUSD continues in a strong downtrend from the 113k top, now trading around 84,000 after a sharp selloff. Price is sitting near the lower side of the descending channel and just above the key support band 83,500–83,400, with momentum still bearish but short-term showing signs of exhaustion / potential corrective bounce.
⸻
2. Technical Breakdown
🕐 Daily (D1)
• Clear bearish structure: consecutive lower highs and lower lows from ~113k.
• Price trades well below 20/50/100/200 EMAs, confirming dominant downtrend.
• Current D1 candle sitting near the prior “Sweep” zone around 83–81k.
• RSI oversold (~22–25) and MACD deeply red → trend strong but stretched; space for corrective rally before next leg down.
🕐 H1
• Price moving inside a falling channel, last swing low near 81–82k, last swing high around 88–89k.
• EMAs (20/50) below 200 EMA, slightly flattening → trend still down, momentum slowing.
• Small BOS to the upside from the last swing low, but still capped under H1 supply 84.8–85.7k.
• MACD shows bullish divergence vs the recent low → supports idea of pullback toward Fib zone before possible continuation.
🕐 15M–5M
• Intraday price is ranging 83.7–84.3k, forming minor higher lows.
• MACD positive, RSI hovering around 50 → short-term neutral / corrective phase.
• Still trading inside H1 downtrend and below intraday supply 84.8–85.2k.
⸻
3. Fibonacci Analysis
Last clear swing on H1:
• Swing High ≈ 88,700
• Swing Low ≈ 81,300
Fibonacci retracement (bearish pullback):
• 38.2% ≈ 84,120
• 50.0% ≈ 84,990
• 61.8% ≈ 85,870
🎯 Fibonacci Golden Zone: 84,100 – 85,900
This aligns with H1 supply and descending trendline → high-interest sell zone for continuation.
⸻
4. High-Probability Trade Scenarios
📉 A. Trend SELL from Golden Zone (Main Setup)
• Sell Zone: 84,500 – 85,500 (Fib 0.5–0.618 + H1 supply / trendline)
• Initial Targets:
• TP1: 83,500
• TP2: 82,500
• TP3: 81,000
• Extended: 80,600 (prior strong low)
• Stop Loss: Above 86,200
• Confirmation:
• Rejection candle / bearish engulfing in zone
• RSI H1 staying below 55 and MACD crossing back bearish.
• Idea: Primary play is to sell the corrective rally back into the golden zone in line with the dominant downtrend.
⸻
💥 B. Breakout SELL Setup (Continuation)
• Break Sell Trigger (Breaking Price):
• Clean H1 close below 83,450
• Retest Sell Zone: 83,450 – 83,800
• Targets:
• TP1: 82,500
• TP2: 81,000
• TP3: 80,600
• Stop Loss: Above 84,300
• Note: Use if price fails to reach the golden zone and instead breaks the current base directly.
⸻
📈 C. Countertrend BUY from Support (Scalp / Secondary)
• Buy Zone: 83,500 – 83,400 (top of strong support / range low)
• Targets:
• TP1: 84,500
• TP2: 85,500
• TP3: 86,800 (toward top of golden zone / trendline)
• Stop Loss: Below 82,800
• Confirmation:
• Bullish divergence on 15M/5M
• Strong wick rejection from 83.4–83.5k.
• ⚠️ Countertrend only – use reduced risk; objective is to catch corrective leg back into the golden zone.
⸻
🚀 D. Breakout BUY Setup (Structure Shift)
• Break Buy Trigger (Breaking Price):
• H1 close above 85,800 (clear break of Fib 0.618 + channel / supply)
• Retest Buy Zone: 85,800 – 86,000
• Targets:
• TP1: 87,500
• TP2: 89,500
• TP3: 91,300
• Stop Loss: Below 85,000
• Idea: This would be an early trend-change signal; only valid if volume and momentum (RSI > 60 on H1) confirm the break.
⸻
5. Fundamental Watch
• Weekend conditions → thin liquidity & gap risk between Sunday open and Monday session.
• BTC remains highly sensitive to US macro data and risk sentiment (equities, DXY, yields). Any upcoming high-impact USD events next week (CPI, PCE, Fed speakers, etc.) can accelerate either continuation or reversal.
• For swing positions, plan size so you can hold across potential gaps, or close before the weekend if uncomfortable with risk.
⸻
6. Key Technical Levels
• Resistance:
• 84,800
• 85,500–85,900 (Golden Zone upper)
• 87,500
• 90,000
• Support:
• 83,450
• 82,500
• 81,000
• 80,600 (major prior low)
• Golden Zone (Short): 84,100 – 85,900
• Break Buy Trigger: > 85,800 (H1 close)
• Break Sell Trigger: < 83,450 (H1 close)
⸻
7. Analyst Summary
• Structure from D1 to H1 is decisively bearish.
• Current consolidation around 84k looks like a pause within the downtrend, not yet a confirmed bottom.
• The highest-probability play remains selling rallies into the Fib Golden Zone (84.5–85.5k), aiming for new lows towards 82.5–81k → 80.6k.
• Countertrend buys are possible off 83.5–83.4k, but only for quick scalps with tight risk.
⸻
8. Final Bias Summary
• Bearish Bias (Primary):
• Valid while price stays below 85.7–86k.
• Prefer Sell Golden Zone and Breakout Sell < 83,450 setups.
• Bullish Bias (Alternative / Reversal):
• Consider only if H1 closes above 85,800 and retest holds.
• Then target 87.5k → 89.5k → 91.3k with higher-timeframe confirmation.
Manage risk: fixed % per trade, no over-leveraging, and be careful holding full size over the weekend gaps. 🚨
⸻
🥇 ElDoradoFx PREMIUM 3.0 – PERFORMANCE 21/11/2025 🥇
🔥 Precision • Momentum • Profit
━━━━━━━━━━━━━━━
📊 XAU/USD – DAILY RESULTS
🟢 BUY +50 PIPS
🔻 SELL +20 PIPS
🟢 BUY +210 PIPS
🟢 BUY +210 PIPS
🟢 BUY +20 PIPS
❌ SELL -40 PIPS (SL)
🟢 BUY +220 PIPS
🔻 SELL LIMIT +210 PIPS
━━━━━━━━━━━━━━━
🔝 SWING TRADES – STILL RUNNING
📈 BUY → +2,850 PIPS
📈 BUY → +1,320 PIPS
━━━━━━━━━━━━━━━
💰 TOTAL PIPS GAIN: +900 PIPS
🎯 8 Signals → 7 Wins (1 SL)
🔥 Win Accuracy: 88%
━━━━━━━━━━━━━━━
Strong close to the week — perfect blend of scalps, intraday setups, and powerful swing continuation!
Congrats if you profited — PREMIUM 3.0 keeps delivering results! 🚀💰
— ElDoradoFx PREMIUM 3.0 Team 🚀

BITCOIN Is the first Bear Cycle RALLY approaching?Bitcoin (BTCUSD) has been on a brutal (but technically anticipated) correction ever since its October 06 All Time High (ATH), registering 6 red candles out of last 7. We have shown in previous analyses why the Bear Cycle has technically started, how the market lost the 1W MA50 (blue trend-line) and is now about to touch the 1W MA100 (green trend-line).
This is the time where we may see a counter-trend rally, the first within this Bear Cycle. First of all, BTC has just completed a total decline of -32.30%, exactly like the January - April 2025 correction and identical to the -33.55% March - August 2024 correction. This is why we project the 86600 - 83600 range as the first technical Support Zone of this Bear Cycle and potential rebound candidate. In the meantime, the 1W RSI is approaching the 30.00 oversold barrier, which further enhances the probabilities for a relief rally.
If materialized, it can technically rise even as high as the 0.618 Fibonacci retracement level, where it may make contact with the 1D MA100 (red trend-line), even above the 1W MA50. The 1D MA200 has been the counter-trend rally rejection trendline and Resistance of the previous two Bear Cycles. Coupled with the 0.618 Fib, it forms a formidable market Resistance Zone.
This rally may coincide with a final stock market rally, what is traditionally called 'the Santa Rally', which is the end-of-year rise on the markets. Technically that can be the perfect Bull Trap that rejects the rebound and resumes the bearish trend towards Lower Lows and eventually the 1W MA200 (orange trend-line).
So do you think we are finally about to see the first rally of this Bear Cycle? Feel free to let us know in the comments section below!
---
** Please LIKE 👍, FOLLOW ✅, SHARE 🙌 and COMMENT ✍ if you enjoy this idea! Also share your ideas and charts in the comments section below! This is best way to keep it relevant, support us, keep the content here free and allow the idea to reach as many people as possible. **
---
💸💸💸💸💸💸
👇 👇 👇 👇 👇 👇

BTC: Bottoming ConsolidationBTCUSD is staging a weak rebound from the lows and oscillating around the $90,000 mark today. Overall, it has yet to break free from the recent sharp correction trend. Meanwhile, technical indicators are showing oversold rebound signals, while pressures from the macroeconomic and capital sides are significantly restricting the upside potential.
Currently, the 90,000 level serves as a key battleground. Having acted as a crucial support level after the previous breakdown, this level has now become a critical psychological resistance during the ongoing rebound. The immediate resistance zone at 93,500 remains effective, with a further resistance level at 95,000. On the downside, the key support lies at 89,000. A break below this level will most likely trigger a new round of sell-offs, subsequently testing the support range between 80,000 and 85,000.
In the short term, BTCUSD is likely to continue its sideways consolidation to build a bottom. If it can hold firm at the 90,000 level and the macro environment eases—such as the Federal Reserve issuing dovish signals or the resumption of capital inflows into Bitcoin ETFs—the price is expected to rebound to the range of 95,000 - 100,000. However, if a black swan event like the Federal Reserve adopting a more hawkish stance occurs, the price may breach the 88,000 support level and slide further to test the 75,000 - 80,000 range.
Sell 93000 - 93500
SL 94000
TP 90000 - 89500 - 89000
Buy 89000 - 89500
SL 88000
TP 92000 - 92500 - 93000

Weak Recovery for BTCUSDBTC showed a trend of weak oscillatory recovery after hitting a low today. The price found support after breaking below the critical level of 90,000; however, the market remained in an extreme state of panic, which restricted the overall strength of the rebound.
From a technical perspective, the 85,000 - 90,000 range serves as a strong support zone, corresponding to the Fibonacci 0.618 retracement level. The price has demonstrated support near 89,000 today. On the flip side, the key resistance is concentrated in the 93,500 - 94,200 range. A breakout above this range may lead the price to test 95,000 subsequently, and if it can breach 95,000, it is expected to further move towards and challenge the 96,000 - 96,700 range.
Sell 93,500 - 94,000
SL 94,500
TP 92,000 - 91,500 - 91,000
Buy 89,500 - 90,000
SL 88,500
TP 92,500 - 93,000 - 93,500

BTCUSD - 3months : Is a 50% Correction toward 50K on the table?Bitcoin faces a potential three-month corrective phase after tapping 91K. Untested liquidity below 70K and 60K keeps the downside open, making a deeper move toward the 45K demand zone increasingly likely.

BITCOIN Is all hope lost for the Bull Cycle?First of all allow me to begin by saying this: IT IS NEVER FUN to call market tops. Especially on long-term charts, especially on Bitcoin/ crypto. And the reason is that, usually it violently traps most people in. Either for a long time or until they lose all capital. And nobody should take joy in this and as chief analyst here at Tradingshot, I am no exception.
Regardless of that, our thesis here has been pretty simple and for a long time we've been calling for an October exit, as that was when the 4-year Cycle Theory suggested the Bull Cycle would top. I personally hope I am wrong but in all my decades of investing, I learned that 'hope' doesn't get you far here, quite the contrary it teaches you brutal (and often very expensive lessons). The hard facts and historical evidence, point to a new Bear Cycle. And we will keep presenting the charts, the empirical evidence no matter how many followers we lose or how many negative comments we see as they mean nothing to us. Profit making only does.
Now that I got this out of the way, let's see what other key levels Bitcoin (BTCUSD) hit. Yesterday's aggressive decline saw the market making a Low marginally below the Higher Lows trend-line (bottom) of the 3-year Channel Up. Essentially that has been the dominant pattern of the whole Bull Cycle. BTC already closed below its 1W MA50 (blue trend-line) last week, which has historically been a Bear Cycle confirmation, already lost the basic structure of its Bull Cycle rallies by breaking way below the 0.382 Fibonacci retracement level from the previous Higher Low and now faces with the complete breakdown of the pattern - crossing below its bottom.
Needless to say, if BTC closes the week below it, selling could accelerate, with the 1W MA100 (green trend-line), being the market's next long-term Support, where a counter-trend bounce could be possible.
So is this Higher Lows trend-line the last hope of the Bull Cycle? Feel free to let us know in the comments section below!
---
** Please LIKE 👍, FOLLOW ✅, SHARE 🙌 and COMMENT ✍ if you enjoy this idea! Also share your ideas and charts in the comments section below! This is best way to keep it relevant, support us, keep the content here free and allow the idea to reach as many people as possible. **
---
💸💸💸💸💸💸
👇 👇 👇 👇 👇 👇

BitcoinBTCUSD
- Fair Value Gap
- Change of Characteristics
- Order Block
- Rising Wedge as an corrective pattern in Long Time Frame
- Demand Zone

Crypto Market Alert: New York Session Breakdown Asset: Bitcoin (BTC/USD)
Strategy: Quantum Pulse AI (Fibonacci Focus)
Session: New York Open
Date: November 18, 2025
🧠 Executive Summary
The Quantum Pulse AI algorithm has triggered a BUY signal for Bitcoin during the New York session. Despite neutral readings on traditional lagging indicators (MACD and RSI), our proprietary model is detecting an imminent volatility expansion. The price action suggests a "coiled spring" consolidation phase, often a precursor to a sharp breakout.
Current sentiment is reacting to shifting risk parameters in the broader market, positioning BTC as a high-beta asset for the session.
🎯 The Trade Setup
We are looking for a continuation of the bullish structure, targeting liquidity above the recent consolidation range.
Direction: 🟢 BUY (Long)
Entry Price: $92,332.82
Take Profit: $94,553.09
Stop Loss: $90,852.64
Risk Analysis
Risk per Unit: ~$1,480.18
Reward per Unit: ~$2,220.27
Risk-to-Reward Ratio: 1:1.5
Insight: For every $1.00 risked, the trade targets $1.50 in profit. This is a solid, probability-based setup suitable for intraday volatility.
📊 Technical Deep Dive
Why "Neutral" Indicators Matter Here
You might notice the standard indicators are flat:
RSI (14): 50.0 (Dead Neutral)
MACD: 0.0 (Flatline)
Analysis: In the Quantum Pulse strategy, a "flatline" on the MACD combined with an RSI of 50 is not a sign of inactivity—it is a sign of equilibrium. The market has priced in recent moves and is awaiting a catalyst. The "Pulse" algorithm detects that order flow is building up pressure at the pivot points (support/resistance), suggesting that the next move will likely be explosive rather than gradual.
Key Levels
Resistance: The target of $94,553 aligns closely with the recent weekly high structure. A break above here opens the door to $95k+.
Support: The stop loss at $90,852 is placed strategically below the daily pivot area to prevent a "whipsaw" stop-out.
🌍 Fundamental Context
The analysis flags "Heightened Volatility" driven by risk sentiment shifts.
As traditional markets (S&P 500, Nasdaq) open in New York, liquidity flows often spill over into crypto. The trade rationale anticipates that risk-on sentiment will favor Bitcoin as a hedge against currency debasement or simply as a momentum vehicle for the day.
🛡️ Trade Management Plan
Entry: Execute at market or limit at $92,332.
Mid-Trade Adjustment: If price reaches $93,500 (approx. 50% to target), consider moving Stop Loss to Breakeven ($92,332) to secure a "risk-free" trade.
Exit: Hard exit at $94,553. Do not hold through the session close if the target is not met, as swap fees and Asian session volatility may alter the landscape.
Disclaimer: This analysis relies on algorithmic projection and fallback strategies (Fibonacci Retracement). Cryptocurrency trading involves extreme volatility. Never trade with capital you cannot afford to lose.

BTC Short-Term Weakness PersistsBTC continued to decline last week, not only breaking below key support levels but also erasing all its year-to-date gains. Affected by multiple factors including capital outflows, macroeconomic conditions and technical trends, the short-term market remains in a bear-dominated weak pattern.
Today, Bitcoin opened near the bottom and staged a slight rebound, but the technical picture still shows a clear bearish dominance with downward momentum not yet fully exhausted. The previous key support level of 94,000 has been breached, and the next support lies around 92,800. If this level is broken, the price may fall further. On the upside, short-term resistance is concentrated in the 98,000-100,000 range, and a breakthrough in the short term is highly challenging.
Sell 96,000 - 97,000
SL 98,000
TP 94,000 - 94,500
Buy 92,800 - 93,500
SL 92,000
TP 94,500 - 95,000

BITCOIN The 1W MA50 Bear confirmation you didnt want, happened..Bitcoin (BTCUSD) just closed last week below its 1W MA50 (blue trend-line) for the first time since March 06 2023. Since that break-out, the 1W MA50 had been tested and held on 3 major occasions within the Bull Cycle, providing the most optimal mid-Cycle entries during those 2.5 years.
What's even more important than this time distance, is the fact that every 1W candle closing below the 1W MA50 has always marked/ confirmed the start of the new Bear Cycle historically. This is something that we've presented to you and discussed numerous times this year, as we were analyzing BTC's 4-year Cycle theory and why October was the most likely Cycle Top candidate time-wise.
This time we are looking at the previous Cycle more specifically, due to the strong similarities so far leading to the current Top. First of all the end-of-Cycle rallies on both started after a clear test and rebound on the 1W MA50. At the same time, the both displayed Higher Highs, against the 1W RSI's Lower Highs, which is a huge Bearish Divergence and the first strong indication that the Cycle Top may be forming.
The Cycle Top on both came when the 1W RSIs were 70.00. Also the 1W MA50 break-out took place around the 0.382 Fibonacci level from the last test/ rebound. As you may realize, there is a high degree of symmetry here both price-wise and in terms of RSI. If that continues, we can expect the Bear Cycle bottom to be at least on the 1.618 Fibonacci extension at $55000.
So do you think that the closing below the 1W MA50 has confirmed the new Bear Cycle? Feel free to let us know in the comments section below!
---
** Please LIKE 👍, FOLLOW ✅, SHARE 🙌 and COMMENT ✍ if you enjoy this idea! Also share your ideas and charts in the comments section below! This is best way to keep it relevant, support us, keep the content here free and allow the idea to reach as many people as possible. **
---
💸💸💸💸💸💸
👇 👇 👇 👇 👇 👇

BTC to break 110000 after support testBTC is set to rally back to around 100000, followed by another sharp pullback.
Focus on the support at 91000 – a break below this level will trigger a further drop to around 87500, where strong support is expected.
It will then stage a rebound and break above 110000 to resume the uptrend
Accurate signals updated daily. They serve as a reliable guide for trading issues – feel free to refer to them. Hope they help!

BTC Extends Weak Volatile DeclineBTC witnessed a slight decline with certain price fluctuations today, continuing its recent correction trend. This price drop is a continuation of the ongoing downward trajectory.
Bitcoin had already recorded a significant fall on November 14th. Prior to that, Bitcoin ETFs saw a massive net outflow of approximately 870 million US dollars on November 13th, marking the second-largest single-day withdrawal since the launch of such funds.
Coupled with the market's reevaluation of expectations for the Federal Reserve's interest rate cuts, this has exerted sustained pressure on high-risk assets like Bitcoin, consequently leading to the continuation of the correction trend for Bitcoin's price today.
Today, BTC maintained a weak volatile downward pattern. In the short term, it is constrained by factors such as ETF capital outflows and adjustments to macroeconomic expectations. For the subsequent trend, close attention should be paid to the stability of the support level around 94,000, as well as the shifts in institutional capital flows and marginal changes in macro market sentiment.

ElDoradoFx – BTCUSD WEEKEND ANALYSIS (15/11/2025)1️⃣ Market Overview
BTC ends the week around 95,700, continuing its strong bearish structure after the previous breakdown below 98,000. Price remains trapped inside a clear descending channel, forming consistent lower highs and lower lows on all timeframes.
The market attempted a recovery but was rejected again at 95,900–96,200, confirming ongoing seller control. Volume remains low heading into the weekend, increasing the risk of liquidity sweeps.
Bias remains bearish while BTC trades below 96,800.
⸻
2️⃣ Technical Breakdown
🔹 Daily (D1)
• Market remains in a sustained downtrend.
• Price rejected from the daily 20EMA and 50EMA zone.
• MACD continues deep in red, no bullish crossover yet.
• RSI ≈ 32–40 → still bearish, pointing toward deeper downside liquidity.
D1 Structure:
Lower high → lower low → continuation towards 94,000 and 93,000 liquidity.
⸻
🔹 H1 (1H)
• Bearish order flow intact.
• Every bullish pullback has been rejected at the 20/50EMA cluster.
• Trendline resistance near 96,200 holds perfectly.
• BOS confirmed to the downside at 95,600.
H1 Bias:
Bearish continuation unless a 1H close above 96,200–96,600.
⸻
🔹 15M–5M (Intraday)
• Micro pullbacks forming lower highs around 95,900.
• Supply zone between 95,900–96,150 producing multiple rejections.
• MACD shows short-lived bullish pushes with no follow-through.
• RSI capped under 50.
Intraday Bias:
Sell pullbacks into supply; avoid buying unless bullish confirmation appears.
⸻
3️⃣ Fibonacci Analysis (Last Swing)
Swing High → 96,800
Swing Low → 94,000
• 38.2% = 95,450
• 50.0% = 95,400
• 61.8% = 95,950
🎯 Golden Zone (Key Rejection Area): 95,400 – 95,950
This zone has already produced strong bearish reactions → high-probability sell zone.
⸻
4️⃣ High-Probability Trade Scenarios
📉 SELL SETUP (Primary Bias – HIGH PROBABILITY)
Sell Zone: 95,400 – 95,950 (Golden Zone)
Entry: Wait for rejection candle or bearish engulfing.
🎯 Targets:
• TP1: 94,800
• TP2: 94,000
• TP3: 93,200 (liquidity zone)
• TP4: 92,500
🛑 Stop Loss: Above 96,250
Why?
Golden Zone retest + downtrend + EMA alignment + channel resistance.
⸻
📉 Breakout Sell Setup (Continuation)
Trigger: Break & close below 94,800
Retest: 94,900–95,050
🎯 Targets:
• 94,000
• 93,200
• 92,500
🛑 Stop Loss: Above 95,400
⸻
📈 BUY SETUP (Countertrend – Lower Probability)
Buy Zone: 94,000 – 93,200
🎯 Targets:
• 95,000
• 95,800
• 96,200
🛑 Stop Loss: Below 92,800
⚠️ Note: Structure remains bearish → buy setups require bullish divergence.
⸻
5️⃣ Fundamental Watch
• Weekend liquidity low → expect stop hunts and fakeouts.
• No major news until early next week (US retail, FOMC speakers).
• DXY remains strong → pressures BTC further.
• Risk markets soft overall → crypto remains vulnerable.
⸻
6️⃣ Key Technical Levels
🔺 Resistance:
• 95,950
• 96,200
• 96,800 (bullish breakout level)
• 97,500
🔻 Support:
• 94,800
• 94,000
• 93,200
• 92,500 (liquidity + structure)
🌟 Golden Zone:
95,400 – 95,950
Breakout Triggers:
• Bullish Breakout: Above 96,800
• Bearish Breakout: Below 94,800
⸻
7️⃣ Analyst Summary
BTC maintains a strong bearish structure across all timeframes. Every bounce is corrective, and sellers remain dominant below 96,800.
The market is gravitating toward 94,000 and possibly 93,200 liquidity.
Best trade:
Sell the Golden Zone 95,400–95,950
or
Sell the breakdown 94,800.
Buying only makes sense at 94,000–93,200 with strong confirmation.
⸻
8️⃣ Final Bias Summary
Overall Bias: Bearish
• Below 96,800 → Sell rallies (preferred).
• Below 94,800 → Continuation to downside.
• Above 96,800 → Bullish shift begins.
⸻
🥇 ElDoradoFx PREMIUM 3.0 – PERFORMANCE 14/11/2025 🥇
📅 High-volatility day with mixed conditions, but strong recoveries and powerful live-session results.
━━━━━━━━━━━━━━━
🪙 XAU/USD (GOLD) Trades
❌ BUY –60 PIPS (SL)
🟢 BUY +110 PIPS
🟢 BUY LIMIT +60 PIPS
🟢 SELL +110 PIPS
❌ BUY –70 PIPS (SL)
🟢 BUY +110 PIPS
---
🎥 LIVE TRADING SESSION
🟡 BUY – BE
🟢 SELL +250 PIPS
❌ BUY –40 PIPS (SL)
🟢 BUY +60 PIPS
🟡 SELL – BE
🟢 SELL +180 PIPS
---
📈 SWING POSITION (From 05/11)
🟩 Floating: +2,850 PIPS
Still running strong.
━━━━━━━━━━━━━━━
💰 TOTAL PIPS GAIN: +710 PIPS
━━━━━━━━━━━━━━━
📊 12 Signals → 7 Wins | 3 SL | 2 BE
🎯 Accuracy: 70%
━━━━━━━━━━━━━━━
🔥 Another profitable day locked in.
👏 Congratulations if you profited!
✅✅✅🚀🚀🚀
— ElDoradoFx PREMIUM 3.0 Team 💼📈

BITCOIN on a 6-month Low! Bear Cycle starting based on GOLDBTC?Bitcoin (BTCUSD) hit $96000 today for the first time in 6 months (since May 07). For a long time we presented evidence (spearheaded by the 4-year Cycle) of why October was a strong candidate for a market top and so far this continuous correction validates all the data.
Today we circle back to an old favorite of ours, the GOLDBTC ratio. During the previous Bull Cycle, a Double Bottom on that ratio was what confirmed the start of BTC's 2022 Bear Cycle. On the current Cycle, we had this Double Bottom in August and since then, the GOLDBTC ratio has been rising.
Even on previous Cycles, a rise on this ratio always coincided with a BTC Bear Cycle. Based on that evidence too, the next Bitcoin Bear Cycle should be over before 2026 ends.
As a side-note for investors, keep in mind that a rise on the GOLDBTC ratio doesn't necessarily mean that Gold will rise while only Bitcoin falls. Both can fall at the same time, the ratio highlights pace, it just indicates that Gold can also decline in value but less aggressively than Bitcoin.
So are we in a Bitcoin Bear Cycle? Feel free to let us know in the comments section below!
---
** Please LIKE 👍, FOLLOW ✅, SHARE 🙌 and COMMENT ✍ if you enjoy this idea! Also share your ideas and charts in the comments section below! This is best way to keep it relevant, support us, keep the content here free and allow the idea to reach as many people as possible. **
---
💸💸💸💸💸💸
👇 👇 👇 👇 👇 👇

BTCUSD: Sharp DropBTCUSD showed a sharp decline today, breaking below the key psychological level of 100,000, with violent intraday volatility. Both technical and capital flows indicate a bearish bias. After opening, the price did not continue the previous consolidation trend; although there were brief signs of stabilization in the morning, it subsequently entered a downward trajectory.
The 100,000 level had been a crucial psychological support for the market. After breaking below this level today, the price further dropped to 95,853 and failed to rebound quickly to reclaim the lost ground. Combined with the 4-hour technical structure where BTC has been in a descending channel, the persistent downward pressure from the 20-period and 60-period moving averages remains unresolved. Following this breach of key support, there may be further downside pressure ahead.
Going forward, focus on the support strength around 95,000. A breakdown below this level could trigger a new round of selling; if it stabilizes here, a short-term technical rebound may occur, but the overall weak pattern is unlikely to reverse easily in the near term.
Trading Strategy:
Buy 95,000 - 95,500
SL 94,500
TP 98,000 - 99,000 - 100,000
Sell 99,500 - 100,000
SL 100,500
TP 98,000 - 97,000 - 96,000

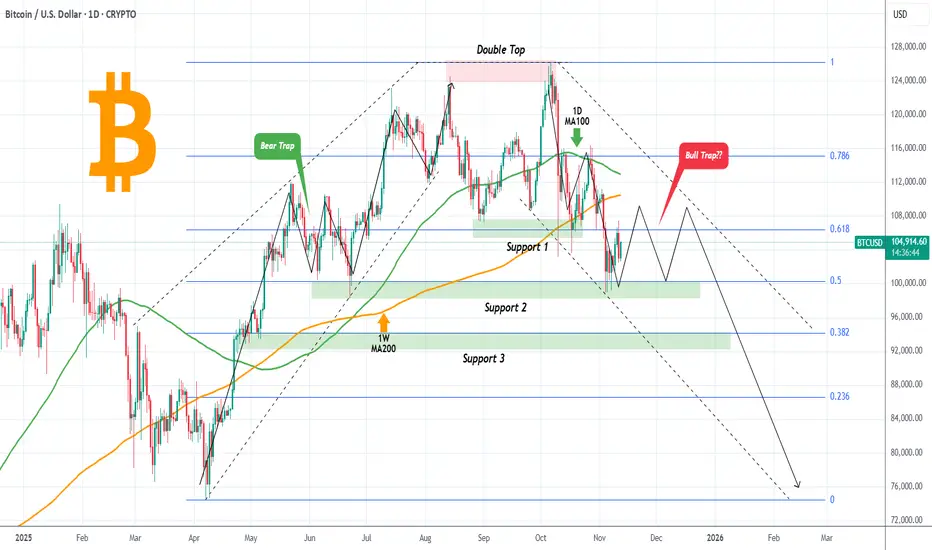
BITCOIN Is it following a symmetric downtrend?Bitcoin (BTCUSD) recently broke below the $100000 level for the first time since June and is currently on a short rebound. It has turned however all major MAs both the 1D MA100 (green trend-line) and 1D MA200 (orange trend-line) into Resistances, so the downtrend remains.
By doing so, we can see a highly symmetric pattern emerging, the inverse of the April - August uptrend. Following the (nearly) October 06 Double Top, the symmetrical downtrend has been testing and respecting all subsequent Support levels (so far Support 1 and 2), filling at the same time all Fibonacci gaps. See how accurately those Fibs formed key demand levels during the uptrend.
As a result, if this symmetry continues to hold, we can expect BTC to trade sideways for another month between Support 2 (Fib 0.5) and $110000 (roughly) before making the next leg down. Such price behavior typically confuses market participants and traps traders who stick to the former trend and haven't adapted yet.
Will it happen this time also and this potential ranged trading trap more buyers? Feel free to let us know in the comments section below!
---
** Please LIKE 👍, FOLLOW ✅, SHARE 🙌 and COMMENT ✍ if you enjoy this idea! Also share your ideas and charts in the comments section below! This is best way to keep it relevant, support us, keep the content here free and allow the idea to reach as many people as possible. **
---
💸💸💸💸💸💸
👇 👇 👇 👇 👇 👇
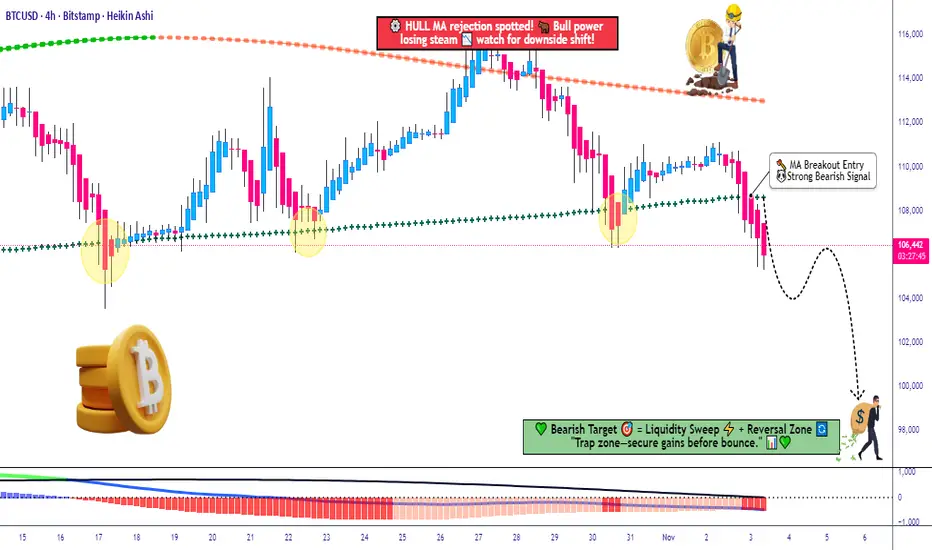
BTC/USD Breakdown Alert — MA Cross & MACD Flash Warning!💰 BTC/USD — “BITCOIN vs U.S. DOLLAR” | Crypto Market Capital Flow Blueprint (Swing Trade)
🧭 Market Overview
The king of crypto 👑, Bitcoin, is showing signs of fatigue at the top. After a solid bull sprint, we’re spotting bearish confirmation on multiple signals — a clean moving average breakout and a MACD divergence to the downside.
Looks like the market’s whispering, “It’s time for a cool-down, mate.” 😏
🎯 Trade Plan (Swing Setup)
Plan: ✅ Bearish plan confirmed — waiting for continuation pressure below structure zones.
Entry Strategy (Thief Layer Method 🕵️♂️):
Using layered limit sell orders — a signature “Thief Strategy” style of scaling in with patience, precision, and a bit of chaos theory.
Sell Limit Layers: 110,000 💸 → 108,000 💸 → 106,000 💸
(You can expand the layer grid as per your risk model.)
Stop Loss: 112,000 — positioned above the previous Higher High (HH) structure.
📝 Note: Dear Ladies & Gentlemen (Thief OG’s), I’m not recommending you to stick to my SL. Manage risk your way — you make money, you take money. 💼
Target: 98,000 — based on strong support, oversold confluence, and a potential liquidity trap zone below.
📝 Note: Same rule — take profits where it makes sense for you. The trap is the escape; don’t overstay the party. 🎭
🔍 Technical Confluence Highlights
📉 MA Breakout: Bears gaining control after crossover rejection.
📊 MACD Divergence: Weak momentum confirmed — watch histogram fade.
Structure Check: Market respecting descending trendline — sellers defending upper zone.
🧩 Momentum Flow: Smart money possibly rotating out of BTC into defensive assets.
🌍 Correlated Pairs to Watch
Keep an eye on these related assets for directional cues and correlation strength:
BITSTAMP:ETHUSD (Ethereum) — often mirrors BTC’s moves with higher beta.
TVC:DXY (U.S. Dollar Index) — rising DXY can pressure BTC.
PEPPERSTONE:NAS100 (NASDAQ 100) — tech sentiment affects BTC risk appetite.
CRYPTOCAP:BTC.D (Bitcoin Dominance) — watch if altcoins start outperforming.
✨ “If you find value in my analysis, a 👍 and 🚀 boost is much appreciated — it helps me share more setups with the community!”
#BTCUSD #Bitcoin #CryptoMarket #SwingTrade #TechnicalAnalysis #ThiefStrategy #BearishSetup #CryptoTrading #MarketFlow #LayeredEntries #SmartMoney #TradingView #EditorPickCandidate #BTCAnalysis
BTC/USD Bullish Pennant – Breakout Entry Setup✅ BTC/USD Pennant Breakout – Technical Analysis
Chart Breakdown
The chart shows Bitcoin forming a bullish pennant pattern on the 45-min timeframe.
A pennant typically forms after a strong impulsive move (pole), followed by price compression between:
Descending trendline (upper)
Ascending/flat trendline (lower)
This usually signals continuation in the direction of the previous trend, which in this case is upward.
Key Levels
Entry Zone: Just above the pennant resistance (breakout zone).
Stop-Loss: Below the pennant support — good risk management.
Target: Projected by measuring the previous impulse (the pennant pole) and extending it upward.
Market Signals
✔ Price is squeezing near the apex — breakout imminent.
✔ Buyers appear to be defending the lower trendline.
✔ If price breaks and closes above resistance, upside continuation becomes likely.
✘ But if price rejects and falls below support, the setup invalidates.
Bias
Bullish Continuation – If breakout occurs with strong volume.
✅ Title Suggestion
“BTC/USD Bullish Pennant – Breakout Setup Forming”

BITCOIN Did the 1W MA50 just save the day again?Bitcoin (BTCUSD) just closed last week above its 1W MA50 (blue trend-line) even though it broke below it during the day.
Since the March 13 2023 break-out above the 1W MA50, this is the 4th time that BTC breaks below it but manages to close the 1W candle above it. All of those times (including the additional one of September 11 2023), marked market bottoms, Higher Lows for the 3-year Channel Up and initiated the Bull Cycle's strong rallies.
However every rally has been weaker and since the first one topped in March 2024, we have a huger Bearish Divergence on the 1W RSI of Lower Highs against BTC's Higher Highs, showcasing loss of strength for the trend. A natural feat however, as the Bull Cycle tends to be stronger on its start as it rebounds violently from the market bottom and less strong towards the end as it matures and big positions already start to take profits.
But is this the end of the Cycle? The 4-year Cycle Theory, the DXY bottoming, the 1W RSI Bearish Divergence among others, all say 'yes'. But the Bear Cycle can only be technically confirmed when the market closes that 1W candle below its 1W MA50 and so far it hasn't. Is that enough to rely your strategy on from this point onwards?
So has the 1W MA50 just saved the day again for Bitcoin? Feel free to let us know in the comments section below!
-------------------------------------------------------------------------------
** Please LIKE 👍, FOLLOW ✅, SHARE 🙌 and COMMENT ✍ if you enjoy this idea! Also share your ideas and charts in the comments section below! This is best way to keep it relevant, support us, keep the content here free and allow the idea to reach as many people as possible. **
-------------------------------------------------------------------------------
💸💸💸💸💸💸
👇 👇 👇 👇 👇 👇
