BITCOIN This is the last Resistance standing.Bitcoin (BTCUSD) got rejected (and is currently pulling back) on the Higher Highs trend-line that started on July 14. This is technically the last Resistance before a complete technical bullish break-out that will take the market to a new pattern out of this 3-month consolidation phase.
Until that happens, there are high probabilities to extend this pull-back all the way to the 0.382 Fibonacci extension ($119.5k), which is the minimum level that all similar corrections within these 3 months pulled back to.
As you can see such similar corrections have all been on 4H RSI Bearish Divergences, which have been Lower Highs against BTC's Higher Highs, typical indicator of a Top.
So what do you think will happen next, pull-back or break-out? Feel free to let us know in the comments section below!
-------------------------------------------------------------------------------
** Please LIKE 👍, FOLLOW ✅, SHARE 🙌 and COMMENT ✍ if you enjoy this idea! Also share your ideas and charts in the comments section below! This is best way to keep it relevant, support us, keep the content here free and allow the idea to reach as many people as possible. **
-------------------------------------------------------------------------------
💸💸💸💸💸💸
👇 👇 👇 👇 👇 👇
Btcusdsignals

BITCOIN 125k broke (new ATH) and it's not stopping there!Bitcoin (BTCUSD) hit $125700 yesterday, making a new All Time High (ATH), closing the 2nd strongest 1W candle of the year. This is a confirmed detachment from the Former Resistance-turned-Support trend-line, following a double bottom bounce on the Bull Cycle's (Higher Lows) Buy Zone.
As you can see, this structure is similar to the first green zone bounce in August 2023 that eventually rose to its 2.0 Fibonacci extension before turning sideways for a while. Even the December 16 2024 High was on the 2.0 Fibonacci extension, even though the formation that preceded it (March - October 2024), wasn't that much similar to the other two.
Based on that, we can see BTC approaching $160000 (Fib 2.0 ext).
Do you expect the market to hit that level? Feel free to let us know in the comments section below!
-------------------------------------------------------------------------------
** Please LIKE 👍, FOLLOW ✅, SHARE 🙌 and COMMENT ✍ if you enjoy this idea! Also share your ideas and charts in the comments section below! This is best way to keep it relevant, support us, keep the content here free and allow the idea to reach as many people as possible. **
-------------------------------------------------------------------------------
💸💸💸💸💸💸
👇 👇 👇 👇 👇 👇

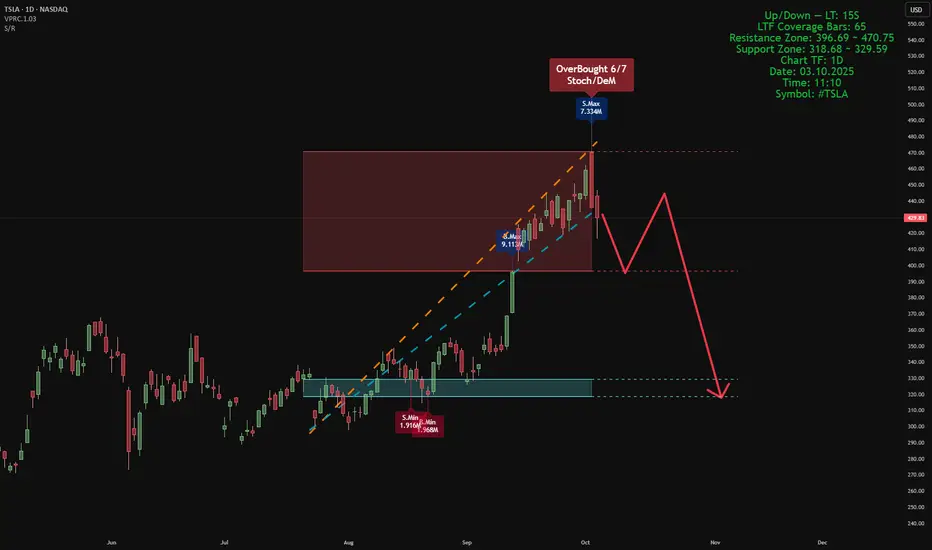
Smart Money Support/Resistance + ATAI Volume Analysis —PracticalApplication
When these two indicators work together — Smart Money Support/Resistance (Lite) and ATAI Volume Analysis with Price Action — the chart begins to speak a clearer language: one defines where the reaction zones form, and the other explains what happens inside them. The purpose is not prediction but understanding the balance between smart money pressure and retail momentum.
1. Parameter Alignment
On the right side of the chart, the green info panel confirms that both indicators share identical configurations. In this example, the lookback period is set to 52, chosen deliberately because it must be smaller than the total number of LTF coverage bars (65). For the Smart Money Support/Resistance indicator, the projection is set to 26 — extending the detected zones forward without adding excessive visual noise. This alignment is crucial; mismatched parameters can desynchronize volume readings and structural boundaries.
2. Reading the Chart
In this sample chart, the upper red area represents a Smart Money resistance zone — a region of concentrated selling pressure detected from lower timeframe volume. Simultaneously, ATAI Volume Analysis signals an Overbought (6/7) condition, meaning multiple oscillators confirm exhaustion while seller volume (S.Max) begins to outweigh buyer volume (B.Min). This overlap suggests that liquidity has shifted and the prior bullish impulse is weakening. From here, price may consolidate within the zone or initiate a structured retracement toward the blue support area, previously defined by accumulation volume. The red projected path simply visualizes one potential structural scenario; it is not a prediction or trade signal.
3. Broader Context
This example serves only as a demonstration of how these two tools interact when properly tuned. Different assets and timeframes naturally yield unique structures and behaviors, yet the principle remains consistent: define the territory first with Smart Money Support/Resistance, then interpret market behavior within it using ATAI Volume Analysis.
This content is for educational purposes only — not financial advice. User feedback and practical observations play a key role in refining future versions of both indicators.
Bitcoin Swing Trade Setup – Institutional Inflows Fuel Bulls🎭 BTC/USD – Money Heist Plan 🚀 (Swing + Scalping Strategy)
📊 BTC/USD Real-Time Market Data
Current Price: $111,156.01
24h Change: +$2,117.61 (+1.94%)
Day’s Range: $108,540.93 – $111,180.45
52-Week Range: $49,538.00 – $123,640.00
😰 Fear & Greed Index
Score: 49/100 → Neutral 😊
Trend: Shifted from “Fear” to “Neutral” in the last 24 hours.
🧠 Investor Sentiment Outlook
Retail Traders: Cautious (63% worry about crypto safety).
Institutional Traders: Bullish (💵 $3.7B net inflows in August).
🌍 Fundamental & Macro Score
Policy Uncertainty: High (U.S. tariffs, Fed policy shifts).
Fed Rate Cut Probability: High (expected September cut).
Key Event: Non-Farm Payrolls (Sept 5; forecast 45K jobs).
Gold Rally: $3,508/oz (+30% YTD, strong hedging demand).
🐂 Market Outlook
Short-Term: Neutral → Slightly Bearish (September volatility ahead).
Long-Term: Bullish (Institutional inflows + macro liquidity).
Bull/Bear Score: 55% Bullish vs 45% Bearish.
🎯 Thief’s Trading Plan (Layered Entry Strategy)
I’m setting up multiple limit orders (“Thief Layers”) instead of going all-in — this spreads risk, builds better entries, and keeps flexibility.
Entry (Layered Buys):
$109,000 → $109,500 → $110,000 → $110,500
(Add more layers as per your own strategy)
Stop Loss (Thief SL):
$107,500 (Adjust for your own risk appetite)
Target Zone (Profit Extraction):
$116,000 (Checkpoint before major resistance zone)
💡 Key Takeaways
BTC rebounded +1.94% but faces headwinds from whale profit-taking & policy risks.
Neutral sentiment (49/100) reflects a balanced investor mood.
Friday’s NFP jobs data could shape Fed rate expectations → big volatility catalyst.
🔍 Related Pairs to Watch
BITSTAMP:ETHUSD | COINBASE:SOLUSD | BITSTAMP:XRPUSD | BINANCE:BTCUSDT | CRYPTOCAP:BTC.D
#BTCUSD #Bitcoin #CryptoTrading #SwingTrade #Scalping #TradingStrategy #LayeredEntries #CryptoCommunity
✨ “If you find value in my analysis, a 👍 and 🚀 boost is much appreciated — it helps me share more setups with the community!”

ElDoradoFx PREMIUM 2.0 – Weekend Bonus BTCUSD Analysis 04/10/25
BTC is trading around 122,280, consolidating after an explosive rally of over +11,000 pips from the 110,600 demand zone. After a strong bullish impulse, momentum is slowing as price hovers near short-term resistance.
⸻
🔍 Technical Outlook
Daily (1D):
BTC printed a massive bullish breakout from the descending channel, rallying from 110,600 to 123,800 before facing rejection at 123,900 — a previous structural high and psychological resistance.
• MACD: strong bullish momentum but starting to flatten, suggesting exhaustion.
• RSI: near 70, indicating overbought conditions.
• Parabolic SAR: still below price (bullish bias intact).
→ The daily structure remains bullish, but pullbacks are likely before continuation.
Intraday (1H):
Price is forming a short-term range between 121,950–122,900.
• The 200 EMA (white) is below price at 120,800, confirming ongoing bullish structure.
• However, MACD histogram shows decreasing buying volume and potential cross to the downside → early sign of correction.
• RSI hovering around 55–60, neutral zone → consolidation after high volatility.
Short-Term (15M / 5M):
BTC is showing lower highs while holding the 122,150–122,250 zone, building a potential bull flag.
• On the 15M chart, a small descending channel connects the highs at 122,790 → 122,460 → 122,300.
• 5M chart shows repeated liquidity sweeps below 122,180, followed by immediate rebounds → strong short-term demand.
Fibonacci Golden Zone (from swing low 120,779 → swing high 123,887):
Golden zone = 122,000–122,300 — BTC is trading exactly inside it now, offering a high-probability reload area for buyers if defended successfully.
⸻
📈 High-Probability Entry Zones (Max 60 pips SL)
🎯 Buy Setup (Fibonacci Golden Zone Support):
• Entry: 122,000–122,200
• SL: 121,900 (below structure)
• TP1: 122,600
• TP2: 122,900–123,000
• TP3 (extended): 123,800 (previous high)
→ Confluence: Fib Golden Zone + short-term EMA support + strong RSI defense.
🎯 Sell Setup (Short-Term Resistance Rejection):
• Entry: 122,850–123,000
• SL: 123,100
• TP1: 122,450
• TP2: 122,100
→ Only valid if price fails to hold above 122,850, confirmed by bearish candle structure on 15M.
⸻
📌 Breakout Levels to Continue Trend
• Bullish Continuation: Above 123,000–123,200 → momentum could extend into 123,900–124,400.
• Bearish Continuation: Below 121,900 → opens correction toward 121,200–120,800 (EMA + liquidity pool).
⸻
📅 Fundamental Watch (Weekend)
• No major events until Monday.
• Weekend liquidity is extremely thin, expect sharp stop hunts and sudden wicks.
• CME futures closed at 122,350 → small gap risk on Sunday open.
• Market sentiment remains cautiously bullish after strong week for risk assets.
⸻
⚠ Key Technical Zones
Resistance:
• 122,850 → 123,000 → 123,900 (major)
Support:
• 122,000 → 121,900 → 120,800
⸻
✅ Summary
BTCUSD is consolidating inside the Fibonacci golden zone (122,000–122,300) after a massive breakout week. The bias remains bullish while above 121,900, but momentum is slowing. Scalpers can buy dips within the golden zone for short-term 200–600 pip reactions. A clean breakout above 123,000 confirms bullish continuation, while a break below 121,900 triggers a correction toward 120,800.
— ElDoradoFx PREMIUM 2.0 Team

BITCOIN HIGH PROBABILITY SETUP SOON!!!🚨 BTCUSD HIGH PROBABILITY SELL SETUP 🚨
* Here We Can See Clearly The Next Potential Moves For BTC Coming Hours/Days.
* Keep Your Eyes Close On Your Trading Positions.
* Happy PIP Hunting Traders.
FXKILLA.

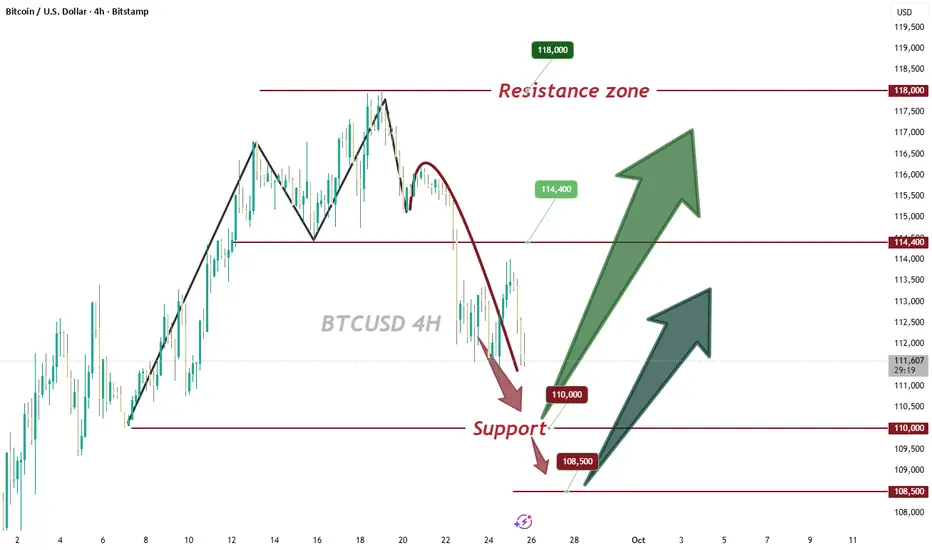
BTC/USD – Short Setup from Resistance Zone (Oct 2025 Analysis)Trend & Channel
The price has been moving inside an ascending parallel channel (highlighted in pink).
Current price is $122,395, approaching the upper boundary of the channel, where resistance typically appears.
Key Levels
Entry Point: Around $124,257 – suggested short-entry zone.
Support/Resistance Zone (Blue Box): Between $128,000 – $130,442. This is where rejection is expected.
Stop Loss: Above $132,000 – just outside the resistance zone to protect against a breakout.
Target Point: $104,097 – near the lower boundary of the channel, aligning with prior support levels.
Price Action Setup
The chart suggests a short trade setup (sell) if BTC/USD hits the $124K–$130K zone.
Expectation: After touching this resistance area, price could reverse downward toward the $104K target.
Risk-to-Reward Ratio
Risk: About $8,000 (132K - 124K).
Reward: About $20,000 (124K - 104K).
Approximate R:R = 2.5 : 1, which is favorable for a swing trade.
✅ Summary:
This is a bearish short-term outlook for BTC/USD. The strategy is to wait for price to reach the 128K–130K resistance zone, enter a short position, keep a stop loss above 132K, and aim for a target around 104K

BITCOIN (BTCUSD): Road to ATH
Bitcoin violated a major resistance cluster and closed above that
on a daily time frame, yesterday.
The next strong resistance is based on a current all-time high.
123200 level will be the next goal for the buyers after a pullback.
❤️Please, support my work with like, thank you!❤️
I am part of Trade Nation's Influencer program and receive a monthly fee for using their TradingView charts in my analysis.

BITCOIN Are we going to see 'UPTOBER' this time??Bitcoin (BTCUSD) has historically seen incredible rallies during the month of October and even more so those Octobers of the last years of Bull Cycles, like the one we are at now. Those rally phases have been very accurately called 'Uptober' rallies.
More specifically, the last three such Octobers (2021, 2017 and 2013) have been massively bullish, all starting after September corrections (Channel Down patterns). In 2013, October reached the 2.382 Fibonacci extension from September's correction, in 2017 and 2021 it reached the 1.786 Fibonacci ext.
As a result, if 'Uptober' is repeated again, this historic price actions gives us an optimistic Target at $132k (Fib 2.382) and a less optimistic one at $125.5k (Fib 1.786).
Do you think we will get such Uptober one more time? Feel free to let us know in the comments section below!
-------------------------------------------------------------------------------
** Please LIKE 👍, FOLLOW ✅, SHARE 🙌 and COMMENT ✍ if you enjoy this idea! Also share your ideas and charts in the comments section below! This is best way to keep it relevant, support us, keep the content here free and allow the idea to reach as many people as possible. **
-------------------------------------------------------------------------------
💸💸💸💸💸💸
👇 👇 👇 👇 👇 👇

BITCOIN making a bullish break-out similar to July'sBitcoin (BTCUSD) just broke above the Lower Highs trend-line of its August 14 All Time High (ATH). This was implemented after a bottom on the 5-month Higher Lows trend-line as well as the 1D RSI Support.
The last time all those conditions were fulfilled was on the July 02 Lower Highs break-out, after which BTC completed a +25.33% rally from the Low, almost touching its 1.786 Fibonacci extension.
Ahead of another 4H Golden Cross, just like then, we expect Bitcoin to make another +25.33% Bullish Leg and reach at least $136000 on the medium-term.
Do you think that's reasonable to expect within October? Feel free to let us know in the comments section below!
-------------------------------------------------------------------------------
** Please LIKE 👍, FOLLOW ✅, SHARE 🙌 and COMMENT ✍ if you enjoy this idea! Also share your ideas and charts in the comments section below! This is best way to keep it relevant, support us, keep the content here free and allow the idea to reach as many people as possible. **
-------------------------------------------------------------------------------
💸💸💸💸💸💸
👇 👇 👇 👇 👇 👇

Watching For Bullish Continuation Towards Supply ZoneThe current market structure on the 15-minute chart shows a potential shift in momentum, with price attempting to break above a key resistance zone after forming a support base. If bullish momentum persists and price successfully breaks and holds above this resistance area, we could see a continuation of the upward move. The next key level to watch is the supply zone above, which aligns with a previously formed weak high. This zone may act as a magnet for price, drawing it in as buyers aim to fill the imbalance left behind during the previous sell-off. A confirmed breakout above resistance would validate a bullish bias in the short term, with the potential for price to rally toward the upper supply zone, where we may see reactions or a possible reversal depending on market sentiment.

BTC/USD) Bullish trend analysis Read The captionSMC trading point update
Technical analysis of BTC/USDT (4H timeframe) chart analysis:
---
Bullish Bitcoin Setup
Trendline Breakout: Price has broken above the descending trendline, signaling a shift from bearish to bullish momentum.
Order Block (OB): Price retraced into the order block (yellow zone) around 112,200 – 113,000, showing demand holding strong.
Moving Averages:
50 EMA (red) has crossed above the OB zone.
200 EMA (blue) is acting as dynamic support, strengthening the bullish case.
Price Action: After retesting the OB/EMA confluence, price is expected to continue higher.
---
Target Point
119,953 (≈120,000 psychological level) is the upside target.
This aligns with the next major resistance and the projected extension of the bullish breakout.
Mr SMC Trading point
---
Trading Idea
Bias: Bullish.
Entry Zone: Retest of 112,500 – 113,000 (OB + EMA support).
Target: 119,953.
Invalidation: A breakdown below 112,000 would weaken the bullish scenario and suggest continuation of the downtrend.
Please support boost 🚀 this analysis

BITCOIN Did the 1W MA20 just save the day??On one of our recent analyses we talked about the importance of the 1W MA20 (red trend-line) for Bitcoin (BTCUSD) and the continuation of its non-stop bullish trend since the April 07 2025 Low.
As mentioned then, BTC was likely to extend the trend as long as the 1W candles keep closing above the 1W MA20. The three times a candle didn't, since June 2023, the price declined more to hit (or come very close to) the 1W MA50 (blue trend-line).
Last week was again a successful 1W candle close above the 1W MA50, third time in a month (since August 25) to do so. Technically that solidifies it as a Support and as long as it holds, Bitcoin has more probabilities to repeat at least a +96.38% rally ('weakest' rally it had on this Bull Cycle) and test $145000.
So do you think the 1W MA50 just saved the day and a new rally is ahead of us? Feel free to let us know in the comments section below!
-------------------------------------------------------------------------------
** Please LIKE 👍, FOLLOW ✅, SHARE 🙌 and COMMENT ✍ if you enjoy this idea! Also share your ideas and charts in the comments section below! This is best way to keep it relevant, support us, keep the content here free and allow the idea to reach as many people as possible. **
-------------------------------------------------------------------------------
💸💸💸💸💸💸
👇 👇 👇 👇 👇 👇

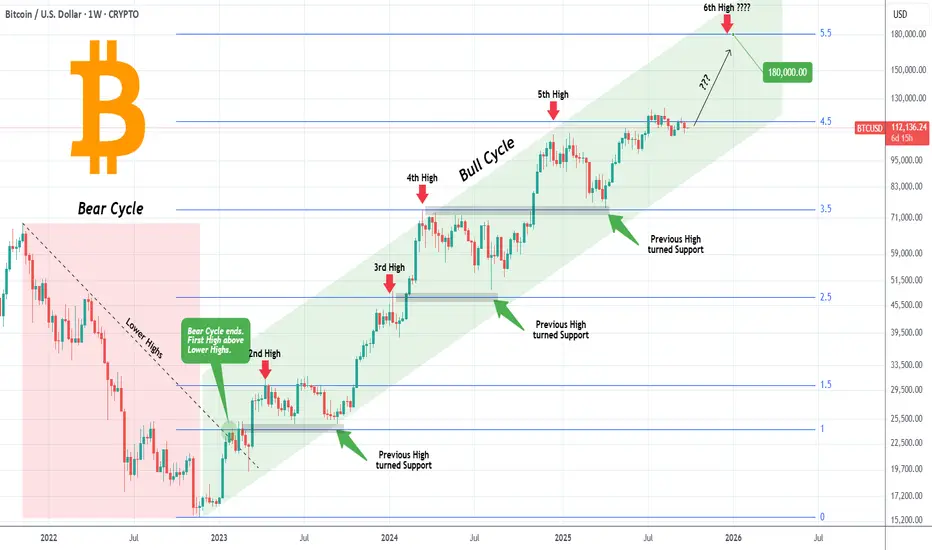
BITCOIN Is there time left for one final run??Bitcoin (BTCUSD) has been trading within a Channel Up pattern through the entirety of its Bull Cycle. The key characteristic of this pattern, which has also helped us at taking profits during each phase in timely manner, has been that every High since the Bear Cycle's Lower Highs trend-line broke, has been on a +0.5 Fibonacci extension interval.
As you can see, starting from Fib 1.5 ext, BTC has fulfilled the pattern by making Highs on the 2.5, 3.5 and 4.5 Fibs so far. What technically remains plausible until the end of the year is the 5.5 Fib ext, which sits at $180k.
With the 4-year Cycle theory suggesting a Cycle Top a little before the end of the year, is it realistic to expect this Target? Do you think there's time for BTC to make one final run like this? Feel free to let us know in the comments section below!
-------------------------------------------------------------------------------
** Please LIKE 👍, FOLLOW ✅, SHARE 🙌 and COMMENT ✍ if you enjoy this idea! Also share your ideas and charts in the comments section below! This is best way to keep it relevant, support us, keep the content here free and allow the idea to reach as many people as possible. **
-------------------------------------------------------------------------------
💸💸💸💸💸💸
👇 👇 👇 👇 👇 👇
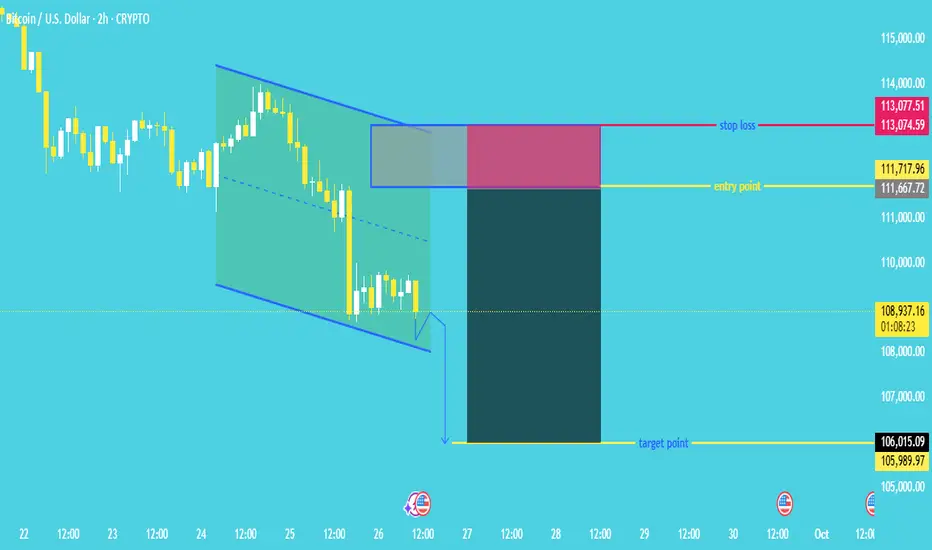
"Bitcoin Bearish Continuation Pattern: Short Entry on Retest"Chart Pattern
The price is moving within a descending channel (highlighted in blue and green), which typically signals continuation of the current downtrend.
A breakout to the downside of the channel seems to be forming (small breakout candle drawn outside the channel).
🔽 Trade Setup: Short Position
This is a short trade setup, meaning the trader expects the price to go down.
🔸 Entry Point
Entry Zone: Between 111,667.72 and 111,717.96 USD
This is above the current price, suggesting a pullback entry (waiting for a slight retracement before shorting).
🔹 Stop Loss
Stop Loss Zone: Between 113,074.59 and 113,077.51 USD
Placed above the channel and the entry point to protect against invalidation.
🟢 Target Point (Take Profit)
Target Zone: Between 105,989.97 and 106,015.09 USD
The expected price move is based on a measured move or projected breakdown from the channel.
🧮 Risk to Reward Ratio
The risk/reward box (red for risk, green for reward) shows a positive risk-reward ratio, likely around 1:2 or better, which is favorable in trading.
✅ Analysis Summary
Trend: Bearish (descending channel, lower highs and lower lows).
Setup: Short position on pullback into resistance zone.
Target: 106,000 area.
Stop: 113,000 area.
Current Price: Around 108,905.09 USD.
📌 Final Thoughts
The setup assumes the breakdown from the channel is valid.
A retest of the breakdown zone (entry point) is anticipated before continuation downward.
Be mindful of potential false breakouts or sudden bullish reversals.
Supported at 110,000–111,000, we stay bullishAnother successful long entry 🚀! As we have repeatedly stated before, as long as BTC does not break below the 110000–111000 support range 🛡️, we will still maintain a bullish outlook 🐂
Buy @111000
TP 112000 - 11300 -113500
Accurate signals are updated every day 📈 If you encounter any problems during trading, these signals can serve as your reliable guide 🧭 Feel free to refer to them! I sincerely hope they'll be of great help to you 🌟 👇
BITCOIN Can this pattern hold one last time?Bitcoin (BTCUSD) is holding (so far) its 1W MA20 (red trend-line) as mentioned on our previous analysis, which is critical for the continuation of the bullish trend.
Today however, we bring you a pattern that may have gone unnoticed and as long as it holds, the market should be expecting a new High.
That is the transition of a former Resistance level (formed from a previous High) that turns into Support (new Low), which generates a rally that so far has measured a minimum +45.73% (from the High).
However every such Low was priced at or very close to the 1W MA50 (blue trend-line). This time the 1W MA50 is at 100k and a way for this pattern to be fulfilled, BTC should at least trade sideways until it comes close to the 1W MA50.
In any case, as long as the Support level holds, a +45.73% rise, would take us to $157000.
Do you think we have chances for that? Feel free to let us know in the comments section below!
-------------------------------------------------------------------------------
** Please LIKE 👍, FOLLOW ✅, SHARE 🙌 and COMMENT ✍ if you enjoy this idea! Also share your ideas and charts in the comments section below! This is best way to keep it relevant, support us, keep the content here free and allow the idea to reach as many people as possible. **
-------------------------------------------------------------------------------
💸💸💸💸💸💸
👇 👇 👇 👇 👇 👇

BTCUSD: hold a bullish viewThe current price is around 112700, up 0.17% from the previous trading day. It has fluctuated within the 111000 - 113300 range in the past 24 hours, showing a narrow - range consolidation trend. However, it has not yet broken below the 111000 support level, so we still hold a bullish view. That said, the market is currently in a phase of game between "institutional accumulation and short - term caution"—do not blindly chase the upside.
Buy 112000 - 112500
TP 113000 - 113500 -114000
Daily-updated accurate signals are at your disposal. If you run into any problems while trading, these signals serve as a reliable reference—don’t hesitate to use them! I truly hope they bring you significant assistance

Bitcoin Reward – Bullish Thieves or Bearish Bandits?🚨💰 BTC/USD "Bitcoin vs U.S. Dollar" Crypto Market Grand Heist Plan 🎭🚨
🕵️♂️ Dear Thief OG’s, Money Makers & Market Bandits 💎💰
It’s time to lock & load the Bitcoin Heist Plan with both sides of the robbery open (Bullish & Bearish)! ⚡
🔑 Entry Zones (Where the Robbery Begins)
📉 Bearish Bandits: Any price level! Rob the upside liquidity & run it down!
📈 Bullish Thieves: Pullback entry 108,000.0 and above – sneak in with style & power.
🛑 Stop Loss (Escape Route)
🔒 For Bullish: Thief SL @ 105,000.0 🚨
⚠️ Reminder, OG’s: Adjust your SL with your own strategy & risk plan. Don’t get caught by the market police 👮♂️💥.
🎯 Target (The Loot Bag)
🏆 Bullish Robbery Target: 124,000.0 💸
🏴☠️ Bearish Robbery Targets:
1️⃣ 110,000.0
2️⃣ 104,000.0
📜 Thief’s Market Note
This isn’t just a trade, it’s a crypto robbery blueprint – choose your side, Bullish or Bearish, and execute like a true Thief Trader. Always plan your entries in layers, stack the loot, and manage your risk like a pro bandit. ⚡💼
🔥💥 If you love the heist style, Boost this idea 💥🔥
Every boost adds fuel to the Thief Trading Crew 🚀💎.
Stay alert, stay sharp, and remember… the market is the biggest bank, and we are here to rob it! 🤑🎭💰

Continue waiting for a reboundFor BTC, stick to buying low as we suggested yesterday 🐂. As long as the support level between 110000 and 111000 holds 🛡️, we can continue waiting for a rebound 📈
Buy @111000 - 111500
TP 113000 - 113500 -114000
Accurate signals are updated every day 📈 If you encounter any problems during trading, these signals can serve as your reliable guide 🧭 Feel free to refer to them! I sincerely hope they'll be of great help to you 🌟 👇
BITCOIN The hidden pivot of the Bollinger Bands (140k or 100k?).Bitcoin (BTCUSD) is testing again the basis (black trend-line) of the 1W Bollinger Bands (BB), just 3 weeks after it held and initiated a rebound.
On this chart you can see that since July 2023, every time BTC closed a 1W candle below the BB basis level, the price pulled-back to its 1W MA50 (blue trend-line) and then rebounded. That is its ultimate long-term Support so far.
As a result, all eyes should be on this week's closing. Below the BB basis, we should most likely seek the 1W MA50 a little above the $100000 mark. Ideally, it should coincide with a 1W RSI Support Zone test (holding since September 2023).
If the BB basis holds though, we should extend the BB top within the $130-140k Zone.
What do you think will come first? Feel free to let us know in the comments section below!
-------------------------------------------------------------------------------
** Please LIKE 👍, FOLLOW ✅, SHARE 🙌 and COMMENT ✍ if you enjoy this idea! Also share your ideas and charts in the comments section below! This is best way to keep it relevant, support us, keep the content here free and allow the idea to reach as many people as possible. **
-------------------------------------------------------------------------------
💸💸💸💸💸💸
👇 👇 👇 👇 👇 👇

BITCOIN Drop back towards 100k or rise to $130k? What's next?Bitcoin (BTCUSD) is at critical crossroads as it is pulling back today towards its 1W MA20 (red trend-line). We've discussed before of the importance of this level as a technical Support that has fueled the final BTC rallies during past Cycles. As this held on August 25 and closed the candle above it, we expected that to be this confirmation.
Today's decline however jeopardizes this model, in fact the Parabola pattern of the current (2023-2025) Bull Cycle, has always been tested when Bitcoin closed below its 1W MA20. As you can see it has always declined and touched its 1W MA50 (blue trend-line) to form a Support and start the next Bullish Leg.
The 1W MA50 is currently just below the $100k level so an aggressive drop below the 1W MA20 (candle closing) can take us around that area in a matter of 2-3 weeks. If however the 1W MA20 holds, it is more likely to see a rise to $130000 at least. And that is what the Sine Waves Tops imply (red Rectangle peak formation, with a 1W MA50 test more likely to occur in late January 2026.
So what do you think? Is $100k or $130k next for Bitcoin? Feel free to let us know in the comments section below!
-------------------------------------------------------------------------------
** Please LIKE 👍, FOLLOW ✅, SHARE 🙌 and COMMENT ✍ if you enjoy this idea! Also share your ideas and charts in the comments section below! This is best way to keep it relevant, support us, keep the content here free and allow the idea to reach as many people as possible. **
-------------------------------------------------------------------------------
💸💸💸💸💸💸
👇 👇 👇 👇 👇 👇

Drop to around 115300 at midnightAt midnight, BTC saw a significant pullback, dropping to around 115300. Currently fluctuating around this level, and we still maintain that it will stay in an upward trend during the daytime.
