Bitcoin BTCUSD next MovePair : BTCUSD ( Bitcoin / U.S Dollar )
Description :
Break of Structure
Divergence
Symmetrical Triangle
Bullish Channel in LTF as an Corrective Pattern
Completed " 1234 " Impulsive Wave
Breakout the S / R Level
Btcusdsignals

Bitcoin H1Here is my view for BTCUSD on H1. The price could go bullish, you can put a pending order on the Order block or find an entry on LTF within OB Zone. Trade Safe!

BITCOIN Cycle comparison and how China bonds initiate new Bull!This is not the first time we incorporate the Chinese bond yields element (CN02Y/CN20Y) to Bitcoin (BTCUSD) analysis, but it is the first time we do so in such an illustrative way by displaying all Cycles from a common starting point. We have made a case in the past how strong of a correlation the Chinese bond market has with Bitcoin and how efficiently that can predict its Cycles.
As you see on the chart, each Cycle portrays a certain period: Red = Cycle 1 -2 (2010 - 2014), Blue = Cycle 2 - 3 (2015 - 2018) and Orange = Cycle 3 - 4 (2019 - now). The CN02Y/CN20Y ratio is displayed in Grey. A key characteristic is that all Cycles have a common start, the bottom of the previous one. We see the effect of diminishing returns as each Cycle is less aggressive (naturally) from the previous one.
We also see the strong connection with CN02Y/CN20Y, as when the ratio starts declining, BTC enters a Bear Cycle, and once the ratio starts rising, BTC initiates a Bull Cycle. Right now it appears that we are at the point where the CN02Y/CN20Y ratio typically peaks and consolidates, which for BTC is translated to the time it breaks above its 1W MA50 and practically starts a new aggressive rally, the first of the new Bull Cycle.
Based on this model, Bitcoin should extend the rally it started this year. Do you agree? Feel free to let us know in the comments section below!
-------------------------------------------------------------------------------
** Please LIKE 👍, FOLLOW ✅, SHARE 🙌 and COMMENT ✍ if you enjoy this idea! Also share your ideas and charts in the comments section below! **
-------------------------------------------------------------------------------
💸💸💸💸💸💸
👇 👇 👇 👇 👇 👇

BTCUSD- Upcoming Big Reversal on Bitcoin!!! hey everyone, BITCOIN spiked up due to collapsed of SVB BANK alongside gold, this is due to the uncertainty that market created. As we are looking for upcoming moves we are expecting prices to be bullish until 28k after we have where we believe that price will reject.
GOOD LUCK AND HAPPY TRADING.

BITCOIN is repeating late January. Small rise and consolidation Bitcoin (BTCUSD) in terms of RSI and MACD on the 4H time-frame, is replicating the formations of late January. We have applied the Pitchfork tool since January's Low and is shows a highly accurate pattern whose Fibonacci levels form Resistance/ Support lines.
The 4H MACD is about to make a Bullish Cross and on January 20 that was the start of a mini price jump before a 3-week consolidation. This is portrayed by the green Rectangle. As long as the 4H MA50 holds (blue trend-line), it is not unlikely to see another mini pump. The Support is located within the 0.236 - 0.382 Fibs, assuming it follows January's sequence.
-------------------------------------------------------------------------------
** Please LIKE 👍, FOLLOW ✅, SHARE 🙌 and COMMENT ✍ if you enjoy this idea! Also share your ideas and charts in the comments section below! **
-------------------------------------------------------------------------------
💸💸💸💸💸💸
👇 👇 👇 👇 👇 👇

Higher Low RSI Set Up on BTCHigher Low RSI Set Up on BTC .
We have to visit an area that we climbed too fast. I believe it will occur at RSI when we will visit.
Rsi going lower when price going higher is a bullish set-up.
Price can move up without putting any lower low when this happens.
I believe 27.500 then 29000 will come.

BITCOIN $50000 is a realistic target by November!Bitcoin (BTCUSD) satisfied those that kept comparing the 2022/23 Cycle to the 2014/15 one as after the a clear rejection on the 1W MA50 (blue trend-line), it rebounded on the Cyclical Lower Highs trend-line and since last week it closed above it as well as the 0.382 Fibonacci retracement level.
This symmetry is remarkable and it doesn't stop here. Right now we are 101 weeks after the Cycle's true technical top on the week of April 12 2021. Notice that the 2nd week following the first 1W candle closing above the 1W MA50 in 2015 was on the October 26 2015 candle. That was 100 weeks after the Cycle Top!
If this amazing symmetry continues to hold, then we can expect BTC to reach the 0.786 Fibonacci level in 33 weeks from now, i.e. on the 1W candle of November 06 2023. That gives an exact target of $50000.
Do you think this pattern will hold until then? Feel free to let us know in the comments section below!
-------------------------------------------------------------------------------
** Please LIKE 👍, FOLLOW ✅, SHARE 🙌 and COMMENT ✍ if you enjoy this idea! Also share your ideas and charts in the comments section below! **
-------------------------------------------------------------------------------
💸💸💸💸💸💸
👇 👇 👇 👇 👇 👇

BITCOIN Knocking on the massive 2-year Liquidity Zone's door.Bitcoin (BTCUSD) closed last week the first 1W candle above the 1W MA50 since March 2022, ending a full year of intense selling pressure. This closing opens up enormous long-term bullish possibilities as the new Bull Cycle has just started and the first challenge is the massive Cycle Liquidity Zone (green range) that goes back to January 2021!
As you see this zone, which sits around the 0.5 Fibonacci retracement level and within the 0.382 - 0.618 Fib range, has provided long-term Support three times but when 2 straight 1W candles closed below Fib 0.5, it turned into Supply and opened the way for the May-June 2022 collapse.
It is easy to understand therefore the importance of this Cyclical Zone. BTC is about to enter it and most likely will test Fib 0.5 (32750) and provide us with the direction. A double candle closing above it, could be what fuels Bitcoin to even higher Highs. Don't neglect also the 1W MA100 (green trend-line), which most likely will be on the 0.5 Fib by the time of a potential test.
It is worth noting that all the time the Liquidity Zone was tested, were with the Supertrend indicator in red. This time the indicator is in green, showing that Bitcoin has indeed started a new Bull Cycle.
So what do you think this Liquidity Zone test has in store for Bitcoin? Will it be bullish or bearish? Feel free to let us know in the comments section below!
-------------------------------------------------------------------------------
** Please LIKE 👍, FOLLOW ✅, SHARE 🙌 and COMMENT ✍ if you enjoy this idea! Also share your ideas and charts in the comments section below! **
-------------------------------------------------------------------------------
💸💸💸💸💸💸
👇 👇 👇 👇 👇 👇

Bitcoin is reversing weekly time frame!COINBASE:BTCUSD
1W time frame
-
We are eventually reversing weekly EMA Ribbon!
Sit tight!

BITCOIN The party has started and has another 33 months left!Bitcoin (BTCUSD) gives us a very clear picture with regards to its long-term Cycles on the 1M (monthly) time-frame. As you see, once the 1M RSI hit the bottom (Lower Lows trend-line) of its 10 year Channel Down, BTC bottomed and the new Bull Cycle started.
This Bull Cycle should last for approximately 35 months (1065 days) as this was roughly the duration of the previous two Cycles. Even the Bear Cycles are on almost perfect symmetry as the last three lasted for around 13 months (396 days).
We have also plotted the patterns of the last two Bull Cycles on the current one in order to give an average projection. If the top hit somewhere within Multiple 6 and 7 (Fib MAs), then we can see $150k.
So what do you think about this Cycle symmetry? Has the Bull party just started and has another 33 months to it? Feel free to let us know in the comments section below!
-------------------------------------------------------------------------------
** Please LIKE 👍, FOLLOW ✅, SHARE 🙌 and COMMENT ✍ if you enjoy this idea! Also share your ideas and charts in the comments section below! **
-------------------------------------------------------------------------------
💸💸💸💸💸💸
👇 👇 👇 👇 👇 👇

Bitcoin get rid of Bear!COINBASE:BTCUSD
3D time frame
-
We are probably on the second wave until hitting 28~31k
Get ready!

BITCOIN The S&P/GOLD ratio is leading the way!This is a unique study showing the correlation of Bitcoin (BTCUSD) with the S&P500/Gold ratio (SPX/XAUUSD) displayed by the orange trend-line.
On this 1W time-frame, Bitcoin has broken above the 1W MA50 (blue trend-line) and will attempt to make the first closing above it, in order to confirm the new Bull Cycle beyond any doubt. In the previous Cycle this took place on the week of April 29 2019.
As you can see, the patterns between the two Cycles are identical. Bitcoin tends to peak earlier when the S&P500/Gold ratio makes its last Higher High before it eventually tops after BTC is well within its Bear Cycle. The S&P500/Gold ratio then forms a series of Lower Highs, the second of which is when BTC bottoms (excluding the FTX crash, that would have been the bottom). At the moment we are expecting a Lower Low on the S&P500/Gold ratio in order to price the first High of the first rally of the new Bull Cycle.
Do you think the S&P500/Gold ratio is leading the way for Bitcoin? Feel free to let us know in the comments section below!
-------------------------------------------------------------------------------
** Please LIKE 👍, FOLLOW ✅, SHARE 🙌 and COMMENT ✍ if you enjoy this idea! Also share your ideas and charts in the comments section below! **
-------------------------------------------------------------------------------
💸💸💸💸💸💸
👇 👇 👇 👇 👇 👇

BITCOIN Can we finally end the comparisons with August 2015?As everyone is aware, Bitcoin (BTCUSD) made an incredible rebound on the 1D MA200 (orange trend-line) 5 days ago shortly after forming a Bullish Cross with the 1D MA100 (green trend-line). As many analysts have been comparing the current Cycle Bottom to that of 2015, it is perhaps time to call it a day on expectations for a 15.5k Double Bottom as it happened on August 2015.
As we have clearly explained to you and published on our January 21 analysis, expecting a drop like August 2015 wasn't an optimal strategy as it was caused by the Bitfinex flash crash:
As you see, that analysis has quite accurately grasped BTC's movement these past 2 months, projecting also February pull-back. Its first target before another consolidation/ pull-back was around the 0.5 Fibonacci (33k). On the current analysis we will take it a step further, showing another angle by comparing it with the 2015 fractal, excluding of course (as we also told you 2 months ago) the August 2015 Bitfinex crash, which was an unexpected event that distorted the sound technical trend up to that point.
** Similarities between 2023 - 2015 **
First of all, observe how similar the 1D RSI sequences traded. The new rebound started once the 1D RSI broke into the 30.00 oversold barrier. If we also exclude the November 08/09 2022 FTX crash, we can see that on both fractals the range from the prior Low to the Resistance is around +40%. Assuming the Bitfinex crash in August 2015 never happened, and we calculate the impulse rise from the 1D MA200, we get an exact +100% rise on the November 04 2015 High. If this gets repeated today, it gives a $39000 target.
-------------------------------------------------------------------------------
** Please LIKE 👍, FOLLOW ✅, SHARE 🙌 and COMMENT ✍ if you enjoy this idea! Also share your ideas and charts in the comments section below! **
-------------------------------------------------------------------------------
💸💸💸💸💸💸
👇 👇 👇 👇 👇 👇


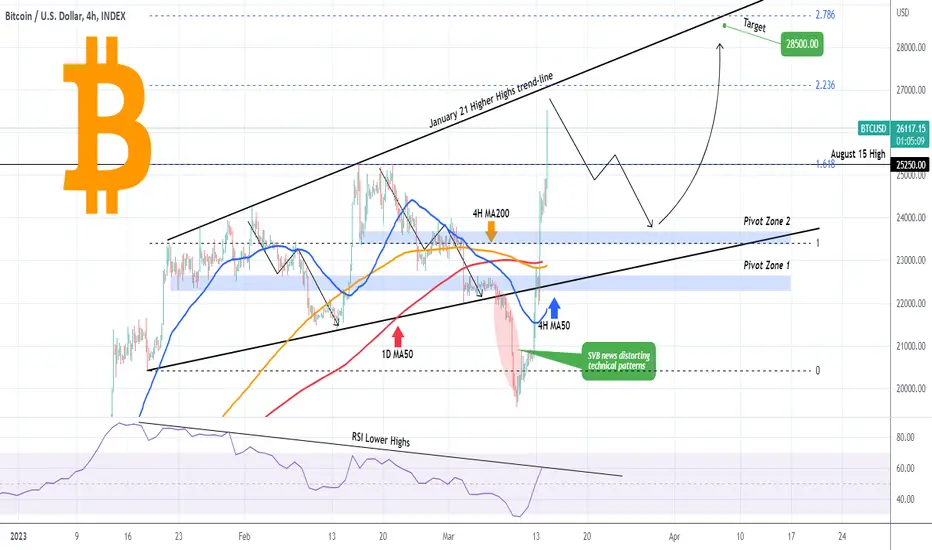
BITCOIN above the August High! Congratulations buyers!Bitcoin (BTCUSD) rebounded on the 1D MA200 much more easily and much faster than anticipated as per our Inverse Head and Shoulders buy signal 4 days ago:
The long-term target of 41300 is intact but as the price broke above the 25250 August 15 High with force, we are taking our perspective on the more short-term again, on the 4H time-frame.
As you see, if we exclude the naturally unexpected sell-off of March 09 -10 due to the Silicon Valley Bank (SVB) bankruptcy news, the pattern that stood out was the Bullish Megaphone. That was technically supporting until the SVB fundamentals took over.
Now that the price is close to the top of the Megaphone (Jan 21 Higher Highs) and the 2.236 Fibonacci extension, we expect a technical pull-back towards Pivot Zone 2 (Pivot Zone 1 was the range that supported the previous Megaphone correction) and the 1D MA50 (red trend-line). The short-term target is 28500, a little below the 2.786 Fibonacci extension. On a side-note, notice the 4H RSI testing its Lower Highs trend-line.
-------------------------------------------------------------------------------
** Please LIKE 👍, FOLLOW ✅, SHARE 🙌 and COMMENT ✍ if you enjoy this idea! Also share your ideas and charts in the comments section below! **
-------------------------------------------------------------------------------
💸💸💸💸💸💸
👇 👇 👇 👇 👇 👇
Trade range BTCUSDthe trade plan is described in the chart. you can either play in a range of S1 and R1 OR you can place sell Stop or Buy stop if it breaksout.
