BTC/USD Supply Zone Rejection – Short Setup Towards 111,450Pair & Timeframe
BTC/USD on the 1-hour chart.
The chart is showing intraday to short-term trading levels.
2. Current Market Structure
Price has been moving in a downward channel (bearish trend).
Multiple lower highs and lower lows confirm the downtrend.
Recently, price broke a bit above the channel but got rejected in the supply zone.
3. Supply Zone
Marked between 115,318 – 116,118 USD.
This is an area where sellers are expected to step in (previous breakdown zone).
Price reacted from this zone and is showing bearish continuation.
4. Trade Setup
Entry Point: ~115,337 USD
Stop Loss: 116,118 USD (just above supply zone to protect against false breakout)
Target Point: 111,468 USD
This gives:
Risk (SL – Entry) ≈ 781 USD
Reward (Entry – Target) ≈ 3,869 USD
Risk-to-Reward Ratio (RRR) ≈ 1:5, which is very favorable.
5. Current Price Action
BTC currently trading around 114,614 USD (below entry).
If price retests supply zone again but fails to break above, bearish continuation is likely.
If BTC breaks and closes above 116,118 USD, this short setup becomes invalid.
6. Outlook
Bearish bias as long as BTC stays under 116,118 USD.
High probability move toward 111,450 – 111,468 USD support zone.
If price holds above 116,118 USD, it could flip bullish and retest 117k+ levels.
✅ Summary:
This is a short setup based on supply zone rejection within a broader downtrend. The risk-to-reward is excellent (1:5), but watch for a false breakout above 116,118 USD.
Btcusdsignals

BTC Analysis TodayAs we’ve maintained all this time, BTC dipped to around 115500 at one point today and that was a great time to buy. Right after the pullback, it rebounded and started rising. the overall upward trend holds, and support level strong.
Buy 115000 - 115500
TP 116000 -116500 - 117000
Daily-updated accurate signals are at your disposal. If you run into any problems while trading, these signals serve as a reliable reference—don’t hesitate to use them! I truly hope they bring you significant assistance

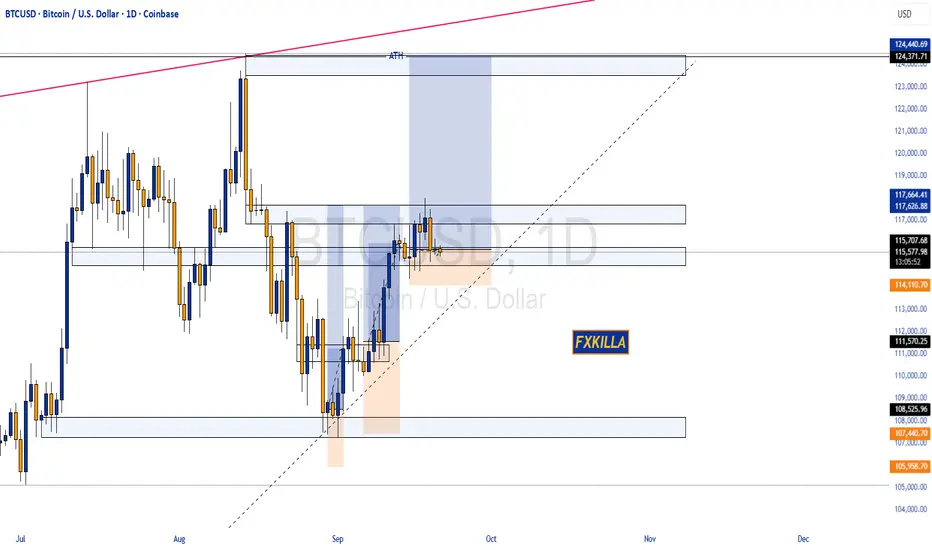
BITCON HIGH PROBABILITY SETUP SOON!!!🚨 BTCUSD HIGH PROBABILITY BUY SETUP 🚨
* Here We Can See Clearly The Next Potential Move For BTC Coming Hours/Days.
* Keep Your Eyes Close On Your Trading Positions.
* Happy PIP Hunting Traders.
FXKILLA.
Explaining the Lower Timeframe Function and Its Role in Trading Introduction
Candlesticks on higher timeframes summarize long periods of trading activity, but they hide the internal balance of buying and selling. A daily candle, for instance, may show only a strong close, while in reality buyers and sellers may have fought much more evenly. To uncover this hidden structure, Pine Script offers the requestUpAndDownVolume() function, which retrieves up-volume, down-volume, and delta from a chosen lower timeframe (LTF).
Function in Practice
By applying this function, traders can measure how much of a move was supported by genuine buying pressure and how much came from selling pressure. The function works across timeframes: when analyzing a daily chart, one can select a one-minute or one-second LTF to see how the volume was distributed within each daily bar . This approach reveals details that are invisible on the higher timeframe alone.
Helper for Data Coverage
Lower-timeframe data comes with strict limitations. A one-second chart may only cover a few hours of history, while a one-minute chart can stretch much further back. To make this limitation transparent, a helper was implemented in our code: it shows explicitly how far the available LTF data extends . Instead of assuming full coverage, the trader knows the exact portion of the higher bar that is represented.
//══════════════
// Volume — Lower TF Up/Down
//══════════════
int global_volume_period = input.int(20, minval=1, title="Global Volume Period", tooltip="Shared lookback for ALL volume calculations (e.g., averages/sums).", group=grpVolume)
bool use_custom_tf_input = input.bool(true, "Use custom lower timeframe", tooltip="Override the automatically chosen lower timeframe for volume calculations.", group=grpVolume)
string custom_tf_input = input.timeframe("1", "Lower timeframe", tooltip="Lower timeframe used for up/down volume calculations.", group=grpVolume)
import TradingView/ta/10 as tvta
resolve_lower_tf(bool useCustom, string customTF) =>
useCustom ? customTF :
timeframe.isseconds ? "1S" :
timeframe.isintraday ? "1" :
timeframe.isdaily ? "5" : "60"
get_up_down_volume(string lowerTf) =>
= tvta.requestUpAndDownVolume(lowerTf)
var float upVolume = na
var float downVolume = na
var float deltaVolume = na
string lower_tf = resolve_lower_tf(use_custom_tf_input, custom_tf_input)
= get_up_down_volume(lower_tf)
upVolume := u_tmp
downVolume := d_tmp
deltaVolume := dl_tmp
//──── LTF coverage counter — counts chart bars with valid Up/Down (non-na) 〔Hazel-lite〕
var int ltf_total_bars = 0
var int last_valid_bar_index = na // new: remember the bar_index of the last valid LTF bar
if not na(deltaVolume)
ltf_total_bars += 1
last_valid_bar_index := bar_index
int ltf_safe_window = ltf_total_bars
var label ltf_cov_label = na // label handle for the “coverage” marker
Use in Strategy Development
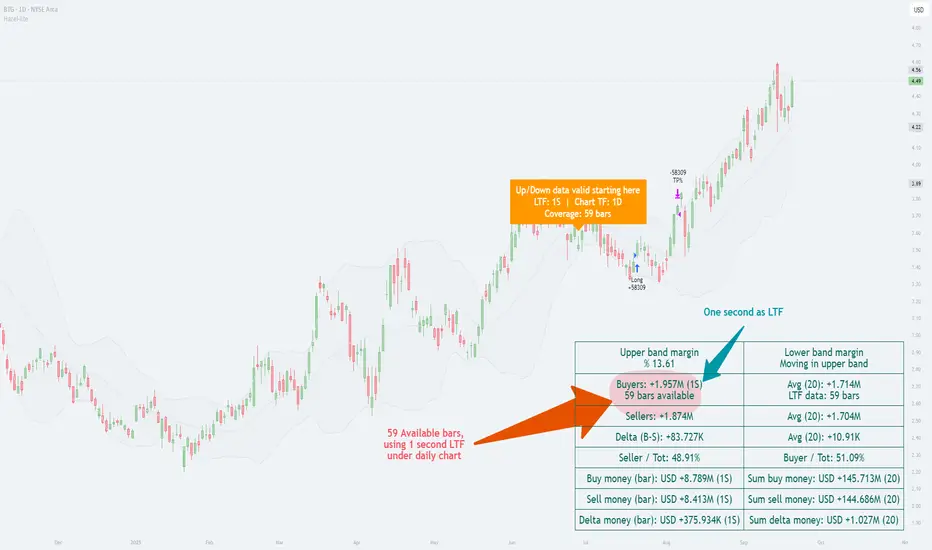
Because both the main function and the helper for data coverage have been implemented in our work, we use the Hazel-nut BB Volume strategy here as a practical example to illustrate the subject. This strategy serves only as a framework to show how lower-timeframe volume analysis affects higher-timeframe charts. In the following sections, several charts will be presented and briefly explained to demonstrate these effects in practice.
In this example, the daily chart is used as the main timeframe, while a one-second lower timeframe (LTF) has been applied to examine the internal volume distribution. The helper clearly indicates that only 59 one-second bars are available for this daily candle. This is critical, because it shows the analysis is based on a partial window of intraday data rather than a full day.
The up/down volume split reveals that buyers accounted for about 1.957 million units versus sellers with 1.874 million, producing a positive delta of roughly +83,727. In percentage terms, buyers held a slight edge (≈51%), while sellers were close behind (≈49%). This near balance demonstrates how the daily candle’s bullish appearance was built on only a modest dominance by buyers.
By presenting both the margin values (e.g., upper band margin 13.61%) and the absolute money flow, the chart connects higher-timeframe Bollinger Band context with the micro-timeframe order flow. The annotation “Up/Down data valid starting here” reinforces the importance of the helper: it alerts the user that valid LTF volume coverage begins from a specific point, preventing misinterpretation of missing data.
In short, this chart illustrates how choosing a very fine LTF (1 second) can reveal subtle buyer–seller dynamics, while at the same time highlighting the limitation of short data availability. It is a practical case of the principle described earlier—lower-timeframe insight enriches higher-timeframe context, but only within the boundary of available bars.
Analysis with One-Minute LTF
In this chart, the daily timeframe remains the base, but the lower timeframe (LTF) has been shifted to one minute. The helper indicates that data coverage extends across 353 daily bars, a much deeper historical window than in the one-second example. This means we can evaluate buyer/seller balance over nearly a full year of daily candles rather than just a short slice of history.
The up/down split shows buyers at ≈2.019M and sellers at ≈1.812M, producing a positive delta of +206,223. Here, buyers hold about 52.7%, compared to sellers at 47.3%. This stronger bias toward buyers contrasts with the previous chart, where the one-second LTF produced only a slim delta of +83,727 and ratios closer to 51%/49%.
Comparison with the One-Second LTF Chart
Data coverage: 1s gave 59 daily bars of usable history; 1m extends that to 353 bars.
Delta magnitude: 1s produced a modest delta (+83k), reflecting very fine-grained noise; 1m smooths those micro-fluctuations into a larger, clearer delta (+206k).
Interpretation: The 1s chart highlighted short-term balance, almost evenly split. The 1m chart, backed by longer history, paints a more decisive picture of buyer strength.
Key Takeaway
This comparison underscores the trade-off: the lower the LTF, the higher the detail but the shorter the history; the higher the LTF, the broader the historical coverage but at the cost of microscopic precision. The helper function bridges this gap by making the coverage explicit, ensuring traders know exactly what their analysis is built on.
Impact of TradingView Plan Levels
Another factor shaping the use of this function is the user’s access to data. TradingView accounts differ in how much intraday history they provide and which intervals are unlocked.
◉ On the free plan, the smallest available interval is one minute, with a few months of intraday history.
◉ Paid plans unlock second-based charts, but even then, history is measured in hours or days, not months.
◉ Higher tiers extend the number of bars that can be loaded per chart, which becomes relevant when pulling large volumes of lower-timeframe data into higher-timeframe studies
Conclusion
With requestUpAndDownVolume(), it becomes possible to see how each symbol behaves internally across different timeframes. The helper function makes clear where the data stops, preventing misinterpretation. By applying this setup within strategies like Hazel-nut BB Volume, one can demonstrate how changing the lower timeframe directly alters the picture seen on higher charts. In this way, the function is not just a technical option but a bridge between detail and context.
BITCOIN This is where the fat lady sings..Well this is o secret. We've pointed that out many times before but it couldn't be more relevant than now as Bitcoin (BTCUSD) is approaching the end of its 4-year Cycle.
So where does the 'fat lady sing'? According to the 1M RSI, at the top of its historic 15-year Channel Down. Which by the end of this year it should be above (the vastly oversold condition of) 90.00.
Is there enough time to left to do so? Feel free to let us know in the comments section below!
-------------------------------------------------------------------------------
** Please LIKE 👍, FOLLOW ✅, SHARE 🙌 and COMMENT ✍ if you enjoy this idea! Also share your ideas and charts in the comments section below! This is best way to keep it relevant, support us, keep the content here free and allow the idea to reach as many people as possible. **
-------------------------------------------------------------------------------
💸💸💸💸💸💸
👇 👇 👇 👇 👇 👇

BTC/USD Long Setup: RBR Zone Retest After Channel BreakoutTechnical Structure
Rising Channel (Highlighted in Red):
Price was moving within a bullish channel.
The channel was broken to the upside, indicating strong bullish momentum.
RBR Zone (Rally-Base-Rally):
A demand zone marked in red.
This area acts as a support zone where price is expected to bounce after a pullback.
It's the ideal entry area according to this strategy.
Current Price:
BTC/USD is trading around 117,910.63.
The price has just broken out of the channel and is expected to retest the RBR zone.
🎯 Trade Setup
Label Price Level Description
Entry Point 116,772.43 Ideal buy level after retest of RBR zone.
Stop Loss 116,077.82 Below the RBR zone. Gives room for a fakeout.
Target Point 120,013.92 Profit target based on the projected move.
📊 Risk to Reward Ratio (RRR)
Let's calculate the approximate Risk:Reward:
Risk: 116,772.43 - 116,077.82 = 694.61 points
Reward: 120,013.92 - 116,772.43 = 3,241.49 points
✅ Risk:Reward ≈ 1:4.67, which is excellent.
🔄 Expected Price Action
The chart suggests the following scenario:
Price breaks out of the bullish channel.
It retraces back into the RBR zone.
It finds support near the entry level.
A bounce follows, pushing BTC toward the target level of ~120,000.
📌 Summary
✅ Bullish setup after breakout from a rising channel.
✅ RBR demand zone suggests strong support at the entry.
✅ RRR is favorable (~1:4.67) — a good reward for the risk taken.
⚠️ Risk: If price drops below the stop loss zone, the trade idea is invalid.

BITCOIN 1W Stoch RSI completed a Bullish Cross. Expect new ATH.Bitcoin (BTCUSD) just completed a Bullish Cross on its 1W STOCH RSI and that's the first time it does so since April 07 2025. That was as we know, the previous market bottom of the Trade War correction.
In fact, every 1W STOCH RSI Bullish Cross has been a buy signal within this Bull Cycle's Channel Up (since November 2022), most of which huge. The April 2025 Bullish Leg rose by +65.92% and that has been the 'weakest' one of this Channel Up.
As a result, if we get the bear minimum of +65.92% this time around too, expect a new High around $175000, which should be the Cycle Top and in our opinion the absolute maximum that this Cycle can give.
Do you think we will go that high? Feel free to let us know in the comments section below!
-------------------------------------------------------------------------------
** Please LIKE 👍, FOLLOW ✅, SHARE 🙌 and COMMENT ✍ if you enjoy this idea! Also share your ideas and charts in the comments section below! This is best way to keep it relevant, support us, keep the content here free and allow the idea to reach as many people as possible. **
-------------------------------------------------------------------------------
💸💸💸💸💸💸
👇 👇 👇 👇 👇 👇

Bitcoin - It is bullish either way!💎Bitcoin ( CRYPTO:BTCUSD ) still remains bullish:
🔎Analysis summary:
Yes, over the past couple of days we have been seeing a quite negative correction on Bitcoin. However, looking at the higher timeframe, Bitcoin remains totally bullish. So even if Bitcoin continues with the recent correction, it would ultimately result in a bullish all time high break and retest.
📝Levels to watch:
$60.000
SwingTraderPhil
SwingTrading.Simplified. | Investing.Simplified. | #LONGTERMVISION

BITCOIN Will it pull back??Bitcoin (BTCUSD) just formed a 4H Golden Cross, technically a bullish pattern, which usually emerges at the start of uptrends.
Such a formation emerged on both main Channel Up patterns since the April 07 Trade War bottom. The interesting feature however is that, following every 4H Golden Cross, the price always pulled back to its 4H MA200 (orange trend-line).
With BTC having started the week on the back foot, the 4H MA200 currently stands at $113600. Ahead of the Fed Rate Decision this week, a 'volatility' pull-back would align the news with this technical need.
Do you think we'll get that pull-back? Feel free to let us know in the comments section below!
-------------------------------------------------------------------------------
** Please LIKE 👍, FOLLOW ✅, SHARE 🙌 and COMMENT ✍ if you enjoy this idea! Also share your ideas and charts in the comments section below! This is best way to keep it relevant, support us, keep the content here free and allow the idea to reach as many people as possible. **
-------------------------------------------------------------------------------
💸💸💸💸💸💸
👇 👇 👇 👇 👇 👇

BTCUSD Market AnalysisObserving price movements, BTCUSD experienced a brief pullback lately after a wave of upward momentum, but the broader bullish structure stays intact. During this pullback, the underlying support proved effective, and the price subsequently rebounded. When it comes to upper resistance, the focus remains on the 117,000 to 118,000 interval.
Buy 114500-115000
TP 115500-116500-117500
Daily-updated accurate signals are at your disposal. If you run into any problems while trading, these signals serve as a reliable reference—don’t hesitate to use them! I truly hope they bring you significant assistance

Daily Market Analysis of BTCUSDFrom the observation of price movements, recently, after a wave of rise, BTCUSD has experienced short-term pullback, but the overall bullish structure remains intact. During the pullback, the support below was effective, and then the price rose again.
For upper resistance, the focus remains on the 117,000–118,000 USD range.
Buy 114500-115000
TP 115500-116500-117500
Daily-updated accurate signals are at your disposal. If you run into any problems while trading, these signals serve as a reliable reference—don’t hesitate to use them! I truly hope they bring you significant assistance

BTC/USD 15/09/2025: Bullish Setup Awaits Fed DecisionHey TradingView traders! On September 15, 2025, Bitcoin is chilling around 115,491 - 116,009 USD with slight volatility (+0.11% to +0.25% in the last 24 hours). The market vibe is neutral, but could this be the calm before the storm as we await the Fed’s interest rate decision this week? Let’s dive into a detailed analysis to help you seize the opportunity! 💰
Market Overview: Stable but Packed with Potential
BTC continues to dominate with a market cap of 2.31 trillion USD, ruling the crypto space. 24-hour trading volume hits 33.29 billion USD (+4.72%), signaling steady investor participation but not enough for a strong bullish push yet. Circulating supply stands at 19.92 million BTC (94.86% of the 21 million total), easing internal inflationary pressure and supporting long-term value. What do you think—can BTC maintain its 92.27% yearly gain? Drop your thoughts in the comments! 📊
Technical Analysis: Double Bottom and Bullish Channel Heating Up
Support & Resistance Levels: Solid support at 114,000 - 115,000 USD (holding strong since early September). Nearest resistance at 116,000 - 116,500 USD—if broken, the next target is 120,000 USD! Failure to break could lead to a retest of 114,000 USD. Don’t miss a potential breakout! ⚠️
Trend: The market is forming a double bottom pattern from September’s low, with the bullish channel still intact. The Fear & Greed Index at 53-55 (Neutral) shows balanced investor sentiment—no excessive FOMO or panic. RSI is neutral, MACD slightly weakening, but the overall signal is “Buy” for the daily timeframe! 📉
Macro Factors & News: Is the Fed the Final Boss?
The market is holding its breath for the Fed’s expected 0.25% rate cut this week—if it happens, risk-on capital could flood into BTC like a waterfall! 🌊 On the bullish side: Billionaire Tim Draper is pushing for wider BTC adoption, predicting 250,000 USD by the end of 2025; Capital Group turned a 1 billion USD investment into 6 billion USD in profits. But watch out for whale dumps and weak altcoins (e.g., SHIB down 3.22%)—these could drag BTC down. Are you ready for the volatility? 🔥
Forecast & Trading Plan: Action Time for Traders
Short-Term (1-7 Days): Expect a range of 114,000 - 117,000 USD, with the Fed decision as the key catalyst. If rates are cut, BTC could test 120,000 USD; otherwise, there’s a risk of dropping to 114,000 USD. Probability of a rise: 60% if it holds above 115,000 USD—perfect time to go long! 📈
Long-Term (2025-2030): Strongly bullish! Changelly predicts 116,220 USD today, climbing to 117,978 USD tomorrow; Investing Haven sees stability around 116,087 USD. With the previous halving and institutional accumulation, BTC could surpass 200,000 USD by year-end. Diversify your portfolio to manage risks, though! 💡
Traders, it’s time to act! Keep an eye on the BTC/USD chart on TradingView and share your thoughts in the comments. DYOR and trade safely! 👍
#Bitcoin #BTCUSD #CryptoAnalysis #TradingView #FedRateCut #BullishBTC #Crypto2025 #Altcoins #WhaleWatch #FearAndGreed

Precise Prediction and Forecast for BTCUSD MarketYesterday, we accurately predicted that BTC would rally to around 116,000 USD and face certain resistance. Today, after breaking through 116,000 USD as expected, the price retraced to hover around 115,000 USD.
Looking ahead, if BTC can stabilize near the 115,000 USD level, it is highly likely to continue its upward trajectory, with the potential to retest the 120,000 USD mark. For upper resistance, the focus remains on the 117,000–118,000 USD range
Buy 114000-114500
TP 115000-116000-1175000
Daily-updated accurate signals are at your disposal. If you run into any problems while trading, these signals serve as a reliable reference—don’t hesitate to use them! I truly hope they bring you significant assistance

BTCUSD 4-Hour Chart AnalysisLooking at the BTCUSD 4-hour chart, the price has recently exhibited a dynamic trend. After a prior upward movement, it underwent a pullback. Now, it has found solid support at the 112,500 level. This support zone appears reliable, as the price has stabilized above it, indicating that buying interest has emerged here to prevent further declines.
In terms of resistance, the 116,000 level is a key hurdle to watch. If the price can successfully break through 116,000 with strong momentum, it would open the door to further upside potential. Before that, the 115,000 level could act as a near-term resistance to test the bulls' strength.
For traders, the strategy could be to monitor the price action around the 112,500 support. If the support holds and there are signs of a bullish reversal , it may be an opportunity to consider long positions with a target towards 115,000 and then 116,000. Conversely, a breakdown below 112,500 would shift the bias to the downside, with the next support level to watch at 110,640
Overall, the near-term trend hinges on the price's interaction with the 112,500 support and the subsequent attempt to challenge the 115,000 - 116,000 resistance zone.
Buy 112500 - 113500
TP 114500 - 115500 - 116000
Daily-updated accurate signals are at your disposal. If you run into any problems while trading, these signals serve as a reliable reference—don’t hesitate to use them! I truly hope they bring you significant assistance

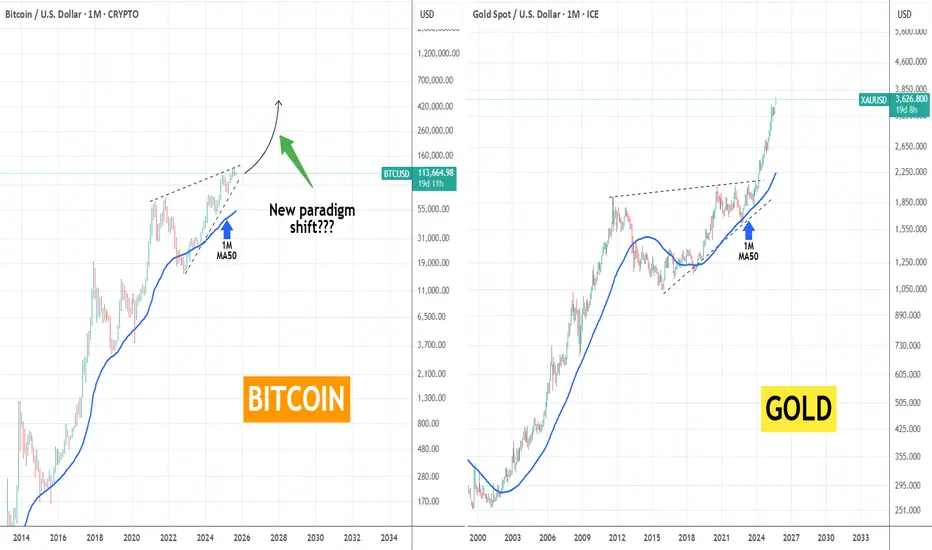
BITCOIN vs GOLD Is something like that inevitable?Bitcoin (BTCUSD) has been often described as the digital Gold, mainly due to its scarcity (fixed supply), compared to Gold's value as a safe haven asset. So what's the deal with this comparison chart?
If you follow us for long, you should know that we are strong believers of BTC's 4-year Cycle theory, which has served us so well and helped us buy and sell near cyclical bottoms and tops respectively.
However, as the market matures (remember Bitcoin is 'only' 16 years old), it could/ should eventually break this pattern upwards into aggressively higher valuations, which could be the shift to a new paradigm as mass adoption kicks in.
As a result, could it make a vicious bullish break-out above this Triangle in a similar way as Gold past 2024? Essentially, can we argue that Gold is leading the way as the traditional asset? Or the 4-year Cycle will go on for much longer than many think?
We are very interested in your thoughts. Feel free to let us know in the comments section below!
-------------------------------------------------------------------------------
** Please LIKE 👍, FOLLOW ✅, SHARE 🙌 and COMMENT ✍ if you enjoy this idea! Also share your ideas and charts in the comments section below! This is best way to keep it relevant, support us, keep the content here free and allow the idea to reach as many people as possible. **
-------------------------------------------------------------------------------
💸💸💸💸💸💸
👇 👇 👇 👇 👇 👇
BITCOIN Is this the last rally of the Cycle??Bitcoin (BTCUSD) has held its 1W MA20 (red trend-line) to perfection and closed last week in green for the first time after 3 straight red 1W candles.
As discussed in previous analyses, the 1W MA20 is critical to BTC's bullish trend as it is the trend-line that supported every final parabolic rally on its previous Cycles.
Even on the current Bull Cycle, it has been the first (and main) level of Support during the entirety of the 3-year Channel Up. The second one is the 1W MA50 (blue trend-line) and was the ultimate Buy Signal on all three occasions it was hit (or approached), which coincided with a 0.382 Fibonacci retracement test.
Since the last contact the market had with both the 1W MA50 and 0.382 Fib (April 07 2025 Low), Bitcoin has been trading within the Channel's 0.236 - 0.618 Fibonacci range, which is the zone that has dominated the price action for most of the Bull Cycle. It broke below or above it 4 times, twice below it in the early stages of the Channel Up and as the Cycle's strength accelerated, twice above it to form Higher Highs.
Those Higher Highs have been the mid-Cycle 'Profit taking Zones' (red Triangles), where traders/ investors were encouraged to book quarterly profits and wait for a lower buy opportunity o the 1W MA50/ 0.382 Fib Support Cluster.
Once again, this is were we expect this upcoming final BTC rally to peak. Technically, even if we see a highly aggressive rise starting now, this Zone should be at $140k and above. Profit taking is a personal matter to each trader, depending on their risk tolerance and how low/ soon they entered the market, but this chart can serve as a reminder on their profit taking strategy.
So are you booking your profits soon for this Cycle? Feel free to let us know in the comments section below!
-------------------------------------------------------------------------------
** Please LIKE 👍, FOLLOW ✅, SHARE 🙌 and COMMENT ✍ if you enjoy this idea! Also share your ideas and charts in the comments section below! This is best way to keep it relevant, support us, keep the content here free and allow the idea to reach as many people as possible. **
-------------------------------------------------------------------------------
💸💸💸💸💸💸
👇 👇 👇 👇 👇 👇

BTC/USD – FVG Buy Zone Setup Targeting $113KChart Overview (BTC/USD 30m)
Price is currently trading at $110,517.
EMA 70 (111,276) above price → short-term bearish.
EMA 200 (110,598) acting as immediate support zone.
📐 Trend & Channel Strategy
Market is moving inside an ascending channel (support & projection line).
Price recently retraced to the support line → potential bullish continuation.
🎯 Supply & Demand / FVG Strategy
FVG Buying Zone: $109,583 – $110,217 highlighted (strong demand zone).
Entry around this zone expected to trigger a bullish reaction.
📊 EMA Crossover Strategy
EMA70 > EMA200 previously → bullish structure.
Current retest of EMA200 is key → holding above signals continuation to upside.
💎 Price Action Strategy
After strong drop, price tapped into support + FVG zone.
Wick rejection suggests buyers stepping in.
🎯 Target & Risk Management
Target Point: $113,053 – $113,064.
Stop Loss: Below $109,583 (to protect against breakdown).
Risk/Reward ratio looks favorable (approx. 1:3).
✅ Conclusion:
BTC is in an uptrend channel. After retesting the FVG buying zone & EMA200, buyers are likely to push price back toward $113,000 target 🚀📈. A break below $109,583 would invalidate this bullish setup.

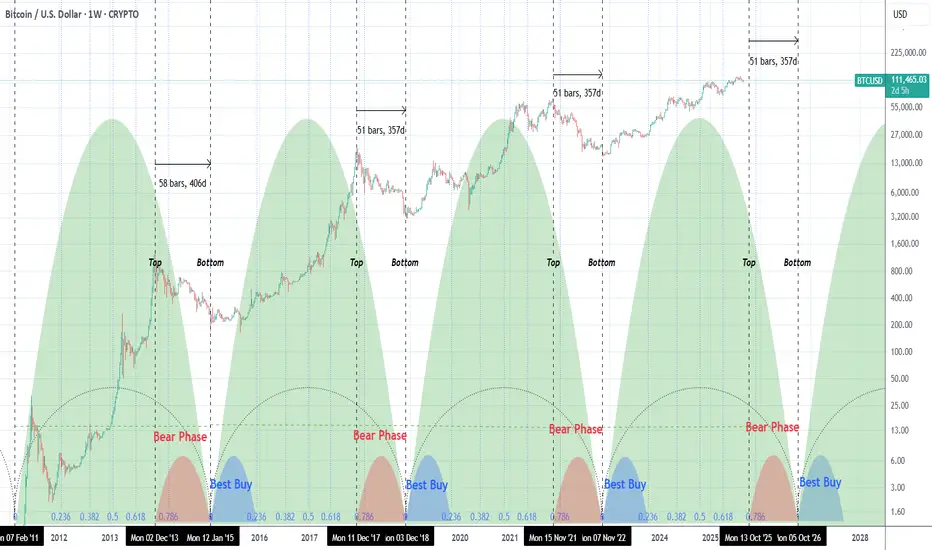
BITCOIN Is the end of the Bull Cycle approaching?Bitcoin (BTCUSD) may be approaching the end of its current Bull Cycle and a few weeks ago we have issued a first reminder of the dynamics of this Cycle in relation to all previous. The historic symmetry is high and this time we've presented it using the Time Cycles and Time Fibonacci levels.
As mentioned on previous studies, measuring the Super Cycle from bottom-to-bottom, the Top tends to be formed around the 0.786 Time Fib. Naturally the distance from the 0.786 Fib and 1.0 is the Bear Phase (red). What follows next is the Bear Buy (blue) of the Bull Phase from Fib 0.0 to Fib 0.236.
What concerns us most at this stage is the fact that 0.786 Time Fib is on the week starting December 01 2025. To make things more alarming, if the next Bear Phase follows the last two that measured 51 days from Top-to-Bottom, since the Super Cycle ends on October 05 2026, the next potential Top of this Cycle could be on the week starting October 13 2025!
Certainly food for thought, surely the current Cycle got derailed/ delayed a few months by Trump's tarrifs but above all this serves as a reminder that booking profits in trading is key. And especially since very few actually manage to do so on Tops.
So are you booking profits for this Cycle or not yet? Feel free to let us know in the comments section below!
-------------------------------------------------------------------------------
** Please LIKE 👍, FOLLOW ✅, SHARE 🙌 and COMMENT ✍ if you enjoy this idea! Also share your ideas and charts in the comments section below! This is best way to keep it relevant, support us, keep the content here free and allow the idea to reach as many people as possible. **
-------------------------------------------------------------------------------
💸💸💸💸💸💸
👇 👇 👇 👇 👇 👇
BITCOIN 4H Bullish Cross formed. Can it sustain a rally to 124k?Bitcoin (BTCUSD) just completed its first Bullish Cross on the 4H time-frame between the MA20 (red trend-line) and the MA50 (blue trend-line). Following a rejection after marginally breaching above the 4H MA100 (green trend-line), this pattern looks very similar to the Bullish Cross of June 25.
Both took place after a strong medium-term correction is the form of Channel Down patterns, with the Bullish Crosses getting formed after a Lower Highs break-out. If fact even the August 07 MA20/50 Bullish Cross led to a strong rally.
As a result, if BTC manages to turn its 4H MA100 into a Support, we expect it to initiate a new rally to test at least the previous High above $124k, similar to the July 03 High test. The 0.786 and 0618 Fibonacci levels can be used as Resistance and Support levels upon break-outs and pull-backs respectively.
So do you think this 4H MA20/50 Bullish Cross can kickstart a new rally? Feel free to let us know in the comments section below!
-------------------------------------------------------------------------------
** Please LIKE 👍, FOLLOW ✅, SHARE 🙌 and COMMENT ✍ if you enjoy this idea! Also share your ideas and charts in the comments section below! This is best way to keep it relevant, support us, keep the content here free and allow the idea to reach as many people as possible. **
-------------------------------------------------------------------------------
💸💸💸💸💸💸
👇 👇 👇 👇 👇 👇

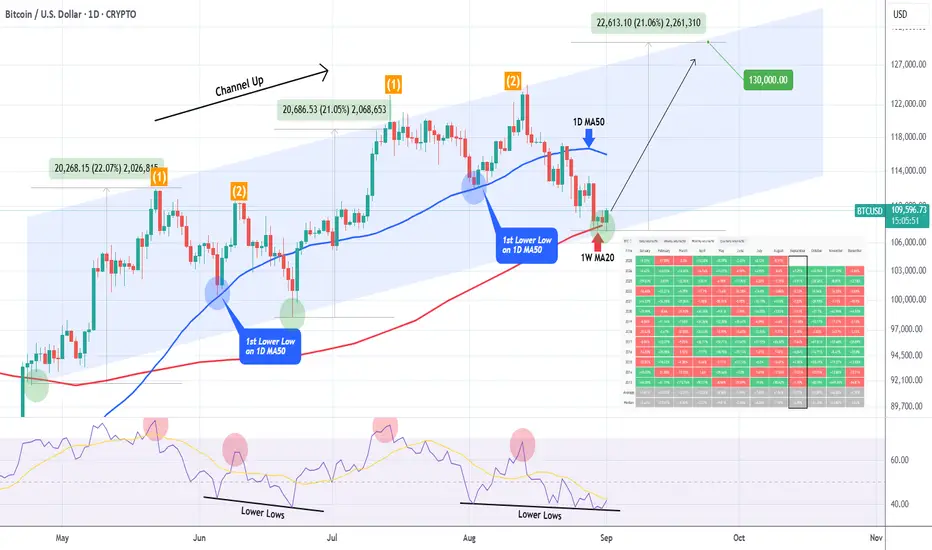
BITCOIN ahead of September crash on historically worst month??Despite the obvious hint of 2 potential rate hikes by the end of this year, Bitcoin (BTCUSD) has found itself on a downtrend. And as today we entered the first day of September, this sentiment is further empowered by one simple statistical fact: that September has historically been BTC's worst performing month.
As this table on the chart shows (source: CoinGlass), September's average returns have been -3.77%, the worst average score out of all months since 2013. An interesting fact however is that out of all the Septembers that ended in green (4), they did so when there was a red August (like the one we just closed at -5.91%). At the same time out of all the times August was red (8) four times September followed in red. This shows that historical probabilities are equally distributed there.
Statistics aside, the market has a strong case of a bottom on the current levels and that's purely a technical one. As you can see, since May 01, Bitcoin has been trading within a Channel Up. This pattern has seen so far two Bullish Legs of almost identical rise (+22.07% and +21.05% respectively) and when they corrected (Bearish Legs), the first Low was on the 1D MA50 (blue trend-line) and the second on the Channel Up bottom.
This time there is an even stronger technical case, as the price hit the 1W MA20 (red trend-line), which as we've shown on a recent study, is a Support level that historically kickstarts the final rallies during Bull Cycles.
Even their 1D RSI sequences are similar, with the indicator currently being on a Lower Lows formation that previously marked the June 22 (Higher) Low.
As a result, assuming we will see the 'minimum' of +21.07% Bullish Leg, we should be expecting a $130000 Higher High, which matches our realistic Cycle Top study, based on most studies we've conducted.
So do you think Bitcoin will again declined this September or we are currently forming a new bottom? Feel free to let us know in the comments section below!
-------------------------------------------------------------------------------
** Please LIKE 👍, FOLLOW ✅, SHARE 🙌 and COMMENT ✍ if you enjoy this idea! Also share your ideas and charts in the comments section below! This is best way to keep it relevant, support us, keep the content here free and allow the idea to reach as many people as possible. **
-------------------------------------------------------------------------------
💸💸💸💸💸💸
👇 👇 👇 👇 👇 👇
BTC/USD Supply Zone Rejection Setup This BTC/USD 30-min chart shows price climbing within a rising channel toward a POI Supply Zone (114,201 – 114,940 USD). The market is respecting both the support line and rejection line while trading above the EMA 70 (111,733) and EMA 200 (112,102), indicating bullish momentum in the short term.
Key Analysis Using Strategies:
Trend/EMA Strategy: Price is above both EMAs, signaling bullish continuation until the supply zone.
Channel Strategy: Price is moving inside an ascending channel; upper channel resistance aligns with the supply zone, suggesting potential reversal.
Supply & Demand: Strong supply zone at 114,201–114,940 is the key resistance area to watch for rejection.
Price Action: After breakout from EMA and minor consolidation, price shows bullish structure with higher highs and lows.
Risk Management: Possible short entry at supply zone (114,201–114,940) with stop-loss above 114,940, and targets near 112,100 and 109,000.
📌 Summary: Short-term bullish toward supply zone, but a potential bearish reversal setup forms at 114,201–114,940 if rejection occurs, with downside targets around 112,100 → 109,000.

BITCOIN The NIGHTMARE BEAR CYCLE fractal that Bulls must avoid!Bitcoin (BTCUSD) has been on a strong correction lately after the August 14 All Time High (ATH) at $124500. Every High since has been sold and the price has found itself below the 1D MA50 (blue trend-line).
Whether that's alarming or not yet, this sequence draws a lot of comparisons with the pattern that led to the Cycle Top on 2021.
As you can see both patterns started off with Lower Highs that pushed the market to a new bottom on Lower Lows. A 1D Death Cross confirmed the bottom formation (along with a 1D RSI bullish divergence on Higher Lows) and BTC started rising aggressively again, flipping both the 1D MA50 and 1D MA200 (orange trend-line) into Supports and forming a Bull Flag on a 1D Golden Cross.
At the end of this sequence in 2021, a Double Top Higher Highs pattern, was what formed the Cycle's Top. Unfortunately for the Bulls' case, this is very similar to the Higher High formation we got on August 14. Even the 1D RSI patterns among those two fractals are similar.
Do you think we are in a similar situation as in late November 2021, which initiated the 2022 Bear Cycle?
Feel free to let us know in the comments section below!
-------------------------------------------------------------------------------
** Please LIKE 👍, FOLLOW ✅, SHARE 🙌 and COMMENT ✍ if you enjoy this idea! Also share your ideas and charts in the comments section below! This is best way to keep it relevant, support us, keep the content here free and allow the idea to reach as many people as possible. **
-------------------------------------------------------------------------------
💸💸💸💸💸💸
👇 👇 👇 👇 👇 👇

Bitcoin Reclaims Support Zone – Potential Move Toward $117KBITSTAMP:BTCUSD is rebounding from a key dynamic support zone within its descending channel, with price action now testing the mid-range of the EMA cloud structure. This bounce suggests potential short-term upside continuation if momentum holds.
✅ Bullish Confluences:
Fibonacci Retracement Support: Price respected the 38.2%–61.8% retracement zone between ~$111,330 and ~$110,218, confirming strong demand.
EMA Cloud Reclaim: Current price action is attempting to reclaim the EMA cluster, signaling improving bullish pressure.
Trend Structure: Short-term higher low forming after the recent sell-off, keeping the possibility of a reversal alive.
Candlestick Reaction: Strong rejection wicks from support levels indicate buyers stepping back in.
🎯 Fibonacci-Based Targets:
TP1 – ~$114,442 (38.2% retracement resistance).
TP2 – ~$115,555 (61.8% retracement / mid-supply zone).
TP3 – ~$117,356 (full retracement / key resistance).
🛡️ Stop-Loss: Just below $110,800 (61.8% support breakdown), invalidating the bullish scenario.
