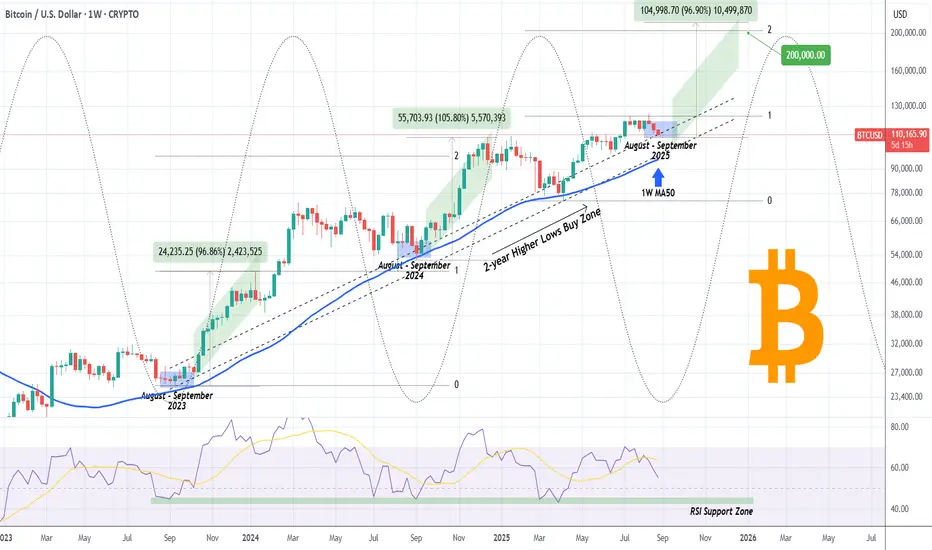
BITCOIN The August-September bottom cheat sheet!Bitcoin (BTCUSD) has just entered its 2-year Buy Zone, which is a Higher Lows belt that has priced its last 3 major bottoms and since the November 2022 Bear market bottom, has been the most optimal long-term buy entry.
A very interesting fact is that the August - September period since 2023 has been such a bottom formation, with the 1W RSI Support Zone, providing an additional confirmation for a long-term buy entry, also present during the March - April 2025 Tariff led correction.
As a result, it is highly likely to start seeing the new Bullish Leg starting by the first 1-2 weeks of September, with the previous two rising by +96.86 and +105.80% respectively. That suggests that BTC could marginally surpass $200k before the Cycle peaks. That would also be just below the 2.0 Fibonacci extension from Aprils Low, similar to the December 2024 High.
So do you think $200000 is possible for this Cycle? Feel free to let us know in the comments section below!
-------------------------------------------------------------------------------
** Please LIKE 👍, FOLLOW ✅, SHARE 🙌 and COMMENT ✍ if you enjoy this idea! Also share your ideas and charts in the comments section below! This is best way to keep it relevant, support us, keep the content here free and allow the idea to reach as many people as possible. **
-------------------------------------------------------------------------------
💸💸💸💸💸💸
👇 👇 👇 👇 👇 👇
Btcusdsignals
Bitcoin - The magical $1.000.000 level!🚀Bitcoin ( CRYPTO:BTCUSD ) is not done yet:
🔎Analysis summary:
Over the course of the past couple of months, we have been witnessing a bullish continuation on Bitcoin. After the all time high breakout, there is a high chance that this bullrun will continue and Bitcoin might even retest the resistance trendline at seven digits in the near future.
📝Levels to watch:
$1.000.000
SwingTraderPhil
SwingTrading.Simplified. | Investing.Simplified. | #LONGTERMVISION

Powell's Speech Sparks Turmoil: BTC Surges and Pulls BackPowell's speech triggered a sharp surge in both BTC and gold 🚀. Amid such significant volatility, many traders will likely see their accounts wiped out 💥. BTC has pulled back today and may continue to drop to around 112,000 before rebounding ↘️↗️
⚡️⚡️⚡️ BTCUSD ⚡️⚡️⚡️
🚀 Sell@ 117000 - 11600
🚀 TP 115000 - 114000 - 113000
Daily updates bring you precise trading signals 📊 When you hit a snag in trading, these signals stand as your trustworthy compass 🧭 Don’t hesitate to take a look—sincerely hoping they’ll be a huge help to you 🌟 👇

BTC/USD Bearish Retest Setup – Eye on 106.6K TargetTrend: BTC is in a downtrend channel (rejection line above, support line below).
EMA Signals: Price is trading below EMA 70 & EMA 200 → bearish bias remains strong.
Supply & Demand:
Support zone: around 112,000 – 112,500 (price just bounced).
RBR Supply zone: 114,300 – 116,000 where sellers are likely waiting.
📊 Strategies in play
Support–Resistance: Bounce at support, retest expected at supply zone.
EMA Strategy: Bearish since candles trade under 200 EMA.
Break & Retest: Price could retest supply before resuming drop.
Target Projection: If rejection at supply holds, target = 106,600 zone (chart target point).
⚖️ Risks
A clean break above 116,000 would invalidate bearish setup and open room for reversal.
Range trading possible between 112k–116k before breakout.
✅ Summary: BTC short-term bias remains bearish. Expect retest of 114.3k–116k supply before continuation lower toward 106.6k target. Only a strong breakout above 116k flips the trend bullish.

BTC recently broke through the descending channel Market picture and sentiment
The price is trading around $114,942, down slightly by about -0.65% on the day. Daily range: high - $115,833, low - $114,583.
The medium-term and long-term trend remains bullish, supported by large capital infusions (ETFs, institutional purchases).
Bernstein analysts suggest that the current bull rally could last until 2027, which is significantly different from the usual four-year cycles.
Support and resistance levels
Resistance:
The nearest zone is $120K-121K, where growth was expected to slow and consolidation.
The long-term target is $135K, and even $150K by 2026, according to analysts' forecasts.
Support:
Multiple bounce point at $110K–112K is critical to maintain bullish momentum.
Nearest technical support at $111.9K, followed by $107.4K and $105.2K.
Technical Momentum and Structure
Consolidation is seen around $113.8K, with volumes rising (to $48B), signaling pent-up interest despite short-term fatigue.
BTC recently broke out of its downward channel, a positive sign. RSI remains favorable, and declining balances on platforms indicate institutional accumulation.
A breakout of $114K could trigger upside potential to $143K (25%) and further to $200K, according to Rosenberg Research.

BTCUSDT H4 MAPPING BTCUSDT Pumping After Trumps Speech So The Main Two Zones Have In This Setup That Btcusd Sell From Bearish Order Block And Buy From Breaker Block Area
Selling Zone 118:500 & 119:500
Buying Zone 114:500 & 113:000
Hope You Understand The Mapping So Follow Us And Boost Our Post For More Trades

BITCOIN Are the 0.5 Fib and 1D MA100 coming to the rescue?Bitcoin (BTCUSD) has been trading within a Channel Up pattern for exactly the past 4 months (since April 22) and the recent correction off its All Time High (ATH) has broken below the 1D MA50 (blue trend-line) for the first time since July 02 and is about to test the 1D MA100 (green trend-line).
The 1D MA100 has been intact since the day the Channel Up started so it is on its own a strong Support. It gets stronger though, considering that this is where the 0.5 Fibonacci retracement level is from its ATH, which is exactly where BTC rebounded (and priced the previous Higher Low) on June 22.
As you can see, there is a very high degree of symmetry among the Bullish and Bearish Legs of the Channel Up and the 0.5 Fib is -11.09% from the recent High, which is again the % correction of BTC's last Bearish Leg.
Notice also the similarities between the Bearish Legs' fractals, being on Lower Highs and Lower Lows. A new Lower Low now, would potentially signal the bottom.
As far as the next Bullish Leg is concerned, based on the previous one, we can expect a rise to the 1.5 Fibonacci extension, which is at $140000.
Do you think history will be repeated once more? Feel free to let us know in the comments section below!
-------------------------------------------------------------------------------
** Please LIKE 👍, FOLLOW ✅, SHARE 🙌 and COMMENT ✍ if you enjoy this idea! Also share your ideas and charts in the comments section below! This is best way to keep it relevant, support us, keep the content here free and allow the idea to reach as many people as possible. **
-------------------------------------------------------------------------------
💸💸💸💸💸💸
👇 👇 👇 👇 👇 👇

Bitcoin: Confident Breakout of $120K — Targets of $125–$135K!• The trend remains bullish: Bitcoin is trading above $117K–118K, has updated its maximum to $124K. Steady growth is supported by growing institutional investments and a softening regulatory environment.
• Key levels:
- Support: $110K–112K — fundamental holding zone. :contentReference
- Resistance*: $120K–123K. A breakout with volume will open the way to $125–134K.
• Technical signals:
- Short-term consolidation after growth of almost 4% — natural rest before the next rebound.
- If BTC consolidates above $125K, there is potential up to $150K.
Bottom line: Bitcoin is demonstrating a consistently bullish sentiment. Holding above $110-112K is critical, a breakout of $120-123K is a signal for growth to $125-134K, and with strong dynamics - to $150K.
Recommendations:
- Buy on dip around $112-115K with targets of $125K+
- Breakout entry** when consolidating above $123K, targets $125-134K
- Stop-loss: slightly below $110K

Shorting BTCUSDT – Strong HTF Bearish Signals in PlayRecent Price Action:
- First Rejection (8/14): Bitcoin was rejected at the previous ATH (~$102.3K).
- Second Rejection: Price failed to surpass the secondary swing high (~$122.4K), leading to a sharp drop (liquidation of buy orders).
- Rebound Attempt: Price dipped to $106.8K, filling the CME gap and likely triggering short-term short liquidations over the weekend. However, the rebound lacked sustainability.
- Breakdown Confirmation: On Monday’s market open, BTC broke below key support, extending the drop to the 0.786 Fib level (~$114.6K).
Market Structure Shift (Higher Timeframe Confirmation):
- The breakdown invalidated the prior bullish structure on H4+ timeframes, confirming a bearish bias.
- The inability to hold above key levels and the liquidation-driven moves suggest weakening demand.
Short Setup Opportunity:
- Ideal Entry Zone: 116.8K - 117K
- SL: ~118k
- TP: ~112k
- Confluence: 0.618 Fib retracement from recent swing high.
Rejection at this zone would further validate bearish continuation.

BITCOIN 2020 fractal gives huge buy signal now.Bitcoin (BTCUSD) broke below its 1D MA50 (blue trend-line) emphatically for the first time in 2 months, sounding short-term fear alarms ahead of the key macroeconomic news of this week. The 1D RSI hit 40.00 however, which has been an automatic buy on both major recent lows (August 01 and June 21).
Short-term aside, it is a fractal from BTC's last Cycle in 2020 (chart on the right) that perhaps offers the most comprehensive long-term outlook, which is what has always helped us maintain an objective, stress-free perspective.
As you can see, both today and 2020 fractals display not only similar price actions but also RSI sequences. Even though naturally the 2020 rebound on the Pivot trend-line has been way more aggressive as the market was still recovering and adjusting the price from the COVID crash, today's price action display's similar phases but in a more sustainable rise.
Based on the RSI fractals, we could be in similar phase as early December 2020. This suggests that there is still upside potential that may extend to as high as 150 - 170k before this Cycle is over.
Do you think that this is a solid Profit Zone for the Cycle? Feel free to let us know in the comments section below!
-------------------------------------------------------------------------------
** Please LIKE 👍, FOLLOW ✅, SHARE 🙌 and COMMENT ✍ if you enjoy this idea! Also share your ideas and charts in the comments section below! This is best way to keep it relevant, support us, keep the content here free and allow the idea to reach as many people as possible. **
-------------------------------------------------------------------------------
💸💸💸💸💸💸
👇 👇 👇 👇 👇 👇

BTC: Rebound Imminent, Go LongBTC today broke below 115000, then rebounded right away 📉→📈. The rebound will keep going and retest 120000—now’s a solid chance to go long! 🚀
⚡️⚡️⚡️ BTCUSD ⚡️⚡️⚡️
🚀 Buy@ 115000 - 115500
🚀 TP 117000 - 118000 - 119000
Daily updates bring you precise trading signals 📊 When you hit a snag in trading, these signals stand as your trustworthy compass 🧭 Don’t hesitate to take a look—sincerely hoping they’ll be a huge help to you 🌟 👇

BITCOIN Below its 1D MA50. Is there any Support?Bitcoin (BTCUSD) broke today below its 1D MA50 (blue trend-line) for the first time since July 02, having previously rebounded on it (August 02) on a perfect technical bounce that delivered a new All Time High (ATH).
Naturally, the 1D MA50 is the first medium-term line of Support and last time it broke convincingly, the price found a bottom (June 22) closer to the 1D MA100 (green trend-line). That was during BTC's previous Accumulation Phase of the 4-month Channel Up.
If that pattern is repeated, then Bitcoin's next Support could be within 112000 - 111000. On top of that, it would be useful to keep an eye on the 1D RSI, which is printing a pattern similar to he previous Accumulation Phase that bottomed on the 39.00 level.
As far as the next High is concerned, if it repeats the +22.72% rise that the previous Bullish Legs delivered from the 1D MA50 contact, then we're potentially looking at $137000 as the pattern's next Higher High.
So what's your view? Do you think the 1D MA100 will come to BTC's rescue and push it to $137k? Feel free to let us know in the comments section below!
-------------------------------------------------------------------------------
** Please LIKE 👍, FOLLOW ✅, SHARE 🙌 and COMMENT ✍ if you enjoy this idea! Also share your ideas and charts in the comments section below! This is best way to keep it relevant, support us, keep the content here free and allow the idea to reach as many people as possible. **
-------------------------------------------------------------------------------
💸💸💸💸💸💸
👇 👇 👇 👇 👇 👇

BTCUSD:The meeting will likely impact further declines.Amidst uncertain news, BTCUSD is less favored than XAUUSD. After the Asian market opened, BTCUSD experienced a significant drop, exceeding 3000p. Assuming the meeting has not concluded, uncertainty will cause BTCUSD to fall further. Short-term short selling is likely to continue.

BTCUSD: buyBTCUSD's performance is consistent with my expectations. It has rebounded slightly from the bottom and is currently trading at 118,200, representing an overall rebound of approximately 1,000p. Based on the trend, it's still at the bottom. It's still a safe bet to buy.
There was no major news in the market over the weekend that had an impact on trading products. While the meeting news wasn't clearly positive or negative, there was some progress in increasing holdings in the world's largest gold ETF, increasing by approximately 4 tons compared to the previous day. Furthermore, the Federal Reserve's interest rate decision will be announced next week. These two factors appear to be influencing gold prices and warrant our attention.
BTCUSD traders can choose to take some long positions during the holiday. Gold traders can enjoy the holiday and revisit more trading opportunities next week.

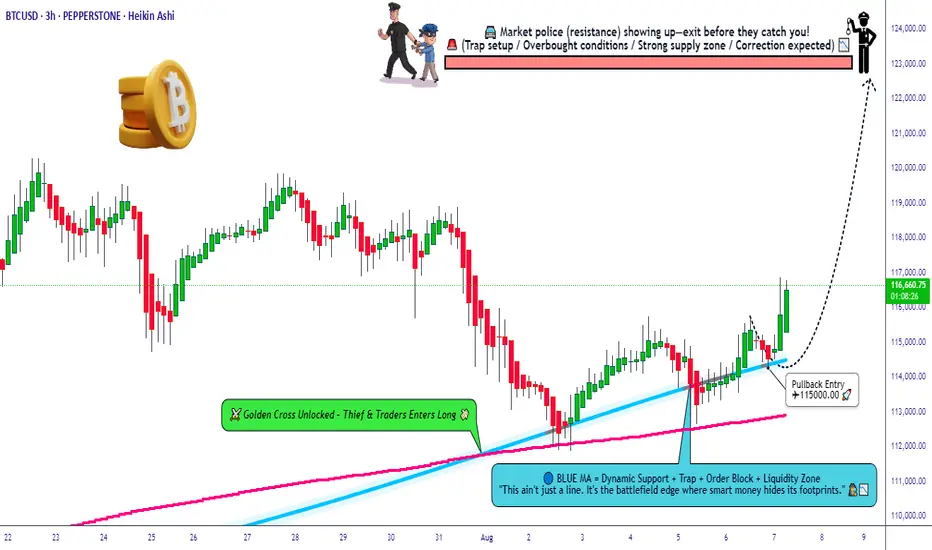
Can the Thief Rob BTC Pullback Before the Police Arrive?🚨 BTC/USD 💰 Bitcoin Breakout Heist Plan – Robbers in Action 🚀 🚨
Asset: BTC/USD “Bitcoin vs U.S. Dollar” — Crypto King Market
📊 Plan: BULLISH BREAKOUT RAID
🎯 Target: 123,000.00 🎯 — Police Barricade Resistance + Overbought Trap Zone
🔒 Entry: ANY PRICE LEVEL — Thief avg pullback entry at 115,000.00
🛑 Stop Loss: 113,000.00 — Below the Laser Tripwire
🎩 Thief Entry Blueprint 🕵️♂️
The vault’s trembling. The thief’s not waiting.
Layered limit orders are being deployed like smoke bombs — we strike anywhere, anytime, with stealthy precision. No begging for dip, we rob it raw. 💣🧨
📉 Risk Protocol Setup 🛡️
SL: Under local support – cut fast if alarms trigger.
Risk light, rob heavy. Use tight stops or trailing guards to escape with the loot.
📈 Why Rob Long?
Bullish momentum building like a pressure cooker 💥
Resistance zones turning into trapdoors for late bears 🐻
Liquidity pools above — ripe for raid
Sentiment flips, on-chain signals, and macro tailwinds align ⚡
📌 Robbery Reminders:
NO SHORTING — This is a one-way heist 🚷
Avoid news-time chaos ⛔
Use multiple entries (layer style) and escape plans.
Overbought ≠ exit — it’s the bait for the next raid 🧠
💖 LIKE = SUPPORT THE CREW
Every like boosts the Thief Trader movement — more heat, more setups, more wins.
Smash Boost. Share the Heist. Stay Robbing. 🐱👤📈🔥
🔔 Stay tuned. Next breakout blueprint dropping soon.
BTCUSD: BUYBTCUSD's performance over the weekend was very weak, with fluctuations of only about 1,000p. However, it is currently in the process of bottoming out, and a rebound is possible at any time. Therefore, despite the sluggish market over the weekend, investors who want to trade can still choose to buy BTCUSD and profit.

BITCOIN The vast importance of the Pivots. Is $180k possible?Bitcoin (BTCUSD) is most likely starting the new Bullish Leg of this Cycle, as stated on our recent analysis following the 1D MA50 (red trend-line) rebound.
Today we point out the critical role of Pivot trend-lines, which throughout the entirety of the current Bull Cycle, have provided a Support level and initiated massive rebounds.
Those Bullish Legs not only tend to be similar in strength (+60% to +92%) but the time between their starts is roughly the same (39 to 46 weeks).
Given also the fact that the 1W RSI has printed the same kind of consolidation it always forms when such a Bullish Leg started, we do expect a strong rally next, which if the +60% minimum rise holds, may very well be as close as $180000.
So do you think BTC can reach $180k before this Cycle is over or it's too high? Feel free to let us know in the comments section below!
-------------------------------------------------------------------------------
** Please LIKE 👍, FOLLOW ✅, SHARE 🙌 and COMMENT ✍ if you enjoy this idea! Also share your ideas and charts in the comments section below! This is best way to keep it relevant, support us, keep the content here free and allow the idea to reach as many people as possible. **
-------------------------------------------------------------------------------
💸💸💸💸💸💸
👇 👇 👇 👇 👇 👇

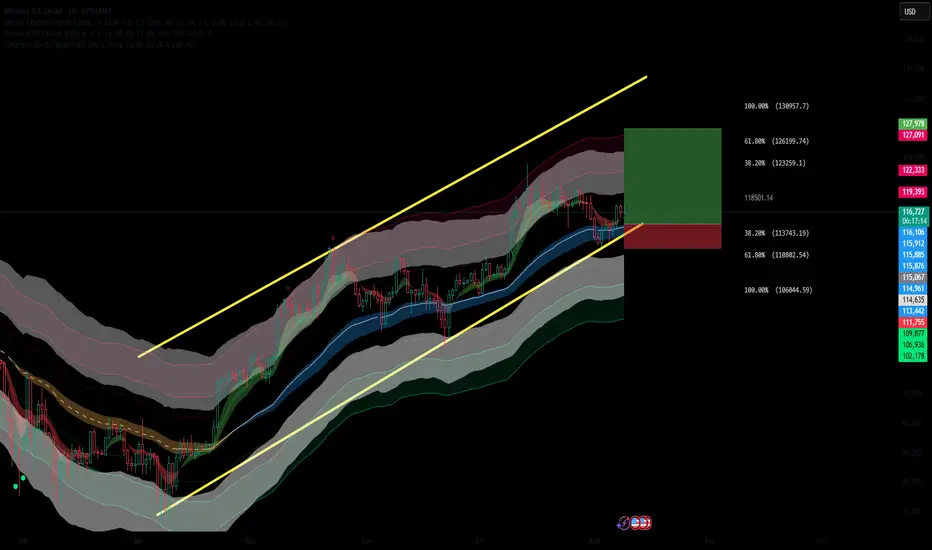
BTC Holding Strong: Fibonacci Levels Point to $130KBITSTAMP:BTCUSD is holding above a key dynamic support zone at the lower boundary of its ascending channel, with current price action signaling a potential continuation to the upside. This long setup is supported by multiple bullish confluences.
✅ Bullish Confluences:
Fibonacci Retracement Support: Price respected the 38.2%–61.8% Fib retracement zone between $113,769 and $110,828, confirming a strong demand area.
Trend Structure: Clear higher low formation on the daily chart, maintaining the bullish channel pattern.
EMA Cloud Support: Price remains above the multi-band EMA cloud, showing sustained bullish pressure and trend bias.
Channel Support: Bounce from the ascending channel’s lower trendline, keeping structure intact.
Bullish Candlestick Formation: Daily candle holding above key support with buying pressure evident.
Ideal entry would be between 113k and 114500.
🎯 Fibonacci-Based Targets:
TP1 – $123,285 (38.2%): Initial resistance and reaction zone.
TP2 – $126,225 (61.8%): Mid-extension target, aligns with prior swing high zone.
TP3 – $130,983 (100%): Full measured move to the channel top.
SL: Placed just below the 61.8% retracement (~$110,800), protecting against a breakdown of the bullish structure.
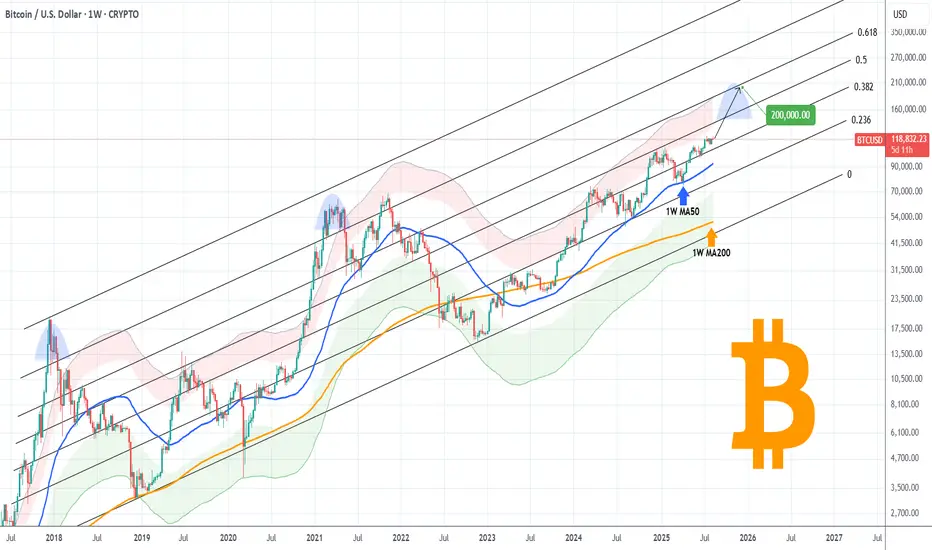
BITCOIN Can it break above this 3-year Resistance and hit $200k?Bitcoin (BTCUSD) is extending its main 1W MA50 (blue trend-line) fueled rebound, which only recently confirmed the continuation with a short-term bounce on the 1D MA50. The short-term setting is transferred now back to the long-term and the next Resistance, which is the middle (0.5 Fibonacci level) of the macro Channel Up, that has been dominating BTC's price action since late 2017.
The 0.5 Fib has made its last rejection/ failed attempt to break on December 16 2024. It's been holding as a Resistance since May 02 2022. The last two Cycle Tops however haven't only been priced above the 0.5 Fib but above the 0.786 level too (obviously as close to the Channel Top as possible).
As a result, if BTC does break above the 0.5 level, a 'mere' test of the immediate upper Fib (the 0.618) could be translated by the end of the year (timing of Cycle Top) to a $200k test. That would also be a test of the Top of the 1st SD above (red Zone) of the Mayer Multiple Bands (MMBs), which is technically still within high tolerance levels.
So do you think we can get near $200k by the end of the year if the 0.5 Fib breaks? Feel free to let us know in the comments section below!
-------------------------------------------------------------------------------
** Please LIKE 👍, FOLLOW ✅, SHARE 🙌 and COMMENT ✍ if you enjoy this idea! Also share your ideas and charts in the comments section below! This is best way to keep it relevant, support us, keep the content here free and allow the idea to reach as many people as possible. **
-------------------------------------------------------------------------------
💸💸💸💸💸💸
👇 👇 👇 👇 👇 👇
Bitcoin - The cycles are playing out!⚔️Bitcoin ( CRYPTO:BTCUSD ) just repeats another cycle:
🔎Analysis summary:
Following all of the previous all time high breakouts, Bitcoin will now further extend the rally. After some simple calculation, we can see that Bitcoin will rally another +50% in order to reach the overall price target. However there will be volatility along the way so make sure to remain calm.
📝Levels to watch:
$200.000
SwingTraderPhil
SwingTrading.Simplified. | Investing.Simplified. | #LONGTERMVISION

BITCOIN Can $160k be the Top???Bitcoin (BTCUSD) closed last week on strong bullish fashion as it completed a formidable green 1W candle following a technical bounce on its 1D MA50 (red trend-line). This is a strong bullish signal as every time the (orange) Fibonacci Channel rebounded on its 1D MA50 after a 1W MA50 (blue trend-line) bounce, BTC extended the uptrend towards a new technical Higher High.
Based on the 1W LMACD, we could be roughly half-way (blue circle) through such a Bullish Leg. As you can see, those Bullish Legs have typically made rounded Tops (red Arcs), with the last two both breaking above the Fib Channel's 0.236 level. At the same time, on the horizontal Fib level, the sequence has applied significant importance to every .618 and .0 interval, with peaks on the 0.618, 1.0, 1.618, 2.0, 2.618. Now what's left realistically before the end of the Cycle at the end of the year are 3.0 and 3.618.
As a result, a rather modest potential Top projection is $160000, which is even conveniently placed just below the 0.236 Channel Fib from late October onwards.
Do you think that could be a potential Cycle Top candidate? Feel free to let us know in the comments section below!
-------------------------------------------------------------------------------
** Please LIKE 👍, FOLLOW ✅, SHARE 🙌 and COMMENT ✍ if you enjoy this idea! Also share your ideas and charts in the comments section below! This is best way to keep it relevant, support us, keep the content here free and allow the idea to reach as many people as possible. **
-------------------------------------------------------------------------------
💸💸💸💸💸💸
👇 👇 👇 👇 👇 👇

BTC is heading to $130k+After 4 weeks of consolidation and strong liquidity grab from the weekly support BTCUSD started to rise to the upside with a bullish trend continuation showing possible upside bias. As 4h bull flag has broken the support and price started to trend, we may see this instrument reaching to $130k+?
A possible bullish trade is high probable!!

BTC perfectly hits $120K, latest BTC analysis and operations#BTCUSD
After nearly a week of volatile consolidation, BTC once again touched around 120,000. I have already made it clear to everyone before that once BTC stabilizes above 116,500, it may first touch 118,000 and then challenge the macro resistance level of 120,000. I think anyone who had carefully reviewed the strategy and thought seriously about the ideas behind it would have made substantial profits. Currently, BTC maintains an overall upward trend, but may face the risk of an overbought pullback in the short term. Those with sufficient funds in their accounts can consider shorting with a light position. BTC may reach 118,000-117,000 and stabilize before rebounding.
