$BTC - Market UpdateBINANCE:BTCUSDT | 1D
In our November 12 outlook, we noted that if price formed another lower high and failed again below the 107k resistance, momentum could fade quickly. That scenario played out: Bitcoin broke below the 102k support and slid into the 89k zone.
From here, if the current low holds, the next area that must be reclaimed is 92–93k. Buyers need to step in, a move back below this level increases the risk of a breakdown toward the 84k–82k region.
If price can stabilize and build a base here, upside hurdles to watch are 96–97k, followed by 100k and 107k (swing point)
BTCUSDT

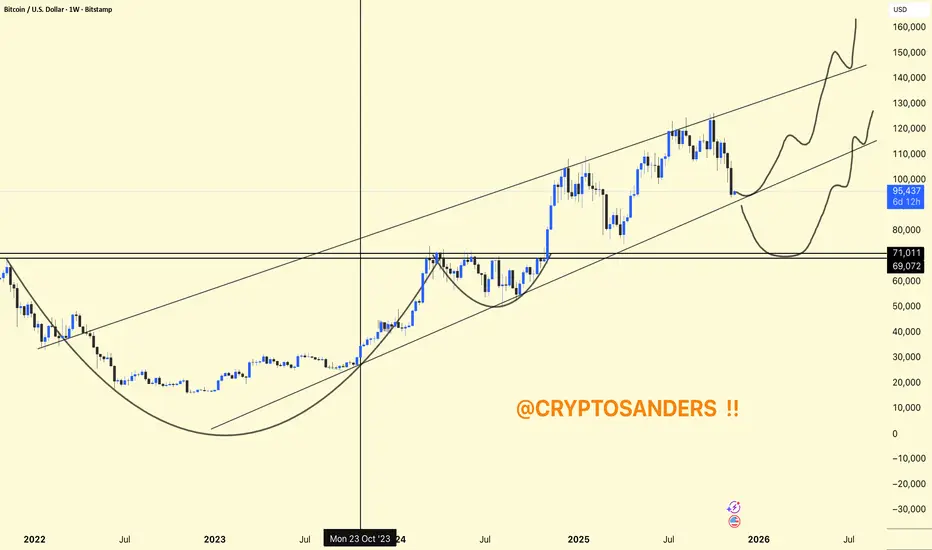
BTC Weekly View !BTC / USD
Bitcoin (BTC) followed my previous analysis on October 30th, dropping from $110,000 to its current price of $96,000. check here
What's Next?
Take a Look at the weekly chart:
Bitcoin is currently at a "do or die" support level (trend line + 50-week moving average).
This moving average has been a turning point in previous cycles.
If the price breaks below this level, it will confirm a mid-term bear trend with minimal target around 74k so keep an eye on this chart.

BTC Approaches 89,256Hello, traders and investors!
This analysis is based on the Initiative Analysis (IA) method.
Bitcoin’s price is getting closer to the 89,256 level.
Yesterday, November 17, the daily candle closed as a seller candle.
The volume was accumulated in the upper part of the candle, and the candle itself showed increased volume.
In this configuration, a continuation of the seller’s move is quite likely.
Wishing you profitable trades!

Bitcoin Below $100K: Eyeing the 60-Day Cycle LowBitcoin is heading below $100K and is on track to hit its 60-day cycle low - a predictable bottom that repeats like clockwork. What makes this one extra interesting? It’s aligning with the weekly cycle low, setting the stage for a sharp reversal.
All major indicators are flashing “bottom incoming” between now and November 24th. History shows that buying near these cycle lows can pay off big. If Bitcoin holds, the next target is a clean retest of $117K, which is roughly an 18% upside from current levels.
Mark my words: November could be the pivot month. Once the bottom is in, we can expect a massive bullish run through December and January, with Bitcoin targeting $135K–$150K.
And don’t sleep on altcoins - they’ll likely start outperforming BTC early next year as the rotation kicks in.
✅ Bottom line: If you’re not watching this cycle, you’re missing a prime entry point. Bitcoin is setting up for a breakout.

BTC TO 94k BEFORE 140k TOP?I don't think the bull run is over, but I do see BTC going below 100k to 93-94K area.
Will look to add a buy limit in this area because I believe it will retest that area before creating the last leg up to ATH and top of the bull market, which I believe to be around 140k-160k BTC.
Regardless, BTC is the best asset class of this generation and I'll continue to DCA into it for my long term bags.

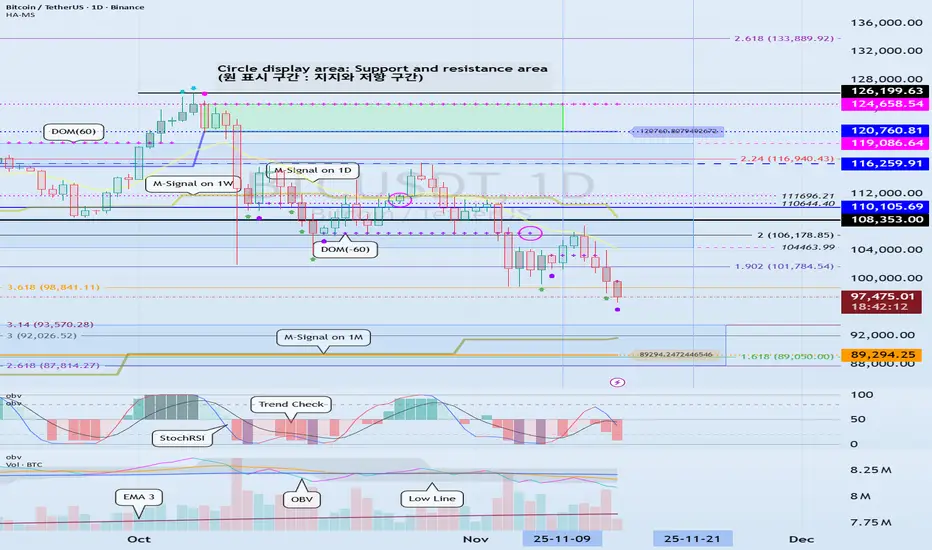
Check for support near the M-Signal indicator on the 1M chart
Hello, fellow traders!
Follow me to get the latest information quickly.
Have a great day.
-------------------------------------
(USDT 1D Chart)
(USDC 1D Chart)
USDT is the major currency that influences the coin market.
The USDT and USDC charts are moving in opposite directions.
This decline appears to be driven by funds flowing out of USDC.
Once the USDC gap decline stops, funds flowing in through USDT are expected to drive the coin market higher.
-
(USDT.D 1M Chart)
For the coin market to show an upward trend, USDT dominance must remain below 4.91 or show a downward trend.
We need to see if the price can face resistance around the Fibonacci level of 0.618 and turn downward.
If not, we should consider a response plan, as a rally toward 7.13 is expected.
-
(BTC.D 1M chart)
For an altcoin bull market to begin, it must either remain below 55.01 or show a downward trend.
Therefore, for the bull market we're waiting for to occur, both USDT dominance and BTC dominance must decline.
If USDT dominance declines while BTC dominance rises, a bull market will emerge, with only BTC rising.
--------------------------------------------------
(BTCUSDT 1D Chart)
The key is whether the price can touch the M-Signal indicator on the 1M chart and turn bullish.
At this point, it's crucial to maintain the price above 89294.25.
If not, a step-down trend is likely.
To turn bullish, the price must remain above the M-Signal indicator on the 1W chart.
At this point, it's crucial to maintain the price above the newly created HA-High indicator point of 110105.69 on the 1M chart.
If not, the price may pretend to rise but then fall again, so you need to consider countermeasures.
This is a basic trading strategy within the box range: buy between DOM(-60) and HA-Low and sell between HA-High and DOM(60).
If the price rises in the HA-High ~ DOM(60) range or falls in the DOM(-60) ~ HA-Low range, you should switch to trend trading.
To do this, we should consider the movements of the StochRSI, TC (Trend Check), and OBV indicators.
To sustain the uptrend after breaking above a key point or range, the StochRSI, TC, and OBV indicators must show upward trends.
At this point,
1. The StochRSI indicator should not have entered an overbought zone.
2. The TC indicator should remain above zero.
3. The OBV indicator should remain above the High Line.
Therefore, check the movements of the StochRSI, TC, and OBV indicators at the support and resistance levels depicted on the 1M, 1W, and 1D charts and consider whether you can trade accordingly.
Based on the current price range, the key points or ranges are:
- 87814.27-93570.28
- 110105.69
- 120760.81-124658.54
I believe the three ranges above are important points or ranges.
Therefore, when the price is near these ranges, you should check the movements of the StochRSI, TC, and OBV indicators to determine a response plan.
-
Thank you for reading to the end.
I wish you successful trading.
--------------------------------------------------
- This is an explanation of the big picture.
(3-year bull market, 1-year bear market pattern)
I will explain in more detail when the bear market begins.
------------------------------------------------------
BTC Slips Below 50 EMA: Caution RequiredThings could get uglier as CRYPTOCAP:BTC has now broken below the 50 EMA, a key long-term dynamic support level.
This breakdown signals growing weakness and may open the door for deeper downside if buyers don’t step in soon.
DYOR, NFA

Bitcoin - This chart is crumbling!⛔️Bitcoin ( CRYPTO:BTCUSD ) creates a massive top:
🔎Analysis summary:
All the previous cycles on Bitcoin have been lasting about 1,000 days. And exactly three years ago, Bitcoin retested the previous all time high, starting the next bullrun. If we soon see bearish confirmation on Bitcoin, this crypto will lead to another insane bloodbath.
📝Levels to watch:
$100,000 and $50,000
SwingTraderPhil
SwingTrading.Simplified. | Investing.Simplified. | #LONGTERMVISION

BTC Short-Term Weakness PersistsBTC continued to decline last week, not only breaking below key support levels but also erasing all its year-to-date gains. Affected by multiple factors including capital outflows, macroeconomic conditions and technical trends, the short-term market remains in a bear-dominated weak pattern.
Today, Bitcoin opened near the bottom and staged a slight rebound, but the technical picture still shows a clear bearish dominance with downward momentum not yet fully exhausted. The previous key support level of 94,000 has been breached, and the next support lies around 92,800. If this level is broken, the price may fall further. On the upside, short-term resistance is concentrated in the 98,000-100,000 range, and a breakthrough in the short term is highly challenging.
Sell 96,000 - 97,000
SL 98,000
TP 94,000 - 94,500
Buy 92,800 - 93,500
SL 92,000
TP 94,500 - 95,000

#BTC/USDT Broke the support. Levels to watch...💬 Bitcoin Update:
Unfortunately, the previous BTC setup has been invalidated — BTC broke the support.
The next major support levels are $90.3K and $86.5K.
If BTC breaks $90.3K, there’s a strong chance of a sharp bounce from the lower support zone.
The best move right now is to observe how the price reacts; no need to take unnecessary risks when things look uncertain.
You can look for short opportunities on relief bounces, but personally, I’d rather wait for a clearer setup.
As always, do your own research and make your own decisions.
If you found this helpful, please hit the like button ❤️
Thank you.
#PEACE ✌️

BTC Daily View 17.11Hey friends! How’s your trading week starting off?
In my last Bitcoin post, I shifted my invalidation zone from 96,600 to 95,545 and said that if 95,545 breaks, then 96,600 won’t hold either.
Well… it broke — so I revisited the chart.
Now I think the correction after the drop should be bigger than I first expected.
For now, I’m looking at a move up toward 98,400, and then a possible continuation of the downtrend.
I still see two paths — along the orange and purple arrows.
❌ Invalidation zone: 94,850
⚠️ Not financial advice — just sharing my view.
Trade your own plan, always use stops.
⭐ Follow for updates
💬 Drop a reaction in the comments!

How much will Bitcoin fall?Bitcoin's future scenarios
Which scenario do you think is more likely?
Pay attention to levels and pricing
They can be decision points

BTCUSDT Weekly Chart Analysis !BTCUSDT Weekly Chart – Full Analysis
Bitcoin is trading within a long-term rising channel, maintaining higher highs and higher lows over multiple years.
Recent Structure: After a powerful uptrend, BTC is currently retesting the midline of the channel as support, which aligns closely with historical breakout levels.
Chart Patterns: Two notable cup-and-handle formations are marked, suggesting strong accumulation phases followed by aggressive rallies. Both patterns played out bullishly with price surges.
Immediate support is in the $90,000–$95,000 region (lower channel line). If lost, deeper support lies around $71,000–$69,000.
BTC holds this channel and midline; the upside path targets $140,000–$160,000 based on the channel ceiling.
A breakdown would likely cause a deeper retrace, with potential demand return at lower horizontal supports.
Short-term volatility is likely, but as long as the major uptrend and channel structure remain intact, BTC is poised for higher targets into 2026.
BTC's weekly chart is still constructive, with a bullish long-term structure, but critical support is being tested. Holding this range could set up for a continuation to new all-time highs, while a breakdown would mean a deeper consolidation first.
DYOR | NFA
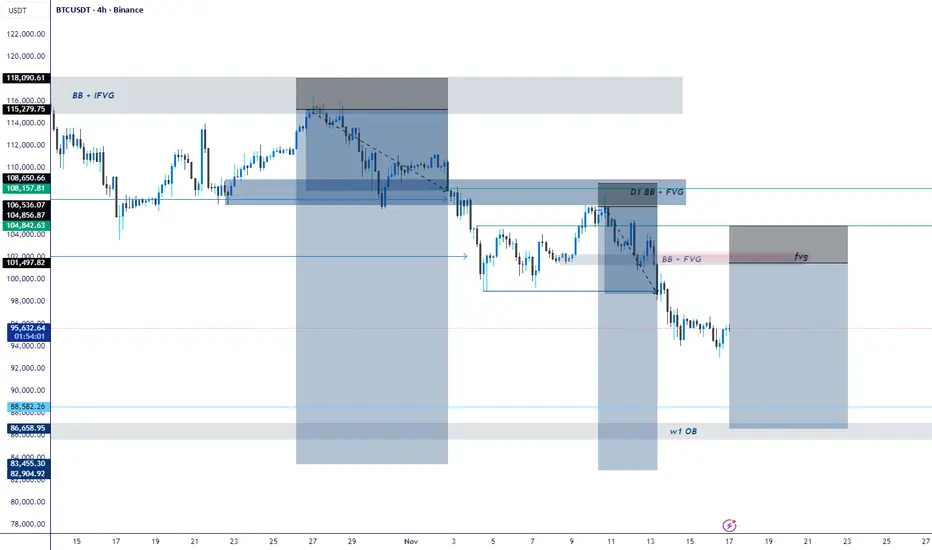
BTC Outlook: Premium Rejections, Clean Drawdown Targets, and KeyBTC continues to respect the higher-timeframe bearish order flow. Price tapped into the Daily Bearish Block + IFVG around the $104K–$108K premium zone, delivered displacement, and broke structure to the downside.
From there, the market formed a clean 3H Supply (BB + FVG) where sellers aggressively re-entered. Price rejected that imbalance and continued the markdown phase.
Structure remains bearish with lower-highs and lower-lows being printed. Current PA is consolidating below key structure, signaling that liquidity is being engineered for the next leg.
We still have an unmitigated Weekly OB at $83K–$86K, which aligns with the macro drawdown target. This zone remains the highest-probability area for a deeper corrective bounce.
K ey Levels
Premium Rejection Zone: $104K – $108K
3H Supply + FVG: $98K – $101K
Immediate Support: $92K – $95K
Major HTF Demand (Weekly OB): $83K – $86K
What I Expect Next
Retracement into the 3H FVG / inefficiency before another sell-off.
Liquidity below $92K likely to be swept.
High-probability macro reaction once price taps the weekly OB.
---------------------------------------------------------------------------------------------------------------------
CONFIRMATION ENTRY (Safer Approach)
Use this for precise execution:
Mark the 3H/1H supply zone.
Wait for price to tap the zone → no instant entries.
Drop to M15/M5 and wait for a clear CHOCH (shift) or BOS confirming sellers.
Enter on the pullback into the refined OB or FVG.
SL above the M5 POI that caused the break.
First TP at relative equal lows or clean inefficiencies.
This keeps you out of premature entries and filters manipulation.
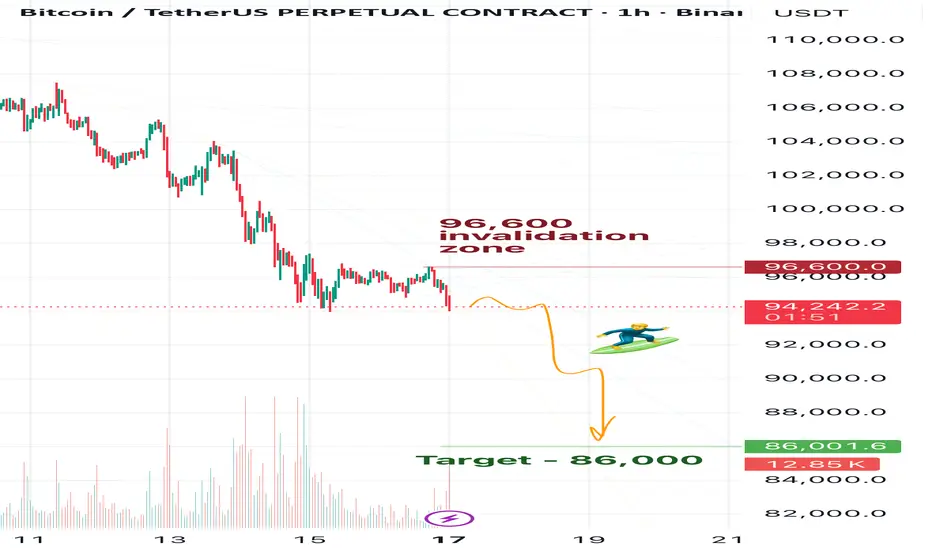
BTC Daily View 17.11Friends, as you may remember from my previous Bitcoin updates, I’m expecting BTC to reach 83k. At the moment, in my view, Bitcoin is already preparing for this move down.
However, for now my main target is 86k — I think BTC currently has enough momentum only to drop to that level. Before we see 83k, it will likely need to build more energy.
So after hitting 86k, I expect a correction — probably a prolonged one. But let’s see what the market gives us.
🎯For now, my target remains 86k.
❌Invalidation zone: 96,600
⚠️Disclaimer:
This is not financial advice. Please make your own decisions according to your own trading rules, and never trade without stop-losses.
🗯️If you find my ideas helpful, please leave a reaction and write a comment — your support really matters to me
A GOLDEN STORM IS COMING!Hello my dear trader friends,
I’m back with the continuation of the XAU/USD analysis.
In the previous analysis, I mentioned that gold had reached a resistance zone and we expected a price correction. Gold reacted beautifully to the zone and entered a correction phase. Now we must see whether this correction will continue or not.
Next week, the U.S. government shutdown will end, and we also have the Federal Reserve meeting and the PMI report. So a stormy week is ahead of us — get ready for a volatile ride.
Our profit from this analysis: 1000 pips
Follow me to hear and see the rest of gold’s story.

BTC/USDT: Bullish Divergence Forms at 92K Support ZoneBTC/USDT is testing the 92,000 key support, a level that previously triggered a major reaction. A bullish divergence is forming as price compresses at the bottom of a downward channel, hinting at a potential corrective rebound.
If buyers defend the zone, a move toward 100,500 resistance is likely. While overall momentum remains bearish, the divergence supports a short-term bullish swing before the broader trend resumes.
❗️ Risks:
– Break below 92,000 opens deeper downside.
– Macro trend continuation may invalidate divergence.
– Failure at mid-range resistance could cap the rally early.

$BTC Oversold Bounce Setup at Cycle Lows?BINANCE:BTCUSD CRYPTOCAP:BTC Oversold Bounce Setup at Cycle Lows? 📈
Altcoin Pioneers! The daily BTC/USD chart is coiling at that blue descending channel's lower bound (~95k), with price flashing oversold signals after the brutal slide from April highs (~144k). That green arrow hints at reversal potential—volume's contracting, but a hammer wick at lows screams buyer interest.
Hold support? Prime odds with RSI dipping to 25 (bullish divergence brewing). Breakout above resistance? Catalyst needed for 100k test; close >98k flips bias. Deeper dip risk? Low unless yields spike, eyeing 90k floor.
Target: Rally to 102k on confirmation, or retest 92k on fakeout. Tracking: Stochastic for crossovers, on-balance volume, and spot ETF flows. Momentum shift incoming? 👀
#BTCReversal #CryptoDaily #TradingSignals

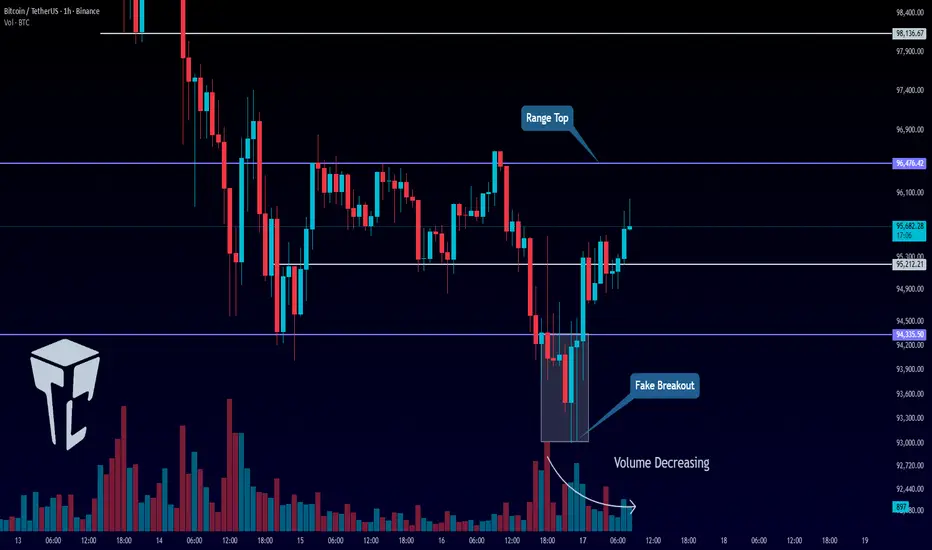
TradeCityPro | Bitcoin Daily Analysis #223👋 Welcome to TradeCity Pro!
Let’s dive into the Bitcoin analysis. Yesterday, Bitcoin made a fake downward move and is now back in its range box.
⏳ 1-Hour Timeframe
Yesterday, the short triggers we had at 95,212 and 94,335 were activated, and the price moved slightly downward. However, this bearish move turned out to be a fakeout, and the price started moving upwards again.
✅ Currently, the price has moved above 95,212 and managed to stabilize above this level. The next resistance zone for Bitcoin is at 96,476.
⚡️ The 96,476 zone was faked yesterday, and after a candle closed above it, the price moved downward. Now, we need to wait for the price’s next reaction to this level to refine the exact breakout point.
✨ After this encounter, we can open a risky long position if the level breaks on the next attempt. The next target above this level is 98,136.
📊 For a short position, since the price faked the bottom of the range, the chart is a bit messy. I personally prefer to wait for the price to establish more structure and for a new trigger to form. We can then open a new position upon the breakout of the next trigger.
💼 For previously opened short positions, we can move the stop loss above the 96,476 level.
❌ Disclaimer ❌
Trading futures is highly risky and dangerous. If you're not an expert, these triggers may not be suitable for you. You should first learn risk and capital management. You can also use the educational content from this channel.
Finally, these triggers reflect my personal opinions on price action, and the market may move completely against this analysis. So, do your own research before opening any position.
Bitcoin MULTI supportsat $94 on weekly , looks like Bitcoin has many support-lines which could make it bullish to $118k again

BTCUSDT Review November 17 2025Short-term price movement ideas.
Price has filled the monthly long FVG, which acts as a strong support zone and can trigger at least a corrective move. At the moment, after filling the FVG, we received a daily liquidity grab to the long side, with the next objective being the daily short FVG.
Following the liquidity sweep, a 4H FVG is forming. If price returns to test this 4H FVG and we get confirmation on lower timeframes, then a long position setup can be considered.
Be flexible, adapt to the market, and the results will come quickly. Good luck to everyone.

The logic for going long on BitcoinETF outflows ≠ bearish sentiment; OTC market is secretly maneuvering
The Bitcoin ETF has seen a cumulative outflow of $2.8 billion in the past month. This is not an indication of institutional bearishness; rather, it is a shift of funds from "off the books" to "on the books". Major banks such as JPMorgan Chase and Goldman Sachs have taken positions through the OTC market, with the volume of off-exchange transactions surging by 78% in 30 days. This was done to circumvent the restrictions of ETF subscription and redemption rules. This "openly reducing while secretly increasing" pattern occurred at the bottom of the bear market in March 2020 and led to a 170% increase in Bitcoin prices over the following 6 months. Data from Bitfinex shows that the balance of wallets holding over 10,000 Bitcoin decreased by only 1.5% in October. This was not a panic sell-off; rather, it was a gradual profit-taking in the context of weak ETF demand, resetting positions for the next rally.
Bitcoin trading strategy
buy:95500-96500
tp:98000-99000
sl:94000

BTC/USD – Liquidity Sweep Setup With Potential Bullish ExpansionBitcoin is currently ranging near the lower liquidity zone around 93,894, where the market has previously reacted. Price is forming compression into the lows, suggesting that sellers are losing momentum and liquidity is building underneath. If the market sweeps this blue liquidity line, a strong bullish reaction can be expected.
Once liquidity is taken, the first upside target aligns perfectly with the high-volume node at 99,659, where the market previously consolidated. A clean break and hold above this level opens the door for a deeper bullish expansion toward the second major target around 105,125, which matches another high-volume node and previous structural resistance.
Market is currently trading below the EMAs, showing temporary bearish control — but overall structure hints that market makers may be engineering a liquidity grab before a strong reversal.
Key Points:
Liquidity resting at 93,894 (likely stop-hunt zone).
Target 1: 99,659 – first major volume imbalance & resistance.
Target 2: 105,125 – major high-volume node and strong resistance.
Expect bullish reversal ONLY after liquidity sweep.
EMAs show bearish short-term trend, but compression suggests reversal potential.
