Will US Gov Shutdown Continue to Support Bitcoin Prices?Fundamental approach:
- Bitcoin prices this week have been driven by renewed risk appetite and positive spot ETF inflows, with sentiment supported by the US government shutdown’s data blackout and expectations of further Fed easing as labor market signals soften. The institutional demand narrative strengthened as US spot ETFs returned to inflows, with assets under management remaining elevated, thereby bolstering dip-buying interest.
- Drivers included a modest uptick in the ISM manufacturing PMI, which is still in contraction, and ADP private payrolls showing job losses, reinforcing the view that looser policy could persist and liquidity conditions may remain supportive for the crypto beta. The shutdown has curtailed government data releases, prompting markets to rely on private indicators and amplifying sensitivity to risk sentiment and ETF flow headlines throughout the week.
- Bitcoin prices could sustain momentum if ETF inflows remain positive and macro uncertainty keeps rate-cut expectations intact, though volatility may rise with limited official data.
Technical approach:
- BTCUSD broke the triangle pattern and rose higher, positioning itself above both EMAs, indicating an upward momentum.
- If BTCUSD remains above 117000, the price may retest the previous swing high at around 123000.
- On the contrary, closing below 117,000 may prompt BTCUSD to retest the broken triangle pattern and the area between both EMAs.
Analysis by: Dat Tong, Senior Financial Markets Strategist at Exness
BTCUSDT

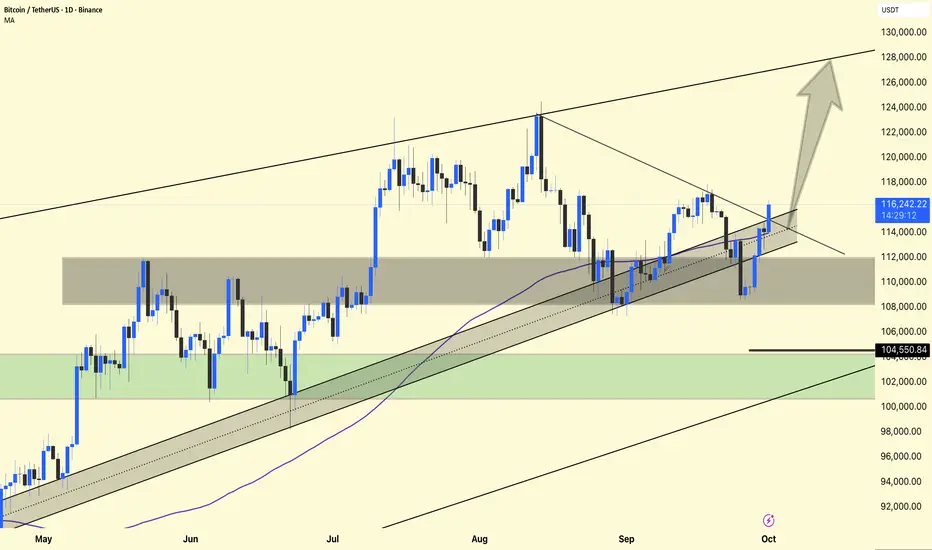
BTC/USDT: Bullish Surge to 136K?BINANCE:BTCUSDT is gearing up for a bullish move on the daily chart , with an entry either from the current level or a pullback to the specified trendline .
The target at 136000 aligns with the next major resistance, signaling strong upside potential. Set a stop loss on a daily close below 108500 to manage risk effectively.
A break above 118000 with solid volume could trigger this surge, driven by market sentiment and BTC dominance. Watch key news! 💡
📝 Trade Plan:
✅ Entry: From current price or on a pullback to the trendline
❌ Stop Loss: Daily close below 108,500 to manage risk
🎯 Target: 136,000 (next major resistance)
Ready for this lift-off? Drop your take below! 👇

Trading Strategy
Hello, fellow traders!
By "Following" us, you'll always receive the latest information quickly.
Have a great day.
-------------------------------------
The conditions that lead people to start trading vary.
Before starting a trade, you should consider a trading strategy.
A trading strategy should include:
1. Investment period
2. Investment size
3. Trading method and profit realization method
You should categorize the coins (tokens) you wish to trade based on items 1-3 above.
1. The investment period is the most important.
While the investment period varies from person to person, BTC and ETH are generally considered long-term investments.
Since BTC and ETH are important coins that support the cryptocurrency market, I recommend investing in either BTC or ETH.
All coins other than BTC are broadly categorized as altcoins. However, among them, BNB, SOL, XRP, TRX, and ADA LINK, which have high market capitalizations and have been around for a long time, are suitable for mid- to long-term investment.
However, since these coins are also broadly categorized as altcoins, it's recommended to increase the number of coins (tokens) that generate income, if possible, for mid- to long-term investment.
This method involves selling the original purchase price (plus transaction fees) when the price rises, leaving the remaining coins (tokens) available for profit.
This allows you to increase the number of coins (tokens) with an average purchase price of zero, making mid- to long-term investment feasible.
While it's certainly advisable to sell your holdings to generate cash profits, this practice is not suitable for mid- to long-term investment.
This is because if you make a mistake, you could end up buying at a high price and incur losses for a long period of time.
-
2. You should determine your investment size based on your investment period.
In other words, if you're making a long-term investment and have already invested all your capital, you could miss out on good opportunities in the future.
Therefore, it's best to invest in the following order: long-term investment < mid- to long-term investment < short-term investment.
Furthermore, you should keep approximately 20% of your total investment in cash.
This allows you to trade when a good opportunity arises.
If you run out of cash after trading, try to sell when the price rises to secure cash.
Furthermore, you should avoid investing in too many coins (tokens).
-
3. Once you've determined your investment period and size, you need to find the right buy and sell points for actual trading.
Therefore, you need to define your trading method and profit-making method.
The basic trading strategy is to buy in the DOM(-60) ~ HA-Low range and sell in the HA-High ~ DOM(60) range.
However, if the price rises in the HA-High ~ DOM(60) range, a stepwise upward trend is likely, while if the price falls in the DOM(-60) ~ HA-Low range, a stepwise downward trend is likely.
Therefore, the basic trading strategy should be a split trading strategy.
In other words, if you buy in the DOM(-60) ~ HA-Low range and the price rises to form the HA-High ~ DOM(60) range, it's best to sell in splits and observe the situation.
This stabilizes your psychological state, allowing you to re-analyze the charts.
Maintaining a stable psychological state is crucial for trading.
If your psychological state is unstable, you're more likely to make unexpected trades.
Therefore, it's important to have a basic trading strategy that suits your investment style.
As mentioned earlier, to maintain a mid- to long-term investment, you need to decide whether to increase the number of coins (tokens) that generate profits or to generate cash returns. Before conducting a trade, you need to decide whether to do so.
Since the coin market is increasingly interconnected with the stock market, you can try to interpret it using the same method as the stock market.
In other words, rather than examining the flow of funds within the coin market itself, you should prioritize assessing the stock market, social issues, the economy, and politics to determine market trends.
I believe this problem stems from a lack of understanding of the coin market.
While some external factors may influence the flow of funds within the coin market, they are not suitable for predicting it.
Therefore, you should check the USDT, USDC, USDT.D, and BTC.D charts to confirm the flow of funds within the coin market.
Next, you should check the charts of the coin (token) you wish to trade to determine if it fits your basic trading strategy and develop a trading strategy.
Finally, by examining issues beyond the coin market, you can make an objective decision about your trading.
Otherwise, you will likely make inappropriate trades based on subjective opinions stemming from issues outside the coin market.
To analyze and interpret the coin market like the traditional stock market, the two markets must be integrated.
Otherwise, I believe the coin market should not be analyzed or interpreted like the stock market.
-
Thank you for reading to the end.
I wish you successful trading.
--------------------------------------------------

Continue uptrend if..."Continue the uptrend as the price remains strong after breaking through the zone."

BTC Medium Term and Local Work for 2025 18 05 2025Logarithm. Time frame 3 days. Everything is shown extremely accurately, according to technical analysis, logic based on cyclical repetition, and liquidity consolidation zones as a result of price and trading movements. This trading idea, with precise reversal zones and targets, will last you for 31 weeks. That is, for 7 months.
The previous trading idea BTC/USD Triangle. Medium-term and local work , published on 7 06 2024, it lasted me almost 1 year. It has 63 local work updates (I don't spam with new trading ideas on principle). So, nothing will get lost, you can follow everything, read, possibly use it as training material on a live chart, as a whole explanation of local work, what is really happening on the market, profit/loss potential, always before the price movement, and not after the fact. I show what is, that is, a chart and potential work from the position of a trader, not a crypto marketer.
🟣 Local and medium urgent now
1️⃣💸 The bullish triangle itself (which is not there yet, I have depicted it on the chart for you) acts as a stop and consolidation zone (zone “psychology 100”, reset in trend No. 1). This is the easiest to manipulate and the most probable scenario. This will just be the summer consolidation. Instead of it, there may be:
2️⃣💸 Rising wedge , but more in shape like a triangle (essentially a wedge, there is a meaning of a triangle, but it was formed on aggressive pump news), with a large short liquidity takeout, and not very good logic of the TA movement after that... But, this is a bullish scenario, although quite aggressive.
3️⃣ Working out the bearish targets of the triangle (non-corrective price movement within its canvas). Stopping the decline in the designated zone and reversal upward (continuation of the trend). I emphasize the importance of not fixing the price below the zone of targets of the local corrective decline, which will not break the trend.
4️⃣💸 Double top (or triple). Double top as in 2021 in the distribution zone. This is the least likely scenario, but the most negative, as it breaks the trend. But, this is the least likely scenario, primarily because of the altcoins.
Altcoins in 2021 and now.
4️⃣In 2021, when Bitcoin formed a double top, they (altcoins) were in “space”, that is, in their distribution zones (+500-1000% of the average price of the set).
🔽Now everything is the other way around, they are in capitulation zones (most of them) or in their long-term accumulation channels :
Liquid -90-93%
Medium liquid -93-96%
Low liquid -96-98% or some are already scams or on the verge of it...
Some altcoins have pumped up earlier. That is, they left their long-term accumulation zones earlier. For example: SUN, XRP, DOGE, PEPE, SOL and so on... But there are very few of them, as distributing (raising the price, holding it and selling, inspiring to buy expensive when everything is cheap) in a bearish altcoin trend is very irrational, and you need a lot of money to go against the general market trend.
Main trend (most of it, chart since Binance Exchange foundation) for clarity on a large time frame of this local zone for work.
BTC Primary trend. Secondary — expanding triangle.

BITCOIN Risky Short!
HI,Traders !
#BITCOIN grew up fast
But then hit a horizontal
Resistance level of 117678.7
From where we are already
Seeing a nice pullback
And we will be expecting
A further local move down !
Comment and subscribe to help us grow !

BITCOIN’S PUMP BEFORE THE DUMP — CRYPTO ABOUT TO CRASHTRADERS, WE ARE STARING RIGHT INTO THE EYE OF THE STORM. BITCOIN’S “TOO GOOD TO BE TRUE” RALLY IS BEING PROPPED UP BY LEVERAGED PERPS, NOT REAL SPOT BUYING. THE CHART IS SCREAMING EXHAUSTION: AVWAP BANDS COLLIDING, ORDER FLOW MAXED OUT WITH AGGRESSIVE LONGS, AND A DANGEROUS IMBALANCE AROUND 118K. THIS IS THE PERFECT BREEDING GROUND FOR A MEGA LONG SQUEEZE THAT WILL NOT ONLY RIP THROUGH BITCOIN BUT DRAG THE ENTIRE CRYPTO MARKET DOWN WITH IT. THE PUMP IS THE TRAP. THE DUMP IS LOADING
TLDR;
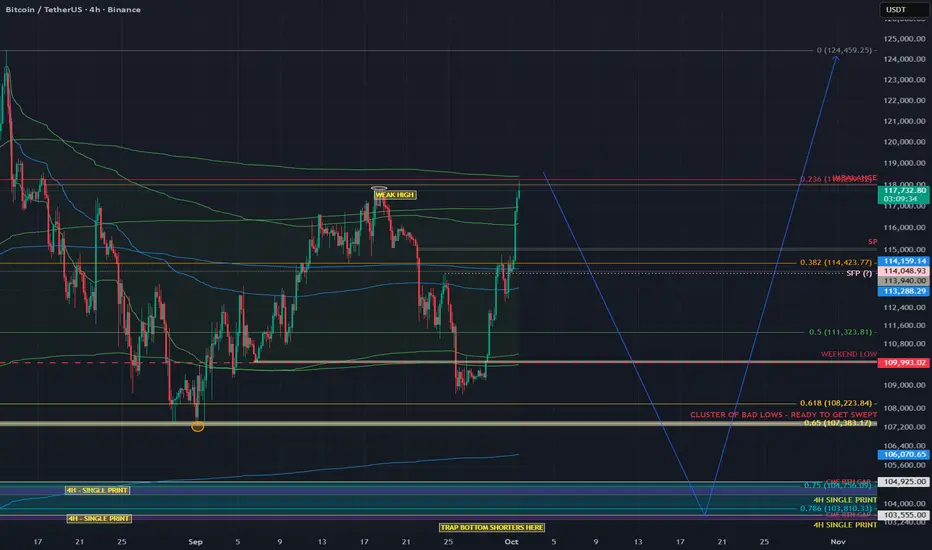
This leg looks futures-driven, not spot-backed. We’re pushing into AVWAP outer-band confluence with imbalances near 118k while leveraged longs pile in. Base case: sweep the mid-Sept Weak High, fail, rotate down toward 104k (and maybe 98.5k). I’ll flip only if spot CVD takes the lead and price accepts above the AVWAP band cluster.
Why I think the “mega long squeeze” is loading
1) Who’s actually buying? (Spot CVD vs Futures CVD)
Spot CVD: still negative/underwhelming across the push → real buyers (spot) aren’t lifting.
Futures CVD (stablecoin-margined): rising with Open Interest → perps are doing the heavy lifting.
Translation: Leverage is pushing price, not genuine spot accumulation. These moves are fragile and unwind hard when OI compresses.
2) AVWAP confluence (the auction math)
I’m tagging anchored VWAPs from opposing pivots (swing low→high and swing high→low).
The outer bands from these anchors are overlapping in the same zone → both bottom-anchored longs see it as expensive (profit-taking), and top-anchored shorts defend their break-even.
That overlap = double-sided supply. Historically, these reject unless fresh spot demand blows through (which we don’t have… yet).
Still have bad September lows that are likely to be swept at 107k~
3) 118k imbalance
There’s an inefficient push / imbalance around 118k. Thin structure often gets tapped/swept, then mean-reverts if the follow-through is purely leveraged.
4) Order flow is too aggressive (late longs)
OI up + positive delta into resistance = new longs chasing.
On footprint, you can see buy-side aggression meeting absorption near the top of the move. That’s classic trap fuel if we print an SFP.
Trade idea (conceptual, not financial advice)
Base case path (bearish):
✅ Sweep the Weak High (mid-Sept) into 117.8–118.8k (imbalance + AVWAP band confluence).
✅ Print a Swing-Fail Pattern (SFP) / rejection wick on 5–15m with:
Spot CVD NOT confirming (stays flat/negative),
OI spikes while delta stalls (late longs absorbed).
Short after the reclaim/failure back below the swept high; stop above the SFP high.
Targets / magnets:
113.2–114.1k (0.382 zone / local AVWAP midlines)
111.3k (0.5 retrace / prior balance edge)
109.9–109.3k (weekend low / prior node)
106.0–104.9k (SP + LVN cluster, high-prob test area)
Stretch: 103.5k (4H single print) → 98.5k if liquidation cascade extends.
validation / flip criteria:
Acceptance above the AVWAP outer-band cluster and 118.8k with:
Spot CVD turning positive and making higher highs,
OI stable or down on further upside (less leverage dependence).
If that happens, I stand down on the short idea and reassess for continuation
BTC 1H Analysis - Key Triggers Ahead | Day 49❄️ Welcome to the cryptos winter , I hope you’ve started your day well.
⏰ We’re analyzing BTC on the 1-Hour timeframe .
👀 On the 1-hour chart , After a strong bullish rally and breaking the $109,766 zone, BTC managed to move toward $117,000. This level is considered a multi–timeframe daily resistance, and personally I expect a correction here. The second bullish leg, which started after breaking the $111,624 resistance and buyers' micro support at $112,762, is now facing weakness. RSI is also showing reversal signals. The current BTC scenario is a correction toward the marked Fibonacci zones. The upcoming resistance is extremely important, and if it breaks, Bitcoin can continue upward.
🧮 Looking at the RSI oscillator, during both bullish legs it managed to stay firmly in overbought territory, and long-position volatility has significantly increased along with rising buy volume. On the 1H timeframe, RSI doesn’t have a specific key level right now because it has hit a significant swing resistance on the daily timeframe. Breaking out of the marked zone can push BTC higher. This key swing level on the daily RSI is around 61.
🕯 Volume, count, and size of bullish candles have sharply increased. Considering we are sitting at a resistance zone, traders are putting in maximum effort to break it, and volume is rising aggressively. Every sell candle that formed was engulfed by buyers immediately as BTC dipped, and buyers created new positions. Our trend is strongly bullish.
🎮 The Fibonacci is drawn from the start of the new bullish leg to the top of the previous 1H candle's wick. It has identified strong support zones in case BTC corrects, and these levels are considered highly reliable.
📊 The Bitcoin liquidation heatmap currently shows the distribution of short positions, and this spread continues up to $119,000. With upward movement and buyer support, these clusters can get absorbed and liquidated, leading to a short squeeze and a strong move up. Note that the cluster of short liquidations down to $113,000 could get triggered with maximum selling pressure, and this scenario isn’t far-fetched.
🧠 If you haven’t entered a BTC position based on previous analyses, you can wait for corrective support zones to form. Buyer tickers will place their orders below these support levels so we can gain full confirmation before making a BTC entry.
↗️ Long Position Scenario: A break above the seller ticker zone and grabbing accounts holding short positions is required to reduce short-position clusters. Then we need confirmation above our seller ticker zone at $117,820. With the start of a new bullish leg and an indecision candle plus a 7 SMA touch from below, we can open a low-risk long position.
📉 Short Position Scenario: If BTC forms a lower high and lower low with maximum selling pressure, negative economic news, and loses key Fibonacci zones — especially the 61% level — we can consider opening a short. However, as I mentioned in previous days, avoiding shorts and focusing on longs is currently much more in our favor.
❤️ Disclaimer : This analysis is purely based on my personal opinion and I only trade if the stated triggers are activated .
TradeCityPro | Bitcoin Daily Analysis #185👋 Welcome to TradeCity Pro!
Let’s move on to the Bitcoin analysis. Bitcoin’s bullish trend is still continuing, and today during the London session it made another upward move. Let’s review today’s triggers together.
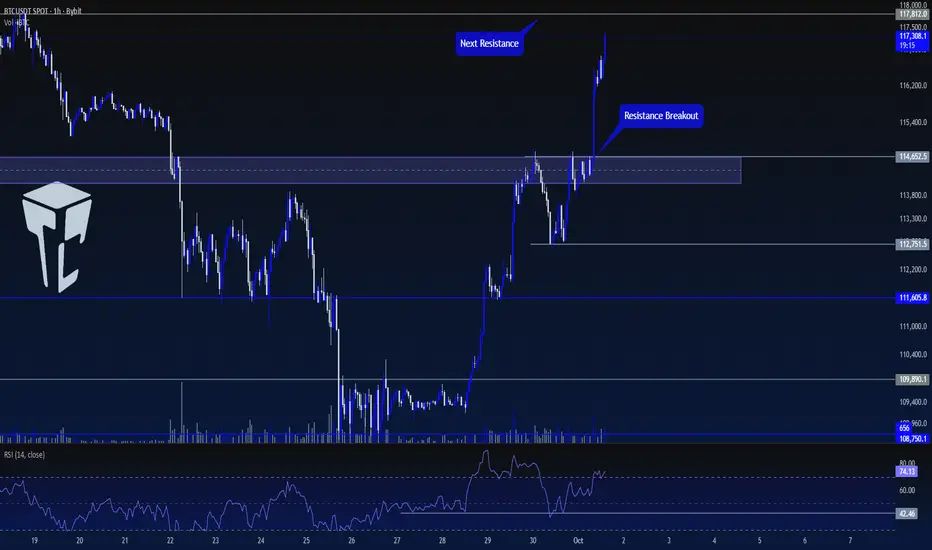
⏳ 1-Hour Timeframe
Yesterday, after the correction, Bitcoin formed a bottom at 112751 and with the RSI being supported at 42.46, the upward move started.
🔔 The trigger we had yesterday for opening a position was the breakout of the resistance zone, with the exact trigger forming at 114652. After the breakout, the price started its second upward wave.
💥 The RSI oscillator has also entered the Overbuy zone, and the market momentum is fully bullish. The next resistance we have is at 117812.
💫 If the price reaches 117812 and the RSI exits the Overbuy zone, we can take profit on the position.
✅ For a new position, no fresh trigger can be given right now because the price is moving sharply upward, and opening any new position here would be considered risky with a high chance of hitting stop-loss.
📊 The area I expect the price to react to is 117812, but I will wait for the price to first build a structure before opening a position.
❌ Disclaimer ❌
Trading futures is highly risky and dangerous. If you're not an expert, these triggers may not be suitable for you. You should first learn risk and capital management. You can also use the educational content from this channel.
Finally, these triggers reflect my personal opinions on price action, and the market may move completely against this analysis. So, do your own research before opening any position.
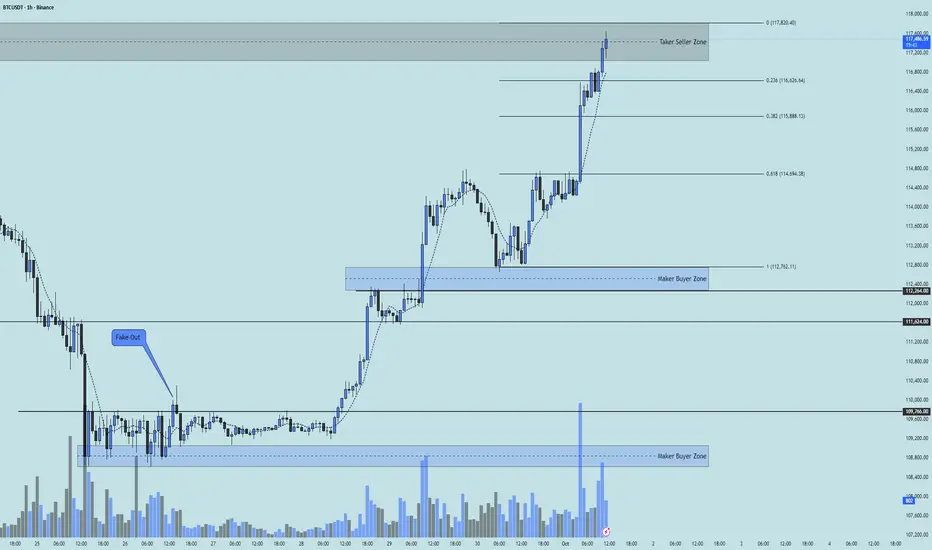
BTC Outlook: Constructive Above 112k, Risky BelowLast week in my BTC analysis, I mentioned that the price could reverse from the 108k zone. That scenario played out, and while this was a positive development, I also noted that bulls needed to reclaim 112k for a brighter outlook.
The market delivered: BTC not only reversed but also broke back above 112k, pushing as high as just under 115k.
Now, the 112k zone has become crucial for two reasons:
1. If bulls hold above 112k – it confirms strength and validates the recovery as a genuine move higher.
2. If price breaks back below 112k – the recent move above would be revealed as a false upside break, with 115k locked in as a new lower high and a potential descending triangle taking shape.
With this in mind, I remain constructive on BTC. But the message is clear: 112k is the key level that will decide whether momentum continues or fades. 🚀

Next Volatility Period: Around October 3rd (October 2nd-4th)
Hello, fellow traders!
Please "Follow" to get the latest information quickly.
Have a great day!
-------------------------------------
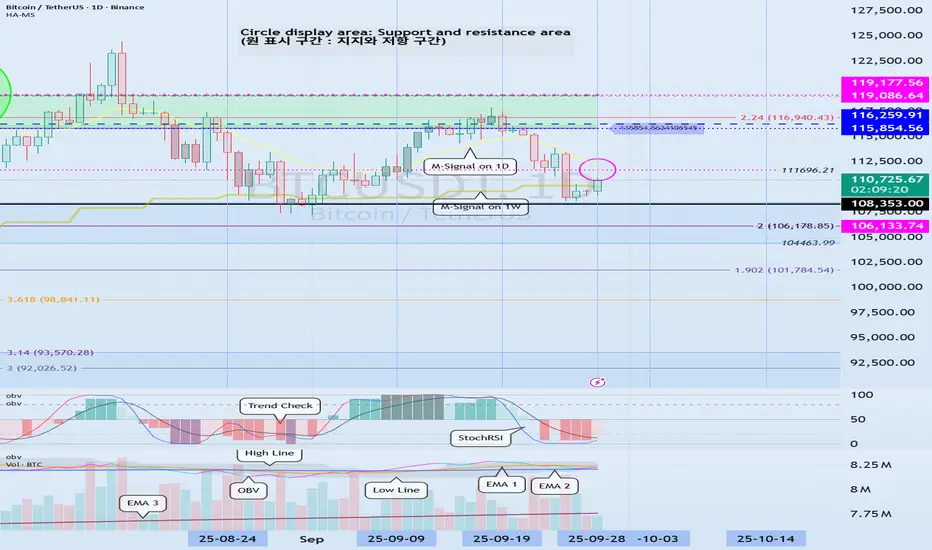
(BTCUSDT 1D Chart)
This volatility period lasts until September 29th, but since the next volatility period is around October 3rd (October 2nd-4th), it's highly likely that the volatility period will continue until October 4th.
Therefore, we need to see if the price can sustain above 11696.21 after the volatility period.
If it fails to do so and falls below the 104463.99-108353.0 range, a sharp decline is likely.
If a sharp decline occurs, we need to check for the formation of new indicators such as the DOM (-60) or HA-Low indicators.
If new support is formed, it's important to determine whether there is support near that area.
If support is not found, a step-down trend is likely.
-
It is currently located near the M-Signal indicator on the 1W chart and the M-Signal indicator on the 1D chart.
Therefore, if the price rises above 111696.21 and holds, further upward movement is likely.
At this point, the key question is whether the price can rise above 115854.56 and hold.
To sustain the uptrend,
- The StochRSI indicator must show an upward trend. It must rise from the oversold zone.
- The On-By-Signal (OBV) indicator must show an upward trend. It must rise above EMA 1 and, if possible, above the High Line and remain there.
- The TC (Trend Check) indicator must show an upward trend. It must rise above the 0 point and remain there.
If the above conditions are met, the uptrend is likely to continue above 111696.21.
-------------------------------------------
The basic trading strategy is to buy in the DOM(-60) ~ HA-Low range and sell in the HA-High ~ DOM(60) range.
However, if the price rises in the HA-High ~ DOM(60) range, a stepwise upward trend is likely, while if the price falls in the DOM(-60) ~ HA-Low range, a stepwise downward trend is likely.
Therefore, the basic trading strategy should be a segmented trading approach.
This basic trading strategy principle was developed for trading on Heikin-Ashi charts.
Adding the M-Signal indicator on the 1M, 1W, and 1D charts allows you to see the overall trend.
The remaining indicators indicate support and resistance points or zones for chart analysis or trading strategies.
Trading is all about reaction, so understanding support and resistance points or zones is crucial.
However, you should interpret the charts based on core fundamental trading strategies.
-
Thank you for reading to the end.
I wish you successful trading.
--------------------------------------------------
- Here's an explanation of the big picture.
(3-year bull market, 1-year bear market pattern)
I'll explain more in detail when the bear market begins.
------------------------------------------------------
#BTC/USDT 1DAY CHART UPDATE !!BTC Trend Context: The price is within an ascending channel – overall, this suggests an upward trend in the market.
Support Testing: The lower boundary or support zone is being tested – this is a critical "decisive" area.
Rejection/Bounce Potential: If support holds and the price reacts upwards, we could see a further move upwards towards resistance.
Breakdown Risk: If the price breaks decisively below support, this could lead to a deeper decline or a trend reversal.
Bitcoin top not is in.2011, 2013, 2017, 2021… and next up, 2025.
The cycle is not complete. The chart speaks for itself.
CRYPTOCAP:BTC ₿

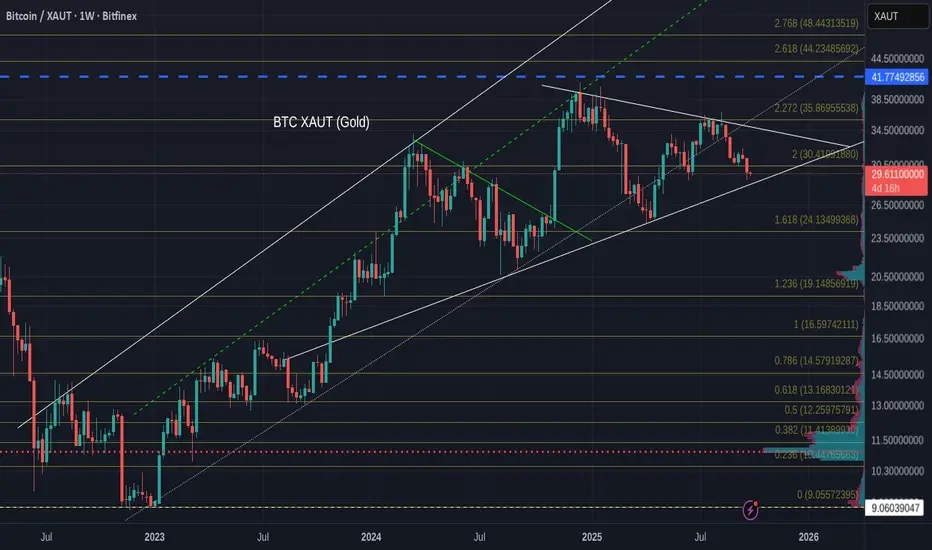
Is Bitcoin about to outperform Gold ? The potential Does exist
As we can see on this weekly Bitcoin XAUT Gold chart, BTC Ranges, pushes, ranges, pushes.
And the BTC PA is now on the line of support ir has strongly bounced off previously.
PA is also beginning to get Squeezed in the Pennant. The Apex is next year but I expect PA to break out of this this year.
It will be interesting to see what happens here this month and I do have Hopes that BTC will begin to outperform gold, certainly while PA pushes up off support and heads towards the upper trend line.
This idea is backed up with the weekly GOLD Chart below.
As we can see, Gold is up on the upper trendline and has hit the 2.768 Fib extension, Both of which are likely to be resistance.
We can also see how Oversold the Gold Weekly MACD is
There is a Strong likelihood that Gold will need to cool off, though we need to understand that MACRO events do control this, so a Drop is not guaranteed.
But I will be watching this CLOSE as The BTCXAUT pair is a much better Pair to watch than the BTCUSD.
Yjr reason being, while the $ looses Value, gains in the BTCUSD pair are Not as good as it may appear. Because you may gain in the number of $ you can get but each $ is worth less.
GOLD meanwhile, is rising in Value or not loosing as much when it ranges. Itis a STORE of Value and is internationally recognised and is politcay neutral.
BTC/USD) Bullish trend analysis Read The captionSMC trading point update
Technical analysis of BTC/USDT (4H timeframe) chart analysis:
---
Bullish Bitcoin Setup
Trendline Breakout: Price has broken above the descending trendline, signaling a shift from bearish to bullish momentum.
Order Block (OB): Price retraced into the order block (yellow zone) around 112,200 – 113,000, showing demand holding strong.
Moving Averages:
50 EMA (red) has crossed above the OB zone.
200 EMA (blue) is acting as dynamic support, strengthening the bullish case.
Price Action: After retesting the OB/EMA confluence, price is expected to continue higher.
---
Target Point
119,953 (≈120,000 psychological level) is the upside target.
This aligns with the next major resistance and the projected extension of the bullish breakout.
Mr SMC Trading point
---
Trading Idea
Bias: Bullish.
Entry Zone: Retest of 112,500 – 113,000 (OB + EMA support).
Target: 119,953.
Invalidation: A breakdown below 112,000 would weaken the bullish scenario and suggest continuation of the downtrend.
Please support boost 🚀 this analysis

Bitcoin is bullish now & many Traders don't see it !!!As you can see, the price has formed a triangle over the past 4 months, whose bullish or bearish nature will be determined after its breakout. The corrective Elliott waves(abc) are currently completing the final wave, which indicates that a potential price increase is on the way. The price seems to have completed the corrective wave, and from now on, it's time for a price increase, which will continue up to around $130k .

Bitcoin HOLDING THE MAIN TREND.. UPDATE 30-09-2025BTC/USDT Update
🔻 Bitcoin is currently trading below the low time frame zone, showing short-term weakness.
✅ However, BTC is still holding the main trend, which keeps the bigger picture positive.
📊 As long as the main trend support (around $110K) is defended, the market structure remains intact.
🚀 A rebound from this area could bring BTC back into the low time frame range and open the way toward $115K+.
📌 Summary:
BTC lost the low time frame, but the fact that it’s holding the main trend is a key positive signal. This level is crucial for maintaining the bullish outlook.

TradeCityPro | Bitcoin Daily Analysis #184👋 Welcome to TradeCity Pro!
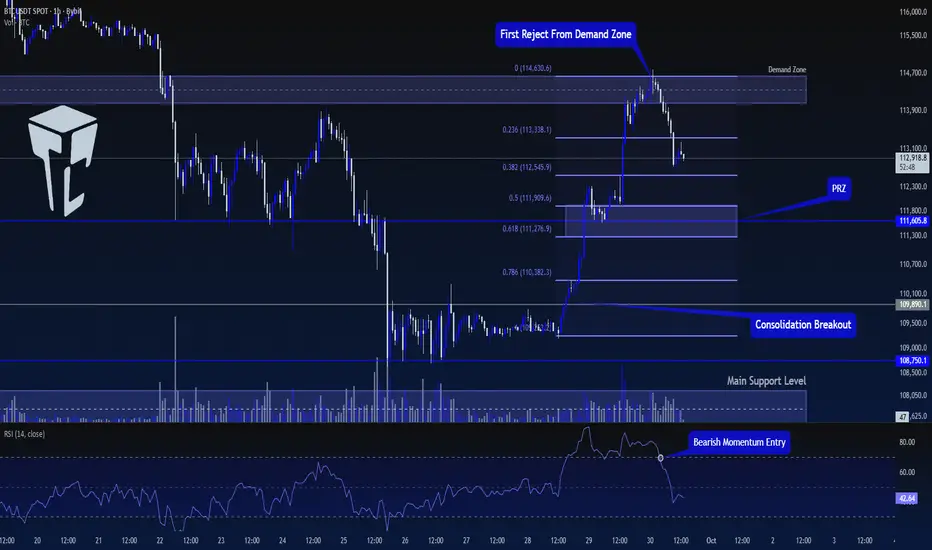
Let's go over the Bitcoin analysis. Yesterday, the price got rejected from a resistance zone, and today, it has started a corrective downward movement. Let's review the market together.
⏳ 1-Hour Timeframe
Yesterday, after the price reached the resistance zone, I mentioned that if the RSI exits the Overbuy zone, we could take profits.
📊 This is exactly what happened. After the price was rejected from the zone, the RSI moved out of the Overbuy zone and started heading downward.
⭐ Currently, the price correction has continued towards the 0.382 Fibonacci level. The trading volume during this correction has not decreased, which indicates that sellers are still active in the market, and their trading volume is not significantly lower than buyers.
🎲 If the price continues its correction and the volume increases at the same rate, the likelihood of a trend reversal and the start of a new downward trend becomes much higher. However, if the volume decreases simultaneously with the correction, the range between the 0.5 and 0.618 Fibonacci levels will be a very important support zone, and the price could find support there.
🔼 For a long position, the trigger we currently have is the breakout of the resistance zone. If we wait for the price to touch this zone a few more times, we can draw the exact numbers for the range and open our position upon its breakout.
⚡️ For a short position, it's better to wait and get confirmation of a bearish trend before looking for triggers. We will confirm the bearish trend if the selling volume increases and lower highs and lows are made.
❌ Disclaimer ❌
Trading futures is highly risky and dangerous. If you're not an expert, these triggers may not be suitable for you. You should first learn risk and capital management. You can also use the educational content from this channel.
Finally, these triggers reflect my personal opinions on price action, and the market may move completely against this analysis. So, do your own research before opening any position.
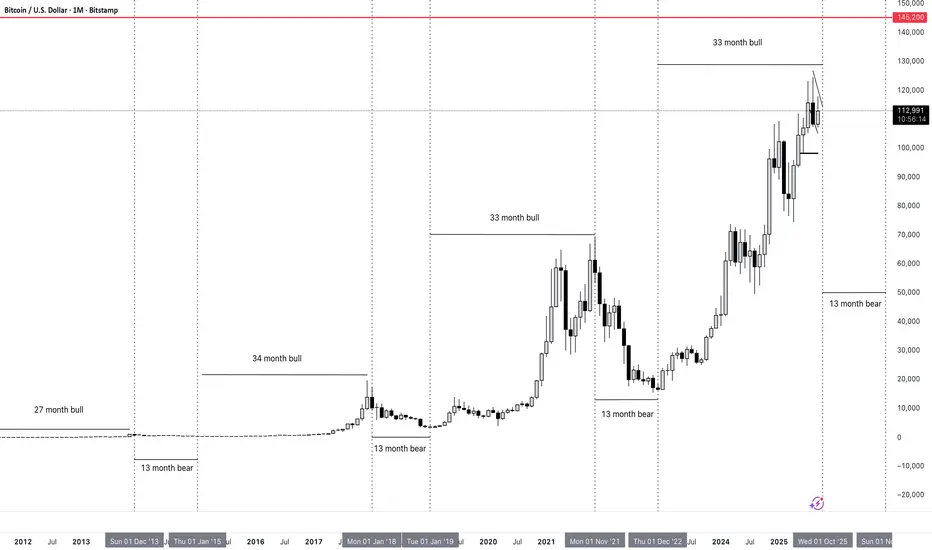
Bitcoin completing fourth bull cyclebtcusd completing 4th bull cycle fo 33 months.
Oct is the last month of this bull cycle
after it will retrace for 13 month as it did before 3 time
Oct target is around 145k
BTC to go parabolic to 100 oz Gold by EOY 2025!Gold and Bitcoin are both valuable hard assets and from my observation, the Bitcoin chart to Gold is much better predictable than it's price to USD. The reason might be because Gold holds it's purchasing power over time through the history, and in fact it is the base line for the purchasing power, but Dollar depends on how much it gets printed and cannot be reliably predicted. That's why when you look at BTC/Gold chart, most of the times you see exact double tops or exact double bottoms.
I was predicting BTC would get to $100K USD when it hits it's previous top to Gold (37 oz) and so I was predicting about 8 month before it happens that BTC will be $100K when Gold is 2650 and it happened. I was surprised myself that it held true.
Looking into Gold price history, we can reliably say that Gold will not stop here and will march to $8000 within couple of years. However I think it has hit it's top for the year, or max $4000 will be the 2025 top. Then when Gold pulls back, BTC will get the chance to go parabolic, and has it's last rise of this bull market, and I expect it should take BTC to near 100 oz Gold. So if we want to put all together, Gold = 3350 where it pulls back and BTC= 100 oz = $335,000. I know the Bitcoin whales are playful sometimes, so we might get into $333,333 per BTC.
I remember in Nov 2013 everyone was talking about bitcoin flipping gold (1 BTC getting to 1 oz Gold) and well, it didn't happen at that time and it had to come back in 2017, but it got close enough. We might have the same kind of situation here so starting to drop anywhere from $270k to $330k might be what we get.
I don't publish many analysis's on TV, but I thought I'd put this here, it might get me famous ;)

$BTCUSDT Long Limit SetupCRYPTOCAP:BTC is taking short term pull back here.
Confluences:
Broke out from the current lower-lower structure.
Shifted 4hr+1D Structure to Bullish
Getting a pull back to 1D-4H OB.
Keep limits open or stay updated with me.
Follow for more <3

BITCOIN Is Still Bearish (1D)All these upward moves look like a pullback to the supply zone that had not yet been tested. It is expected that after some ranging around this area, the price will drop, breaking the liquidity pool forming beneath the candles and moving toward TP 1.
This outlook remains valid as long as no daily candle closes above the invalidation level.
For risk management, please don't forget stop loss and capital management
When we reach the first target, save some profit and then change the stop to entry
Comment if you have any questions
Thank You

BTC OutlookI strongly believe BTC reached the ultimate top. Sell the Top!
I predicted the 2022 BTC bottom, now I predict the 2025 top.
