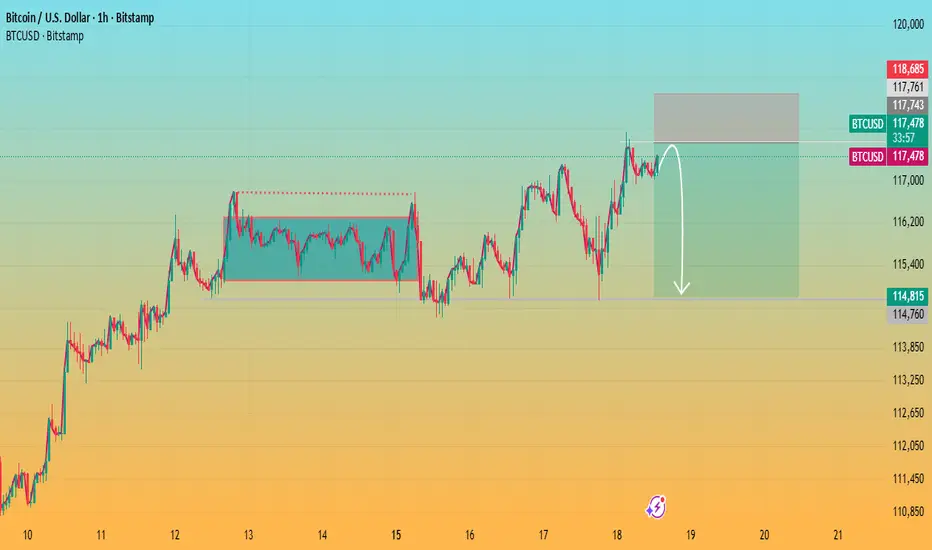
Nailed it! Accurate Prediction of BTCAs we accurately predicted on the 16th, BTC’s resistance level would be concentrated between the 117000 and 118000 and that is exactly what occurred. After advancing to around 117000, it pulled back; subsequently, it rebounded to near 118000 before retreating immediately.
Currently, the support level at 114400 remains solid, and the overall trend continues to be upward.
Buy 115500 - 116000
TP 116500 -117000 - 117500
Daily-updated accurate signals are at your disposal. If you run into any problems while trading, these signals serve as a reliable reference—don’t hesitate to use them! I truly hope they bring you significant assistance
BTCUSDT

BTC/USDT: Bullish Leap to 122K? As the previous analysis worked exactly as predicted, BINANCE:BTCUSDT is gearing up for a bullish move on the 4-hour chart , with an entry zone between 111750-113000 near a key support and rising trendline. 🎯
The target range at 122000 aligns with the next major resistance, signaling strong upside potential. Set a stop loss on a daily close below 110000 to manage risk effectively.
Attention: The price may not hit the red box and could move upward with momentum after touching the ascending trendline. Exercise caution in managing your capital.
📝 Trade Plan:
✅ Entry Zone: 111,750 – 113,000 (support + trendline area)
❌ Stop Loss: Daily close below 110,000 to manage risk
🎯 Target: 122,000 (next major resistance)
💡 Ready for this surge? Drop your take below! 👇

BTC DATA UPDATEBTC/USDT Update
On the low time frame, BTC is still in a breakdown structure. Price is consolidating under pressure around the 115.7K zone.
Key levels to watch:
116K → first level where momentum could shift.
116.5K → confirmation level. A strong break and hold above 116.5K would confirm a new uptrend and open the way to higher levels.
Failure to confirm above 116.5K means risk remains for further downside continuation.
Critical support: 112.8K is an important cycle level BTC must hold to stay inside the green cycle.
If 112.8K breaks, probability increases for a deeper correction toward lower zones (110K–108K).
Until BTC closes and confirms above 116.5K, bias remains cautiously bearish/sideways.
📌 Summary
Below 116K → breakdown structure remains active.
Break & confirmation above 116.5K → bullish scenario opens.
112.8K → must-hold cycle support for the green cycle.

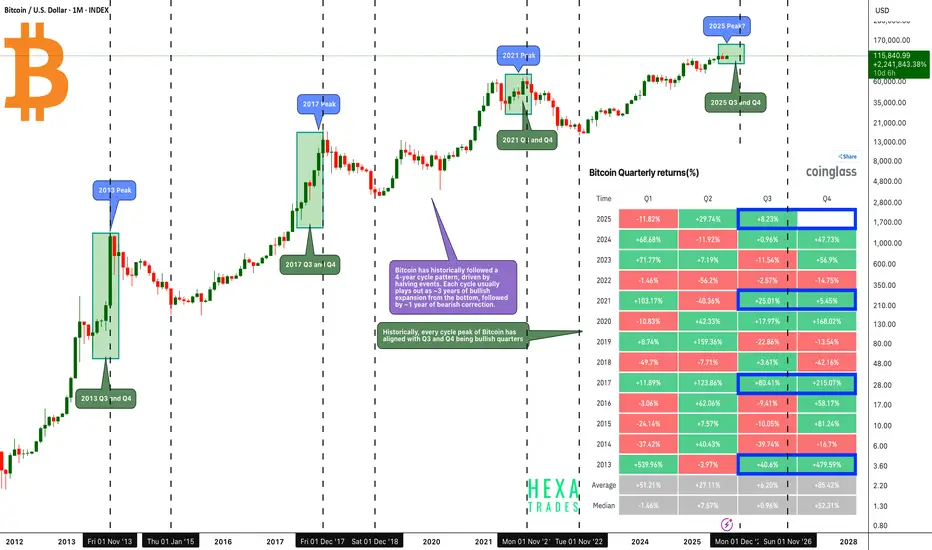
Bitcoin - Final Pump Before the Crash?Bitcoin has historically followed a 4-year cycle pattern, driven by halving events. Each cycle usually plays out as ~3 years of bullish expansion from the bottom, followed by ~1 year of bearish correction.
Historically, every cycle peak of Bitcoin has aligned with Q3 and Q4 being bullish quarters, making the second half of the year the most critical period for cycle tops.
Key Observations from Previous Cycle Peaks:
🔶 2013 Peak:
- Q3: +40.6%
- Q4: +479.59%
Strong acceleration into year-end marked the cycle top.
🔶 2017 Peak:
- Q3: +80.41%
- Q4: +215.07%
A similar explosive move as Bitcoin entered the mania phase.
🔶 2021 Peak:
- Q3: +25.01%
- Q4: +5.45% .
🔶 Current Cycle (2025 Peak?):
- Q3 2025 is already up +8.23% with 15 days remaining until the quarter ends.
- If history repeats, Q4 could be the blow-off phase where Bitcoin accelerates sharply to its peak.
🔶 Potential 2025 Target:
Bitcoin’s Q4 2025 peak could realistically reach the $140K–$160K range before entering the next corrective phase.
Conclusion: If Bitcoin follows its established 4-year cycle structure, we could be entering the final bullish leg of this cycle. History suggests Q3 and Q4 have the highest probability of producing outsized gains, with Q4 especially aligning with cycle peaks.
Cheers
Hexa
BINANCE:BTCUSDT CRYPTOCAP:BTC BITSTAMP:BTCUSD BINANCE:BTCUSDC
BTC: Correction or the Calm Before the Storm? AI Breakdown What's up, crypto crew! 🚀 NeuralTraderingPro, back in the hot seat to help you navigate through the fog of market uncertainty. It's Saturday, September 20th, and we're seeing last week's bullish fire cool down into a more cautious stance. So let's break it down: is this a healthy breather before the next leg up, or the start of a deeper correction?
📜 FORECAST REVIEW: THE MARKET PUMPED THE BRAKES
My last analysis on September 18th hit the nail on the head. I pointed out that massive wall of resistance around the $117,750 - $118,000 zone. My primary call was that a clean break above that level would pave the way to $122,500. But the bears held the line! 🛡️ The bulls got rejected, and the price pulled back, confirming my alternative correction scenario. The market sliced through our first support at $116,800 (the previous `down1` level) and is now battling it out in the key $115,800 zone (the previous `down2`). The market chose caution, and we have to adapt.
📊 THE CURRENT SITUATION: CHARTS AND INDICATORS
Current Price: $115,905.93
📈 Daily Chart (1D): The powerful uptrend is taking a breather. We're seeing two red candles, signaling a correction after the recent run-up. The RSI is cooling off from overbought territory, which is a healthy sign. The price is approaching the 20-day SMA, which should act as a key dynamic support. The MACD shows that bullish momentum is fading. The big picture is still bullish, but in the short term, the bears are in control.
💹 4-Hour Chart (4H): The picture is even clearer here. The price has broken below the 20-period SMA (blue line) and is now testing the 50-period SMA (orange line) for support. This is a clear signal of a short-term sentiment shift from bullish to bearish/corrective. The MACD has dipped into negative territory, and the RSI is below 50, confirming weakness from the buyers on this timeframe.
⏱️ 30-Minute Chart (30m): On the lower timeframe, we're in a clear descending channel. Price is trading below both the 20 and 50 SMAs. The RSI is trying to bounce off the oversold zone, which could spark a small local bounce, but the overall trend here is still down. The MACD is hinting at potential consolidation, but we'll need stronger signals for a full reversal.
📋 ORDER BOOK ANALYSIS: THE BATTLE FOR $115,900
The order book is where the real drama is unfolding:
🔴 Sell Walls (Resistance): Right at the current price of $115,905.93, there is a massive sell order for nearly 13 BTC (worth ~$1.5 million)! This is a huge wall putting heavy pressure on the price and capping any move up. The sellers are completely in the driver's seat right now.
🟢 Buy Walls (Support): The bulls are biding their time. Their main forces are clustered just below the current price. A large cluster of buy orders is stacked in the $115,868 - $115,886 range. This is the first serious line of defense where buyers are ready to step in.
The Takeaway: The sell pressure is immense and immediate. The price is literally hitting a brick wall. If the bulls can't hold the line around ~$115,870, the drop could accelerate.
📰 WEEKLY RECAP & MARKET NEWS
This week has been a rollercoaster! 🎢 It kicked off with a steady climb that turned into a euphoric rally mid-week on the news of the Fed rate cut (as expected). The price shot up to $117,750. However, the euphoria wore off quickly, and the last few days have been all about profit-taking and correction.
Key news and themes on our radar today:
1. 🌐 FOCUS SHIFTS TO ALTCOINS. Chainlink (LINK) is showing incredible strength. Major firm Caliber invested $6.5M into it , and some analysts are calling for a run to $100 . Successful pilot programs with UBS in Hong Kong are also fueling the fire . This could be temporarily pulling liquidity away from Bitcoin, contributing to its current lull.
2. 🧐 LONG-TERM BULLISH SENTIMENT. Despite the correction, the big players are staying optimistic. Michael Saylor recently stated that a "decisive 10-year run" for Bitcoin has begun. The CEO of HashKey also spoke about BTC's potential as a strategic reserve. This provides a solid long-term foundation and should limit how far we fall.
3. 💰 THE FTX PAYOUT IS COMING. At the end of the month, on September 30th, a $1.6 billion payout to FTX creditors is expected. This event could inject massive volatility into the market. If that money gets reinvested, we could see a pump. If it's cashed out to fiat, expect a dump. The market is holding its breath.
4. 🇺🇸 THE ETF SAGA CONTINUES. Grayscale just filed for a spot Dogecoin ETF. This shows that the process of integrating crypto into traditional finance is in full swing, which is a long-term positive for the entire market.
🔮 FORECAST & KEY TARGETS FOR THE WEEK (Sept 21-28)
This correction seems logical and, for now, doesn't threaten the macro bull trend. However, the bears have seized short-term control. The coming week will likely start with a test of key support levels. The outcome of that battle will dictate the market's direction for the next few days.
Probability: Short 📉 (55%) / Long 📈 (45%)
🎯 Key Targets for the Week Ahead:
Upside Targets (If Support Holds):
1. 🐂 $116,800 - The old support level, now the first line of resistance.
2. 🐂🐂 $117,750 - The recent high; a powerful resistance zone.
3. 🐂🐂🐂 $119,500 - A psychological barrier before the assault on $120k.
Downside Targets (If Support Breaks):
1. 🐻 $115,000 - A critical psychological level and a support zone on the daily chart.
2. 🐻🐻 $113,800 - The consolidation zone from early September; the next major support.
3. 🐻🐻🐻 $112,500 - The 50-day SMA area. This is the bulls' last stand before a much deeper drop.
💡 TRADE IDEAS
1. Long Positions (Playing the Bounce)
Long 1 (Conservative): Enter after a clear bounce from the $115,000 support zone with confirmation of buyer strength. Targets: $116,800, $117,750. Stop-loss: $114,400.
Long 2 (Aggressive): Enter after a confirmed break and hold above $116,800. Target: $119,500. Stop-loss: $116,200.
2. Short Positions (Riding the Correction)
Short 1 (Aggressive): Enter on a confirmed break and hold below the $115,800 support zone. Targets: $115,000, $113,800. Stop-loss: $116,300.
Short 2 (Conservative): Short a failed retest of the $117,750 level if the price returns there and shows weakness. Target: $116,800. Stop-loss: $118,300.
🛡️ FINAL THOUGHTS & RECOMMENDATIONS
The market is cooling off after a hot run, and that's perfectly normal. Now is the time for patience and a level head. Don't panic sell, but don't ignore the signs of weakness either. All eyes are on the ~$115,000 support level. If we hold it, the path to recovery opens up. If we break it, expect further correction. And as always, use stop-losses 🛡️—they're your best defense in any market condition!
May your trades be profitable and your analysis sharp! 💰 Don't forget to smash that like button 👍 and subscribe so you don't miss the next breakdown!

BTC Trade Update - Time to Buy?Trade Update on BINANCE:BTCUSD
COINBASE:BTCUSD is currently forming a hidden divergence around the support zone on H1 - a very strong buy signal and potential bullish reversal, as seen in previous instances. I’ve been waiting for this setup, and I expect a strong reversal soon.
Key points:
Entry around CMP to 115,200 remains a solid buy zone.
The next 4H candle close will be very important for confirmation.
Conservative traders may prefer to wait for price close + a Japanese candlestick reversal signal.
Price may dip to retest the support zone (possible spike/sharp rejection), but unlikely to hold for long.
Overall trend remains bullish, further supported by the recent Fed rate cut.
Trade safe and watch closely for the next confirmation.

BTC/USDT – Long Setup After Liquidity Grab (1H Chart)Bitcoin has recently swept liquidity near the 115,046 support zone and is now showing signs of reversal. This setup is based on a potential bullish continuation after the liquidity grab.
Entry (Buy): 115,965.94
Stop Loss (SL): 115,046.66
Take Profit (TP): 117,939.93
📊 Plan:
Price reacted strongly after liquidity sweep below recent lows, indicating buyers stepping in. As long as price holds above the entry zone, the upside target towards 117,939.93 remains valid.
This trade offers a clean risk-to-reward ratio with SL safely below the liquidity sweep and TP at the next resistance zone.
⚠️ This analysis is for educational purposes only, not financial advice.

BTC 4H Analysis - Key Triggers Ahead | Day 43😃 Hey , how's it going ? Come over here — Winter got something for you!
⏰ We’re analyzing BTC on the 4-Hour timeframe.
👀 On the 4H timeframe of Bitcoin, we see that after the recent interest rate cut news, price started moving down. It seems that the potential upside from the news was already priced in by traders. Right now, BTC is trading in a range between resistance at $117,573 and support at $114,828. A breakout of either side could send the price toward the next support or resistance. For now, the market will likely move into a range condition, where the win rate of most setups drops, so it’s better to trade with lower risk.
🧮 Looking at the RSI oscillator, it is near a support zone below the 50 level. The two key levels to watch are 40 and 70. If RSI breaks above or below these zones, Bitcoin could start a new move.
🕯 Currently, the size, volume, and number of red candles are increasing. As BTC approaches support, some buy orders have been triggered. The key question is whether this support zone is strong enough to hold the price until the new week begins. Since the ATH, every correction has faced strong selling pressure from major sellers (maker sellers).
🧠 At this stage, Bitcoin itself may not provide the best setups for positions. However, altcoins that are showing bullish divergence or relative strength against BTC could present better opportunities. We can track these coins on platforms like TradingView or CoinMarketCap, identify their triggers, and look for long entries if the setups are valid.
❤️ Disclaimer : This analysis is purely based on my personal opinion and I only trade if the stated triggers are activated .

Bitcoin Analysis –> The Critical Resistance ZoneHello guys!
Bitcoin (BTCUSDT) has been moving within a well-defined ascending channel since early September, showing consistent higher lows and higher highs. Currently, price action is approaching a major resistance zone (highlighted in blue), around the $118,000 – $119,500 level.
----------Why the Blue Zone is Critical----------
This area has acted as a historical supply zone, where sellers have previously stepped in to push prices lower. It represents a significant hurdle for the bulls, and the next move from here could determine Bitcoin’s medium-term trajectory.
Bullish Scenario (Red Path):
If BTC breaks above the blue resistance area with strong momentum, it could confirm a breakout continuation. In this case, Bitcoin has the potential to test $120,000+ and eventually aim for new all-time highs (ATHs) within the ascending channel structure.
Bearish Scenario (Blue Path):
If the price fails to clear this resistance, a rejection could send BTC back to retest the channel’s lower boundary near $115,000–$114,500. Holding this support would be crucial to maintain the bullish structure. A breakdown from the channel would signal a potential trend reversal.
Key Levels to Watch
Resistance (Blue Zone): $118,000 – $119,500
Immediate Support: $115,000 – $114,500 (channel bottom)
Upside Target (if breakout succeeds): $124,000 – $125,000
Conclusion
The blue resistance zone is the make-or-break level for Bitcoin right now. A successful breakout could be the start of a new bullish leg toward ATH, while rejection here might trigger a healthy correction within the channel. Traders should closely monitor price action in this area before making directional decisions.

ACE ANALYSIS🔮#ACE Analysis 💰💰
#ACE is trading in a symmetrical triangle in a weekly time frame and breakouts with high volume and we could see a bullish momentum in #ACE. Before that we will see little bit retest and then bullish movement
🔖 Current Price: $0.5745
⏳ Target Price: $0.8548
⁉️ What to do?
- We can trade according to the chart and make some profits in #ACE. Keep your eyes on the chart, observe trading volume and stay accustom to market moves.💲💲
#ACE #Cryptocurrency #Pump #DYOR

btcThe most important area for Bitcoin to make a short-term upward move is the green box. If this box breaks and consolidates below it, a short-term buy can be expected in the lower box.

BTC: $115K Support Zone Under PressureBitcoin is currently testing the $115K support zone, and it's showing signs of breaking through. If this level doesn't hold, we could see a drop toward the next support around $110K-$112K. On the flip side, if CRYPTOCAP:BTC bounces back, it might target the $120K resistance zone.
Set a market alert for a break below $115K to track any major moves.
DYOR, NFA

Bitcoin Has Potential to Continue – Don’t Miss Out!Hello everyone, Ken here!
Let’s dive deeper into the current price action of Bitcoin.
As you can see, price is moving within a clear upward channel, signaling strong bullish momentum. After a sharp rise, the price has slightly pulled back to retest the broken resistance. This is a classic break and retest setup within a larger channel, a popular trading pattern I often use.
The key point here is that if this level holds as support, buyer confidence will be further solidified. And we’re already seeing that happen!
With this momentum, I believe 118,850 USDT is the next target, where the price could reverse depending on market reactions at that point.
Wishing you successful trades and a disciplined strategy!

BTC 1H Aanalysis - Key Triggers Ahead | Day 42😃 Hey , how's it going ? Come over here — Winter got something for you!
⏰ We’re analyzing BTC on the 1-Hour timeframe.
👀 On the 1-hour timeframe for Bitcoin, we can see that after reaching the seller trigger zone around $117,825, price was rejected to the downside. Currently, it is losing an important support level on this timeframe, and if we get a candle close below this zone, Bitcoin will likely move toward the buyer trigger area. After that, the market will enter a decision-making phase, where we will have to wait and see what happens in the coming week.
🧮 Looking at the RSI oscillator, there is a key level around 34. If momentum breaks below this level, we could see a deeper correction in Bitcoin’s price.
🕯 The size and volume of red candles are increasing, showing that many traders are selling Bitcoin and closing their long contracts. We need to watch how far this selling pressure continues. This correction, along with the selling momentum, is not unusual — it’s a natural part of Bitcoin’s price movement. Once this correction is complete, we’ll need to see what structure Bitcoin forms next.
🧠 For Bitcoin to make a real bullish reversal without entering an accumulation phase, the support level currently being lost could turn into a strong resistance trigger for future long positions. However, the main trigger remains at $117,825. If Bitcoin breaks above and holds that level, it could even set a new all-time high (ATH).
❤️ Disclaimer : This analysis is purely based on my personal opinion and I only trade if the stated triggers are activated .

Bitcoin Testing Resistance with Potential Pullback AheadKey observations:
Range Breakout: Earlier, Bitcoin broke out of a consolidation zone (marked box), which triggered the recent upward move.
Resistance Zone: Price is hovering near the 5.15%–5.42% gain zone, where selling pressure has historically emerged.
Pullback Signal: The drawn arrow suggests a possible rejection at this resistance, pointing to a corrective move down toward the 3% zone.
Momentum Check: If BTC fails to hold above this resistance, a retracement is likely. However, a strong breakout could open the door toward 6% gains.
BTC analysis.Give me some energy !!!Well, so far, the price has broken the triangle and the pullback is being completed. From here on, if nothing unusual happens, we can be hopeful that Bitcoin will reach $150k.
previous analysis

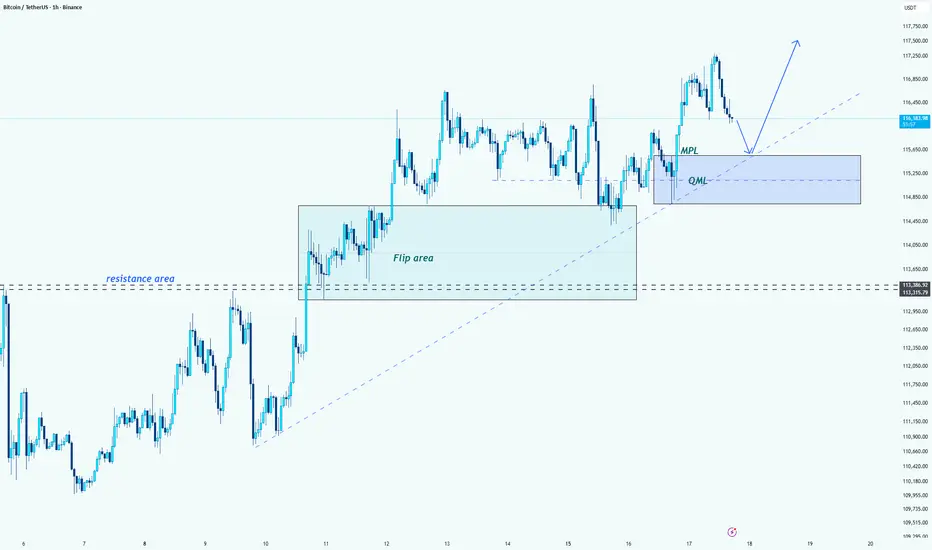
Bitcoin (BTC/USDT) -> MPL and QML AnalysisHello guys!
Let's analyze btc!
⚡ Trading Strategy
MPL Level: 115,000 should be tested before the price rises, so wait for confirmation here before entering long positions.
Target: The next major target for the uptrend is around 117,500.
--------------------
📈 Outlook
Bullish: If price holds above the QML, the bullish trend could continue towards 117,500.
Watch for Retest: Keep an eye on 115,000 for a possible retest before further upside.
BTCUSDT.P LONG#BTCUSDT.P LONG
An uptrend in the market
Price: 117595 $
Main target 119182.0 $
SL 114714.0 $

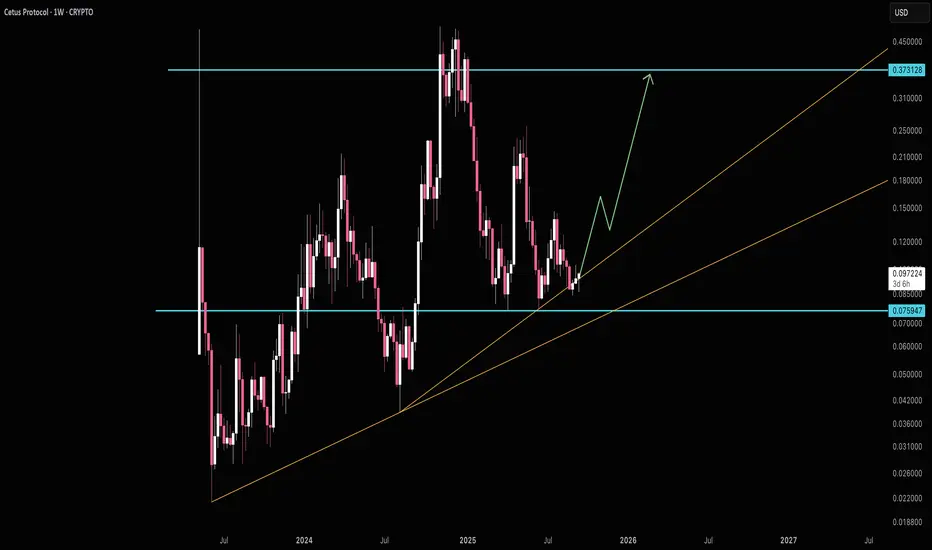
An interesting setup for Small Risk/Big RewardCetus is looking very interesting to me. I took a position here hoping for big upside. If you're not aware Cetus is a DEX on Sui network. The CETUS token can be staked and yeilds a return of the DEX fees. That upper 0.373 area has been resistance a few times now and I'm speculating it'll target that area once again.
Good luck!
BTC Analysis - Key Triggers Ahead | Day 41👋🏻 Hey everyone! How’s it going? Hope you’re all doing well.
❄️ Welcome to Crypto Winter.
⏰ Today, we’ll be analyzing BTC and exploring its potential opportunities.
👀 On the 1-hour Bitcoin chart, we can see that after a slight drop following the recent rate cut, Bitcoin moved toward its micro buyer zone. Following Powell’s remarks, the price pushed upward, breaking through two resistance levels at 116,000 and 117,000. It is now moving toward the 117,700 resistance area, and if this level is broken, further upside movement could follow.
🧮 Looking at the RSI oscillator, the key level is around 70. Once momentum crosses this zone, Bitcoin could gain strong upward momentum, potentially entering the overbought area.
🕯 The size and volume of the green candles have increased notably after the news, suggesting the possibility of a longer-term bullish trend. A confirmed breakout above 117,610 would likely result in more consecutive green candles on the chart.
🔴 U.S. Unemployment Claims came in lower than forecast, strengthening the U.S. economy, while the DXY index is also pushing upward.
🧠 Based on the recent U.S. dollar news, capital inflows into Stocks have increased, and Bitcoin is also trending higher. If you did not enter yesterday, a potential entry could be considered after a confirmed breakout and stabilization above the resistance zone with a proper indecision candle setup.
❤️ Disclaimer : This analysis is purely based on my personal opinion and I only trade if the stated triggers are activated .

TradeCityPro | Bitcoin Daily Analysis #178👋 Welcome to TradeCity Pro!
Let’s move on to Bitcoin analysis. Yesterday the interest rate decision was released and Powell gave a speech. Let’s see how this affected the market.
⌛️ 4-Hour Timeframe
After breaking the 113,222 zone on the 4-hour chart, Bitcoin started a new upward trend and rallied up to 116,960.
✔️ Yesterday’s interest rate announcement was dovish (a cut) and supportive for Bitcoin, helping it break above the 116,960 high.
📊 Currently, the price has pulled back to this zone and is preparing to start its next main move. If that plays out, the next targets will be around 121,881 and 124,494.
📈 The market has built strong bullish momentum, and the trend can continue. This means we can look for long setups on lower timeframes as soon as triggers activate.
⚡️ As long as price holds above 113,222, I continue to view Bitcoin as being in an uptrend. Therefore, while the price remains above this zone, I won’t be opening any short positions.
❌ Disclaimer ❌
Trading futures is highly risky and dangerous. If you're not an expert, these triggers may not be suitable for you. You should first learn risk and capital management. You can also use the educational content from this channel.
Finally, these triggers reflect my personal opinions on price action, and the market may move completely against this analysis. So, do your own research before opening any position.

BTC/USDT Analysis. Trend After the Fed Decision
Hello everyone! This is the CryptoRobotics trader-analyst with your daily market update.
Yesterday evening, the U.S. Federal Reserve cut the key interest rate by 25 bps. The move was widely expected, so the market reaction was muted: volatility briefly spiked, but the overall trend direction remained unchanged.
When testing $116,000, we saw an initial reaction, but during the FOMC meeting volatility increased, and this level was eventually broken. At the moment, a significant volume zone has formed at $116,200–$115,400 (accumulated volume, volume anomaly), and price has consolidated above it.
Although most key volumes are located below, we are currently testing the $117,500–$119,000 sell zone (accumulated volume). There has been no strong selling reaction so far, but buying activity has weakened: price action remains sluggish, and new highs are difficult to achieve.
Base scenario: a deeper test of the sell zone followed by a pullback to nearby support zones, where long entries can be considered.
Alternative scenario: first a move down to test these support zones, followed by renewed buying and a retest of the sell zone.
Buy Zones:
$116,200–$115,400 (accumulated volume, volume anomaly)
$114,300–$113,500 (volume zone)
$111,600–$110,500 (accumulated volume)
~$108,400 (cluster anomalies)
$108,000–$102,500 (accumulated volume)
Sell Zones:
$117,500–$119,000 (accumulated volume)
$121,200–$122,200 (buy absorption)
This publication is not financial advice.

TradersCity Pro | LINK Eyes Fresh Rally From Critical Support👋 Welcome to TradeCity Pro!
In this analysis, I’m going to review LINK, one of the RWA coins with a market cap of $16.41 billion, currently ranked 12th.
📅 Daily Timeframe
On the daily chart, after getting support around 11.55, LINK started an upward move and in its first wave rallied up to 26.73.
✔️ After reaching this zone, volume began to decline and a short correction formed down to the 0.236 Fibonacci level.
⭐ This area is also an important support zone that overlaps with a PRZ (Potential Reversal Zone) at the Fibonacci level, meaning the price could start its next bullish wave if it holds this floor.
🔍 If a deeper correction occurs, price could extend down to the 0.382 or 0.5 Fibonacci levels. Naturally, the deeper the correction, the weaker buyers’ strength becomes.
🎲 For long positions, if the price holds these key zones or breaks above 26.73, we can look for entries. The main confirmation of a bullish continuation will be a clean breakout of 26.73.
📝 Final Thoughts
Stay calm, trade wisely, and let's capture the market's best opportunities!
This analysis reflects our opinions and is not financial advice.
Share your thoughts in the comments, and don’t forget to share this analysis with your friends! ❤️
