TradeCityPro | Bitcoin Daily Analysis #175👋 Welcome to TradeCity Pro!
Let’s move on to Bitcoin analysis. I haven’t posted an update for the past two days, but starting today, let’s get back to the market and see what’s ahead.
⌛️ 4-Hour Timeframe
The U.S. CPI and PPI data, two key inflation indicators, were released and came in favorably for the market. As a result, Bitcoin has moved toward 117,048.
💥 At the moment, most of the positions we’ve opened are in profit. Because of this, taking some profit could be a smart option, since Bitcoin might enter a corrective phase once it reaches the 117,048 level.
📈 For new entries, a clean breakout above 117,048 would be a valid trigger. However, the chance of breaking this zone on the first attempt is low, and there’s a strong possibility that price will wait for Powell’s upcoming speech before making its next decisive move.
📊 We can also use RSI’s move into the overbought zone as a momentum confirmation. If that happens, it could set off a powerful bullish leg to the upside.
❌ Disclaimer ❌
Trading futures is highly risky and dangerous. If you're not an expert, these triggers may not be suitable for you. You should first learn risk and capital management. You can also use the educational content from this channel.
Finally, these triggers reflect my personal opinions on price action, and the market may move completely against this analysis. So, do your own research before opening any position.
BTCUSDT

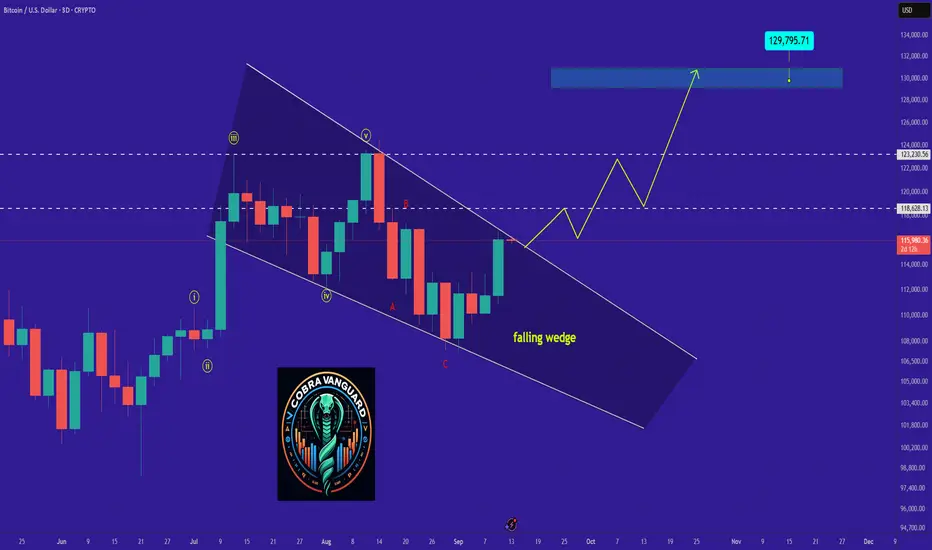
BTC is bullish now and many Traders don't see it !So if you pay attention to the BTC chart you can see that the price has formed a Ascending wedge which means it is expected to price move as equal as the measured price movement.( AB=CD )
NOTE: wait for break of the WEDGE .
Best regards CobraVanguard
BTC logaritmic regresion analysisThe red lines mark the hypothetical range of maximum for this cycle.
Until now, BTC has been behaving just as expected. The green box should mark the way up.
The gray zones represent the premium and the discount regions. Up and down respectively.
Follow your own plan. Greed and fear are never good advisors.
This is just an opinion, not an advice of any kind.
Market is the only master of its actions.

BTC ANALYSIS🔮 #BTC Analysis
🌟🚀 As we said earlier #BTC moved around 5%. Right now we would see a little retest and then a bullish movement will be seen soon
🔖 Current Price: $1,15,858
⏳ Target Price: $1,21,713
⁉️ What to do?
- We have marked crucial levels in the chart . We can trade according to the chart and make some profits. 🚀
#MKR #Cryptocurrency #Breakout #DYOR

bitcoin vs. ethereum 2017\2025Bitcoin and Ethereum literally mirrored 2017.
CRYPTOCAP:BTC to $200k \ CRYPTOCAP:ETH to $10k

BTC Trade Update - Hidden Divergence on 30M TF📢 NFX Market Update – BITSTAMP:BTCUSD
A hidden bearish divergence has formed on the 30M timeframe around $116,700. This signals the likelihood of a short-term retracement in the next few hours.
🔒 Lock in partial profits and trail stops to protect gains. The broader trend remains bullish, and I still expect continuation after this pullback.

BTCUSD set to cross 127,000?BTCUSD pulled back to $107,309 upon crossing $124,567 , monthly closed with a long bearish candle. With new candle opened, market started bounce back to the major direction of the trend with a confirmation of daily cross over of 20ema and 10ema price may bounce off the current resistance to create a new all time high!

$BTC – Immediate Support BINANCE:BTCUSDT | 6h
The CME gap at 116.8k has now been filled, with price stalling at 115k
At the moment, the key area I’m watching is 114k. If we can find support and bounce here, there’s room for price to make another leg higher. The first target would be a retest of 116k, but momentum could extend toward 117.3k. That 117.5k level has been the major line in the sand for some time — it’s the level that needs to be reclaimed in order to shift market structure away from the current bearish bias.
On the flip side, if price pushes into the 116–117k zone and gets rejected again, I’d like to see 112k hold firm. A solid base at 112k would provide a higher-low structure and set the stage for continuation to the upside. Losing 112k would open the door for a retracement back to 109k.


The big move UP is comingHave published this one in the mind section fews times.
Now you can keep track ot it.
The fractal is working quite well. Combined with the parallel channel you get a better picture of the key levels. Also my custom EMA indicator is confirming the downside shorterms with a good opportunity to buy around 2.5 level.
Good luck all.

PPI Shock Pushes Bitcoin Higher – Fake Pump Before Drop?Bitcoin ( BINANCE:BTCUSDT ) has been making high momentum Sharpe moves over the last few days , which has made it a little difficult to trade, which is why I am still sticking to my previous analysis , and this analysis is an update of targets and even new entry points .
Bitcoin is currently moving near the Resistance zone($114,720-$113,580) , Reversal Zone(PRZ) , Cumulative Short Liquidation Leverage($114,510-$113,771) , Monthly Pivot Point , and Resistance lines = a set of Resistances
A few minutes ago, the US Core PPI m/m and PPI m/m data were released, which triggered a pump in Bitcoin . In my view, we should wait for Bitcoin to digest this shock and then continue its real trend .
Do you agree with me?
In terms of Elliott Wave theory , it seems that Bitcoin has completed microwave 5 of microwave C of the main wave Y , and we can expect a downtrend .
I expect Bitcoin to drop again to at least $111,600(First Target) .
Second Target: $110,883
Third Target: $110,000 and more dumps.
Stop Loss(SL): $114,923(Worst)
CME Gap: $117,235-$113,800
Cumulative Long Liquidation Leverage: $110,822-$109,752
Note: Be sure to follow capital management and do not take risks.
Please respect each other's ideas and express them politely if you agree or disagree.
Bitcoin Analysis (BTCUSDT), 1-hour time frame.
Be sure to follow the updated ideas.
Do not forget to put a Stop loss for your positions (For every position you want to open).
Please follow your strategy and updates; this is just my Idea, and I will gladly see your ideas in this post.
Please do not forget the ✅' like '✅ button 🙏😊 & Share it with your friends; thanks, and Trade safe.

Precise Prediction and Forecast for BTCUSD MarketYesterday, we accurately predicted that BTC would rally to around 116,000 USD and face certain resistance. Today, after breaking through 116,000 USD as expected, the price retraced to hover around 115,000 USD.
Looking ahead, if BTC can stabilize near the 115,000 USD level, it is highly likely to continue its upward trajectory, with the potential to retest the 120,000 USD mark. For upper resistance, the focus remains on the 117,000–118,000 USD range
Buy 114000-114500
TP 115000-116000-1175000
Daily-updated accurate signals are at your disposal. If you run into any problems while trading, these signals serve as a reliable reference—don’t hesitate to use them! I truly hope they bring you significant assistance

BTCUSD 4-Hour Chart AnalysisLooking at the BTCUSD 4-hour chart, the price has recently exhibited a dynamic trend. After a prior upward movement, it underwent a pullback. Now, it has found solid support at the 112,500 level. This support zone appears reliable, as the price has stabilized above it, indicating that buying interest has emerged here to prevent further declines.
In terms of resistance, the 116,000 level is a key hurdle to watch. If the price can successfully break through 116,000 with strong momentum, it would open the door to further upside potential. Before that, the 115,000 level could act as a near-term resistance to test the bulls' strength.
For traders, the strategy could be to monitor the price action around the 112,500 support. If the support holds and there are signs of a bullish reversal , it may be an opportunity to consider long positions with a target towards 115,000 and then 116,000. Conversely, a breakdown below 112,500 would shift the bias to the downside, with the next support level to watch at 110,640
Overall, the near-term trend hinges on the price's interaction with the 112,500 support and the subsequent attempt to challenge the 115,000 - 116,000 resistance zone.
Buy 112500 - 113500
TP 114500 - 115500 - 116000
Daily-updated accurate signals are at your disposal. If you run into any problems while trading, these signals serve as a reliable reference—don’t hesitate to use them! I truly hope they bring you significant assistance

BTC/USDT: Bitcoin Surge to 118K?🚀 BINANCE:BTCUSDT is shaping up for a bullish move on the 4-hour chart , with an entry zone between 109000-110000 near a key support and rising trendline.
🎯 First target at 113500 marks initial resistance, second at 114500 , and a third at 118000 could signal a major breakout! 📈 Set a stop loss on a 4hours close below 107240 to manage risk.
🌟 A break above 110500 with strong volume could trigger this rally, driven by market sentiment and whale activity. Watch BTC dominance! 💡 Ready for this lift-off? Drop your take below! 👇
📝 Trade Plan:
✅ Entry Zone: 109,000 – 110,000 (support)
❌ Stop Loss: close below 107,240 to manage risk
🎯 Target 1: 113,500 (first resistance)
🎯 Target 2: 114,500 (secondary resistance)
🎯 Target 3: 118,000 (final target)

Trade Insight BTC, ETH & GOLD📢 NFX Market Update – BITSTAMP:BTCUSD BTC, BINANCE:ETHUSD & FX:XAUUSD
Similar to Ethereum, Bitcoin (BTCUSD.r) is facing a potential heavy block order between 114,750 – 115,000. On the H1 chart, a divergence formation is signaling the risk of a short-term retracement. Price is consolidating, and I expect a pullback toward the ascending triangle breakout zone, which now acts as support.
Given current volatility and conflicting signals, I strongly recommend staying off trading on Ethereum, Bitcoin, and Gold until the market cools off and provides a clearer direction.
Patience here is key - let the market reveal its next move before stepping in.💚

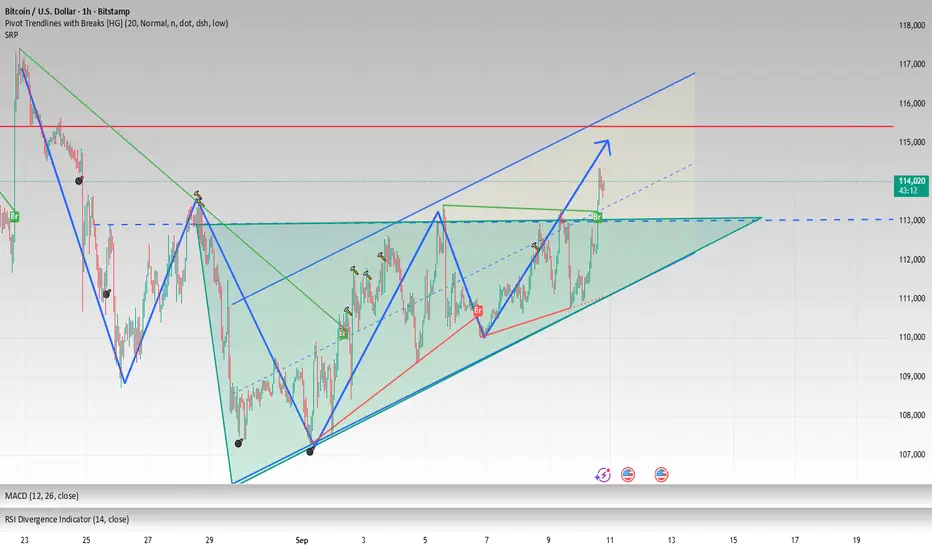
BTC 1H Analysis - Key Triggers Ahead | Day 39😃 Hey , how's it going ? Come over here — Satoshi got something for you!
⏰ We’re analyzing BTC on the 1-Hour timeframe.
👀 On the 1H timeframe for Bitcoin, we can see that BTC has been ranging since yesterday’s news. A breakout and confirmation above the range high or below the range low will give us a trading setup. The key levels are $114,407 on the upside and $113,528 on the downside.
Today’s hot topic is the US CPI inflation data, which is a high-impact event at the very top tier of importance.
⚙️ On the RSI, Bitcoin is moving between the 50–70 zone. A breakout beyond these values, in alignment with a price breakout, could generate strong trade entries.
🕯 Candle structure shows that green candles are getting larger with more volume, while red candles are more frequent but smaller each time—so much that the market is starting to ignore them. The range high is very critical; it could break with a whale candle or even an indecision candle right before the move. Order type matters here—whether you use a trigger order or market entry on candle open will impact the trade.
📊 On the 1H Tether dominance, we’re also seeing a range—opposite in behavior to Bitcoin—with a range high at 4.37% and low at 4.32%. With BTC’s underlying trend on the 1H still bearish, there’s a decent probability of a downside break in USDT dominance while BTC breaks the upside of its range.
📊 On the 1H BTC.D , after a strong leg down, BTC.D has dropped below the 0.618 retracement level of its previous range and failed to hold support. We might see a small bounce/retest of that area, but unless today’s CPI causes major volatility, the broader expectation remains further downside in dominance.
🔔 The CPI report could bring serious volatility today. Yesterday’s news triggered nearly $750M worth of Bitcoin buys, sparking a strong rally with only minimal compression-style pullbacks. If today’s inflation data triggers a breakout above $114,407, and we see dominance dropping at the same time, large-cap projects are likely to pump even harder than Bitcoin itself.
❤️ Disclaimer : This analysis is purely based on my personal opinion and I only trade if the stated triggers are activated .

BTCUSDT - Short-Term Pullback Opportunity?Hello everyone, today let's analyze BTCUSDT in the current market context. The 3-hour chart shows that BTCUSDT has been on a strong uptrend, but it has now encountered strong resistance at the 114,800 USD level. If this level is not broken, a short-term pullback is highly likely.
Currently, a pullback seems necessary after a significant rally. The nearest support level is 112,200 USD, and if this is broken, the price could decline further. This correction could be temporary before the uptrend resumes, but if the support is not maintained, BTCUSDT could face a deeper drop.
Trading Strategy:
Sell if the price continues to face resistance at 114,800 USD.
Watch key support levels, especially 112,200 USD, for a potential entry point.
In conclusion, BTCUSDT may experience a pullback in the short term. If the key support is broken, the downtrend could continue. Stay alert for clear signals before entering the trade!

BTCUSD 4-Hour Chart Analysis
In terms of resistance, the 116,000 level is a key hurdle to watch. If the price can successfully break through 116,000 with strong momentum, it would open the door to further upside potential. Before that, the 115,000 level could act as a near-term resistance to test the bulls' strength.
For traders, the strategy could be to monitor the price action around the 112,500 support. If the support holds and there are signs of a bullish reversal , it may be an opportunity to consider long positions with a target towards 115,000 and then 116,000. Conversely, a breakdown below 112,500 would shift the bias to the downside, with the next support level to watch at 110,640
Overall, the near-term trend hinges on the price's interaction with the 112,500 support and the subsequent attempt to challenge the 115,000 - 116,000 resistance zone.
Buy 112500 - 113500
TP 114500 - 115500 - 116000
Daily-updated accurate signals are at your disposal. If you run into any problems while trading, these signals serve as a reliable reference—don’t hesitate to use them! I truly hope they bring you significant assistance

$BTC bounce at $112 or drop down to $101.3??CRYPTOCAP:BTC is forming a massive “M” pattern with a potential target around $101.3.
There are multiple support levels on the way down, so a bounce could happen at any of them. Ideally, this scenario gets invalidated with a strong rebound from $112K. Otherwise, the correction may drag on for weeks until a solid bottom is found.
The RSI is oversold on the 2H, but on the 1W timeframe, CRYPTOCAP:BTC looks like it’s just entering a longer-term correction.
⚠️ If the weekly bearish trend confirms, we could be facing several months of downside.
Will this trigger the start of alt season, or will altcoins get crushed even harder? Nobody can say for sure—so stay cautious and don’t get trapped by FOMO.
Here is the 1W chart, which is scary to be honest.
$BTC : bearish MACD crosover on 1WThe chart speaks for itself: we have a bearish crossover on the weekly MACD — historically a strong signal for a 3 to 6-month correction.
I know this goes against the current bullish sentiment, but every time this setup has appeared, the market corrected for several months. This time, however, the RSI isn’t extremely overbought, which could mean a shorter correction (1–2 months).
👉 Will this time be different?
If history repeats, the correction target sits around $96K–$98K at the 50-week SMA, a level that has always provided strong support in the past.
But if that support breaks… welcome to a new bear market.

BTC-USD Trade Insight 📢 NFX Trade Alert – Swing Setup
💹 Instrument: BITSTAMP:BTCUSD Bitcoin (BTCUSD.r)
🛒 Trade Type: Swing – Buy at Market
📍 Entry: $113,750
⛔ Stop Loss: $112,500
✅ Target Profit: $123,000
Analysis:
BTC has reclaimed bullish momentum, forming a bullish flag right above the key ascending triangle breakout level. Price structure remains strong, with buyers stepping in around the $114k zone. These dynamics reinforce our trade bias, keeping the upside toward $123k firmly in play.

BTC/USD – Liquidity Grab Before Downside MoveBTC/USD – Liquidity Grab Before Downside Move
Price is currently setting up for a retracement to the upside, likely sweeping excess liquidity before forming equilibrium. This move will provide the market with balance before continuing lower.
📍 Point of Entry
I’m watching the highlighted zone for a reaction after liquidity is taken. This level offers a potential short setup with strong risk-to-reward.
📉 Bearish Scenario
After the liquidity grab, price is expected to rotate lower and revisit the support zone, aligning with the 4H Fair Value Gap (FVG). This will be the key area to monitor for continuation or a potential bounce.
🔑 Market Outlook
Retracement upward → Liquidity grab.
Downward continuation → Support & 4H FVG retest.
Break below support → Opens further bearish targets.

BTC forms an ascending triangle, 113000 is just the beginningBITSTAMP:BTCUSD BTC saw a slight rise during the day. From the hourly and 4H charts, the MACD technical indicator formed a golden cross and broke through the upper short-term pressure of 113000. The short-term trend formed an ascending triangle. Bold and aggressive investors can rely on 113500-112000 to go long, with the target looking at 115500-116500.