My only remaining hope for bitcoin !!!I might be wrong and this might never happen, but it might come true From a technical perspective!!!
BTCUSDT

Will Bitcoin goes for 14500? WeeklyThis is the last analysis's weekly time frame chart.
Everything is clarified in the chart you can see upgoing and downgoing cycles after every bitcoin halving.
RSI had a downward breakout the red RSI trend line named T1 and pull backed to it in the weekly timeframe where you can see a little red rectangle and arrow there. The continuation of the RSI path is probably like the blue line drawn named R1.
About the BTC price, I am expecting the price to reach 14500 - 19000 dollars until Dec 2022. of course, it can reach that target a few months earlier or late.
Note that before Halving 2024 bitcoin will not have ATH. It means before Apr 2024 bitcoins price will be under the 69000 and even maybe 50000 dollars. After that time the price will go to 120000 dollars.
Do not forget that the trend of the bitcoin and crypto market is still downward and bearish.
You can see my idea about this analysis in a monthly time frame in another published idea on my profile page.

Bitcoin Recovery Setup: BTC Price Rebound Signal & Trade IdeaHey traders.
Short update for BTC and next movement.
Basically we moving in the bullish flag and according to some signals most-likely we going to see BTC going to the top of this channel.
Few reasons:
1) RSI crossed and confirmed (red circle marked)
2) Recovery of the whole market
Points to watch:
1) Low volumes - seems like we not going to break much this flag range (be careful)
2) Money can flow to altcoins - so BTC going to flat
If you want to trade, set up TP at the price around orange line and follow RM.
Share your insights in the comments

Macro liquidity benefits have taken effectThe US Senate has reached an agreement to end the federal government's "shutdown", extending the funding until January 30th next year. This shutdown had led to a tightening of liquidity in the money market, and with the agreement reached, TGA funds will be gradually released, directly improving the market liquidity environment. As a risk asset sensitive to liquidity, Bitcoin has responded first, breaking through the $106,000 whole number level. The expectation of loose liquidity will continue to provide upward momentum in the future. At the same time, the market expects a higher probability of the Fed cutting interest rates in December, further reducing the opportunity cost of holding Bitcoin.
Bitcoin trading strategy
buy:105000-105500
tp:106000-106500
sl:104000

Analytics: Market Outlook and Forecasts
📈 WHAT HAPPENED?
Last week, we expected a test of the lower boundary of the sideways channel around the $102,000 mark. Despite the fact that the probability of holding the level was initially assessed as low, the market actually implemented it. After a false breakout, large volume anomalies appeared, and a second test of the zone confirmed its protection.
By Friday, we were once again considering the possibility of a weakening seller and the resumption of local growth.
💼 WHAT WILL HAPPEN: OR NOT?
The price has now reached the first resistance zone. This and the next selling zone are key. With a high probability, they will trigger a correction in the current local growth.
To confirm the movement towards the upper limit of the global sideways (at $116,000), we must see a strong buyer defense in the next selling wave. Otherwise, the potential for decline will be directed towards the area of $97,000-$93,000.
Buy Zones:
~$103,300 (local support)
$102,000–$100,000 (volume anomalies)
$97,000–$93,000 (high-volume zone)
Sell Zones:
$105,800–$107,400 (pushing volumes)
$109,500–$110,700 (accumulated volumes)
$112,400–$113,300 (accumulated volumes)
$114,700–$115,700 (accumulated volumes)
$120,900–$124,000 (high-volume zone)
📰 IMPORTANT DATES
Macroeconomic events that we can expect this week:
• November 12, Wednesday, 7:00 (UTC) - publication of the German Consumer Price Index for October;
• November 13, Thursday, 7:00 (UTC) - publication of the UK GDP for the third quarter and for September;
• November 13, Thursday, 13:30 (UTC) - publication of the US Core PCE for October, as well as the number of initial applications for unemployment benefits in the US.
*This post is not financial recommendation. Make decisions based on your own experience.
#analytics

Bitcoin Daily Outlook: Support and Resistance in FocusHey Guys,
Looking at Bitcoin on the daily chart, the 105,000 to 98,000 levels are strong support zones. This means that as long as the price does not fall below these levels, a sharp decline in Bitcoin is unlikely.
The price touches these areas, but whales prevent it from breaking lower with strong buying, pushing it back up again.
The 113,000 – 116,000 levels are strong resistance zones.
As long as Bitcoin does not fall below 98,000, my target remains 113,000.
Currently, Bitcoin is trading at 105,887. Once my target is reached, I will provide updates.
Every single like I receive from you is my greatest motivation to share these analyses. I sincerely thank everyone who supports me with their likes.🙏

BTC 4H Bullish setupBitcoin is showing early signs of a potential reversal after testing key support levels within the descending channel. Price action is consolidating around $102.2K, with several bullish confluences hinting at a possible bounce.
🔍 Bullish Confluences
Channel Support Retest – Price is reacting off the lower boundary of the descending channel, historically a bounce zone.
Volatility Band Support – Candles are forming near the green lower band, signaling potential exhaustion of selling pressure.
Momentum Divergence Potential – Market structure suggests a possible bullish divergence forming, supporting a short-term recovery move.
🎯 Fibonacci Targets
38.2%: $103,850
61.8%: $104,308
100%: $106,286
A clean break above $103.8K could confirm bullish momentum and open room toward the $106K resistance zone.

Interval arbitrage strategyCurrently, the price of Bitcoin at $106,257 is within a short-term oscillation range of "clear support - clear resistance - balanced momentum". The strong support at $105,000 - $105,500 and the high resistance at $106,000 - $106,500 form a natural arbitrage space. The lack of incremental capital, the digestion of macro benefits, and the bias towards long-term positioning by institutions have further strengthened the rationality of the range trading. The core of trading lies in "precisely anchoring the boundary of the range + batch buying and selling + strict stop-loss". By confirming the entry timing through technical signals, verifying the validity of the range through capital data, and controlling risks with scientific position management. For international analysts, the key to this strategy lies in real-time tracking of the price feedback and capital movements at the range boundaries, locking in certain arbitrage gains in the oscillating pattern, while also being vigilant against sudden risks of range breakouts, and ensuring the flexibility and discipline of strategy execution.
Bitcoin trading strategy
buy:105000-105500
tp:106000-106500
sl:104000

BTCUSDTBTCUSDT price is in the key support zone 100025 - 99036. If the price cannot break through the 98491 level, it is expected that the price will rebound. Consider buying the red zone.
** Very Risky Trade
🔥Trading futures, forex, CFDs and stocks carries a risk of loss.
Please consider carefully whether such trading is suitable for you.
>>GooD Luck 😊
❤️ Like and subscribe to never miss a new idea!

BTCUSD: Stabilize above 105,000BTC rose to break through and stabilizing above 105,000 today, surpassing last week's short-term resistance level. Next, we will focus on whether the key resistance level at 108,000 can be broken.
We predict that Bitcoin's movement today will fluctuate within the range of 104,000-108,000. If it can sustain a breakthrough above 108,000, we expect an upward trend to emerge this week.
Buy 103,000 - 103,500
SL 102,500
TP 104,500 - 105,000 - 105,500
Sell 105,500 - 106,000
SL 106,500
TP 104,500 - 104,000 - 103,500

Bitcoin: Not Dead Yet - Altseason Incoming...All In Before the Explosion: Bitcoin’s Next Leg and the Incoming Altseason Wave
Once again I'm ALL IN on IG:BITCOIN and a few selected ALTS.
Bull market NOT over.
🔥Altseason hasn’t even started warming up and this is not hopium ...
Here’s the raw macro truth the chart is yelling:
INDEX:BTCUSD is sitting cleanly inside the macro demand zone
Still riding the ascending channel that has carried every major leg of this cycle
No top. No breakdown. No weakness.
This is positioning , not exhaustion.
⏱ Cycle Structure:
• Each expansion leg: 14–15 weeks 📈
• Each correction: 16–18 weeks 📉
We’re exiting the correction window (ends Nov 10th🗓️)→ entering the next expansion phase.
📊 What the chart confirms:
• Long-term channel from Jan 2024 still intact → trend pointing to six figures.
• Weekly demand zone acting as controlled re-accumulation , not distribution.
• Clear trigger: break above $126K → macro ignition.
• Weekly RSI sitting on base support ⚫ → same level that preceded every major leg up.
• High-timeframe target for this cycle still $150K–$170K →parabolic to 220k+ 🎯
• Volume profile shows accumulation not distribution 🎯
📝 Scenarios:
1️⃣ Direct Blast-Off 🚀
Demand zone holds → $126K break → new ATH → trend accelerates into $160K–$170K.
2️⃣ Manipulation Flush 🩸
Wick below demand(flash crash to $90k) → mid-channel tap → violent reclaim → same final target.
❌ Invalidation:
Only a weekly close below the channel kills the structure.
Nothing else matters.
✅ Bottom Line:
This bull market isn’t cooling, it’s reloading .
Bitcoin is gearing for its next expansion wave, and alts will follow with the delayed, violent, inevitable altseason.
This next leg is where generational entries pay off or get regretted.
My stake is on IG:BITCOIN where is yours?

LINK LONG — FROM MATH TO MARKET STRUCTURE: An Extensive AnalysisTraders,
In my latest BINANCE:LINKUSDT analysis I started my thesis with " I BELIEVE THE CRYPTO MARKET IS SETTING UP FOR A BIG, BIG, BIG DUMP! NOT JUST LINK! "
It wasn’t coincidence that I wrote those words in caps lock. The market was whispering louder than usual: not in price, but in data. Every metric pulsed in rhythm, like the heartbeat of a system about to release its tension. The numbers weren’t random; they were poetry in motion, quietly syncing toward one inevitable point. Sometimes, data doesn’t just inform — it sings. And when it does, your fingertips start typing before your mind even realizes what the melody means.
Now we’re back — same chart, same logic, but a different side of the market.
I’m going to analyze it the same way I did before — step by step, math-backed, structure-based, and logic-driven.
Only this time, it’s even more extensive.
For free. For nothing. So that you, the people who actually care to learn, can start to see how markets truly work. How they breathe, trap, rotate, rebalance — and how every candle hides intent.
I believe the BINANCE:LINKUSDT dump might be over — for now, at least — and that the market is slowly starting to build upward momentum. This post is not a quick “looks bullish” statement. It’s a structured walkthrough from mathematical foundation to market structure, liquidity, and order flow, showing why the $20–$21 region might become the next key target before a rotation lower.
Let’s go step by step.
Step 1 – Is There a Mathematical Reason to Say the Current Auction Might Be Finished?
By “auction,” I mean the move from a clear swing high to a clear swing low where sellers were in control. Markets move in auctions — from high to low, then pull back, then extend again. To determine whether a sell auction is finished, we measure how far it has retraced and extended.
After the 10 Oct liquidation event, price printed a clean new high — more valid than the liquidation spike. That’s point A (~20.15). From there, it sold off to point B (~15.70).
So our first auction is:
A → B | Direction: Down
Step 2 – Measuring the Retrace
Since the move was downward, I drew a Fibonacci retracement from A to B (high → low). nThat gives us retracement levels above price on TradingView.
Price retraced almost perfectly to the 0.786 level (~19.23) — not shallow (0.382 or 0.5), not extreme (0.886), but deep enough to classify as a “normal” yet decisive retrace.
That means sellers regained control after a 0.786 pullback, a key ratio in the Fibonacci family.
Step 3 – What Does a 0.786 Retrace Usually Lead To?
Here’s where the Fibonacci logic becomes meaningful. The 0.786 level is derived from the square root of the golden ratio inverse: √(1/φ). Its natural mirror on the other side of price is √(φ), or 1.272.
That’s why 0.786 retraces often project toward 1.272 extensions — the two are mathematically linked. Beyond that, the next probable extensions are 1.414 and 1.618.
So, for a 0.786 retrace, the Fibonacci extension ladder is:
Primary: 1.272
Intermediate: 1.414
Extended: 1.618
Step 4 – Did BINANCE:LINKUSDT Reach One of These Fibonacci Targets?
To check that, we reverse the Fibonacci — draw it from B to A (low → high). That prints the extension levels below the swing low.
Price hit the 1.414 extension almost perfectly before structure began shifting:
Lower lows stopped forming
Higher lows began to appear
Small higher highs emerged on lower timeframes
That’s a structural sign the sellers exhausted their leg — a textbook confirmation that the 1.414 zone completed the auction.
Step 5 – Confirming the Auction
The A → B auction retraced to 0.786, extended to 1.414, and then reversed in structure. This matches the Fibonacci expectation for a completed wave.
If the retrace had been 0.886 instead, we’d likely expect continuation to 1.618 — but since it was 0.786, the 1.414 tap followed by reversal fits perfectly.
✅ 0.786 retrace → 1.272 / 1.414 / 1.618 extension
✅ 1.414 tapped → structure reversed
We can reasonably call this auction finished.
Step 6 – Confluence from the Smaller ABC Swing
After the main leg, the market made a small rally and a lower high — point C. Using the Fibonacci Extension tool (A → B → C), we project this smaller swing.
Interestingly, the ABC projection lands exactly on the same 1.414 zone as the larger A → B measurement. That’s two independent Fibonacci constructions converging on the same price.
From a math perspective, this isn’t coincidence — both patterns use the same ratio family.
It’s proportion — the geometry folding back onto itself.
Nature’s Geometry on a Price Chart
This is where Fibonacci goes beyond numbers. The same proportions that define growth patterns in seashells, tree branches, sunflowers, hurricanes, and galaxies are present in the market’s structure.
Two distinct swings produce the same 1.414 target.That’s natural proportion — mathematical harmony showing up in price behaviour.
It’s not random. It’s geometry repeating itself.
Part 2 – The Structural Context: Liquidity and Value
We’ve identified our Potential Reversal Zone (PRZ) using Fibonacci confluence. Now let’s look inside the structure and the market’s underlying “memory.”
We’ll answer three questions:
Where does liquidity sit — which levels might the market hunt next?
What is the order flow showing — is there absorption or continuation?
What do the next extensions project mathematically?
1. Liquidity via TPO (Market Profile)
TPO (Time Price Opportunity) shows how much time price spent at each level. Clusters = acceptance and value. Gaps = imbalance and rejection.
Around $19.00, during TPO periods G, H, N, and O, price built acceptance but didn’t explore higher. That created a weak high — a level that often acts as a magnet for future liquidity hunts.
Another, slightly weaker high sits near $20.00, which is still unfinished.
And as James Bond said, “I never leave loose ends.” Neither does the market.
2. Anchored VWAP Confluence
Anchoring VWAP from the major swing high shows the blue AVWAP aligning almost perfectly with that $20.00 region. That gives strong confluence between volume-weighted value, liquidity, and structure.
3. Low Volume Nodes (LVNs) and Imbalance
Using the Fixed Range Volume Profile (FRVP) from A → B reveals clear low-volume zones — “air pockets” where price moved too fast to build volume.
Between $20.00 and $20.50, there’s a notable LVN, meaning price skipped over it during the selloff.Such zones often act as magnets — the market tends to revisit them to rebalance unfinished business.
Now we have three layers of confluence:
Weak high at $19.00–$20.00
Anchored VWAP aligning with $20.00
LVN pocket at $20.00–$20.50
That defines a clear liquidity and target zone.
Structure and Confluence Summary
PRZ established through Fibonacci symmetry
Structure showing higher lows and early accumulation
Confluence cluster between $20.00 and $20.50, combining:
Weak highs
Low-volume node
Anchored VWAP
Market Profile imbalance
The setup aligns across math, volume, and structure.
Part 4 – Order Flow: What Lies Beneath the Candles
From the outside, price action looks calm — clean candles, defined Fibonacci levels, and structure that seems perfectly balanced. But the real story is hidden underneath, inside the Order Flow.
Every candle represents a battle — between aggression and absorption, buyers and sellers, liquidity and imbalance. Understanding who is winning that battle tells us whether a move is genuine strength or a trap waiting to unwind.
Order Flow allows us to look beneath the surface and see where transactions are actually happening — where volume clusters, where buyers are absorbed, and where sellers are defending. It’s the market’s heartbeat.
The Current Picture
Here’s what we see right now on BINANCE:LINKUSDT :
CVD (Cumulative Volume Delta) — across both spot and futures (stablecoin- and coin-margined contracts) — is making lower highs, showing persistent sell aggression.
Yet price itself is not breaking down. Instead, it’s holding steady and even forming higher lows.
Meanwhile, the A/D (Accumulation/Distribution) line is rising, indicating that despite heavy selling pressure, buyers continue to absorb and accumulate.
That means one thing:
aggressive sellers are being absorbed by large passive buyers quietly taking the other side.
Recognizing the Setup
Let’s break down the pattern:
CVD ↓ → sustained sell aggression
OI ↑ → new short positions entering the market
Price ↔ or ↑ slightly → absorption and accumulation taking place
When these three align:
It often signals a short trap forming.
Sellers feel in control because CVD shows selling dominance.
In reality, their aggression is being absorbed by larger passive buyers.
Once that liquidity runs out and buyers stop absorbing, shorts are trapped.
Those trapped shorts must cover — triggering a fast, aggressive short squeeze upward.
Also: CVD on Stablecoin Margined Contracts remains flat while Stablecoin Margined Open Interest rises — showing aggressive shorting being absorbed by larger buyers. Price stability suggests accumulation, not weakness. Since OI stays high, those shorts are still in the game, meaning their positions haven’t been closed yet. If price starts to move up, they’ll be forced to cover — setting up the conditions for a short squeeze.
Absorption in Context
Absorption isn’t random — it’s the footprint of strong hands quietly taking in sell pressure without letting price break down. While most see weakness, they’re actually witnessing controlled accumulation.
Here, price holds steady as CVD trends flat and OI stays high — meaning aggressive shorts are still in the game, being absorbed by larger buyers. Every new short adds fuel to the spring.
When that pressure releases, it doesn’t drift — it snaps. Shorts are forced to cover, triggering a sharp, emotional squeeze toward the next liquidity zone around $20–$20.50, where Fibonacci confluence and a weak high align.
This is where microstructure meets the macro picture — absorption building the base for a violent move higher.
Part 5 – Fibonacci Extension Confirmation
To justify the $20–$21 target mathematically, we apply one more Fibonacci extension —
from the last swing low to the recent high, projected forward.
The 1.618 extension aligns almost perfectly around $20.00, adding strong mathematical confluence to our previously defined liquidity and structure zone.
That makes $20.00–$20.50 a textbook target cluster — a Fibonacci, liquidity, and volume alignment.
Final Outlook – The Path Ahead
Based on all the combined data:
Fibonacci structure shows completion and new expansion potential
Market Profile and VWAP reveal unfinished business around $20–$20.50
Order Flow confirms absorption and hidden accumulation
The 1.618 Fibonacci projection reinforces this level as a natural mathematical destination
I believe the market will squeeze upward toward $20–$21, taking out the weak high and the LVN pocket — and once that liquidity is collected, rotate back down to restore balance.
The setup is mathematically justified, structurally valid, and order-flow supported — a complete picture of how Fibonacci geometry, structure, and liquidity align to reveal where the next phase of this auction may unfold.
If price slips lower instead, the key level to watch is $12.90 — the latest 1.618 extension from the initial wave we measured earlier. That remains the deep liquidity and structural boundary where balance could be restored.
Last words.
Everything we have mapped — Fibonacci structure, confluence, liquidity, and absorption — means nothing without the psychology behind it. The market is not just math and candles; it is a mirror of collective emotion. Every trapped short, every breakout chase, every hesitation is human behaviour written in numbers.
When confidence is at its peak, risk is usually greatest.
When fear dominates, opportunity hides in plain sight.
That is why sentiment often reaches its extreme just before reversals. Most traders only see what is already visible, not what is quietly building beneath the surface.
So next time you scroll through social media or read the news about what everyone expects, remind yourself of this:
When everyone sees the same breakout, the trade was over hours ago.
And the markets whisper long before they speak.
From the depths of the sands,
ThetaNomad
------------------------------------
If you enjoy this kind of analysis, leave a like and drop a comment. I don’t ask for anything — I just want to help more people learn to look behind the charts, to see the story that price and volume quietly write together.

$BTC Monthly ViewWe are at the very beginning of the bear market.
Even if we have a 2nd Manipulation (NEW ATH), that's not necessarily happening, as we've already grabbed the liquidity but know that new ATH will not change the analysis.

$BTC Same zone. Same faith.Bitcoin is once again holding at the VWMA and SMA13 support on the monthly chart.
From past to present, the trend has never changed unless these supports were broken.
As long as monthly closes stay up...
Everything else is just noise.

Bitcoin, Ether and SolanaBITSTAMP:BTCUSD
COINBASE:SOLUSD
COINBASE:ETHUSD
Looking for this on the crypto market. Bullish narrative across the arena

Bitcoin Bulls Defending $97K – Reversal Loading!Before diving into the Bitcoin analysis , it’s worth noting that Bitcoin has had a strong correlation with the SPX500 index ( SP:SPX ) in recent weeks. So, alongside analyzing Bitcoin, it’s a good idea to keep an eye on the SPX500 chart these days.
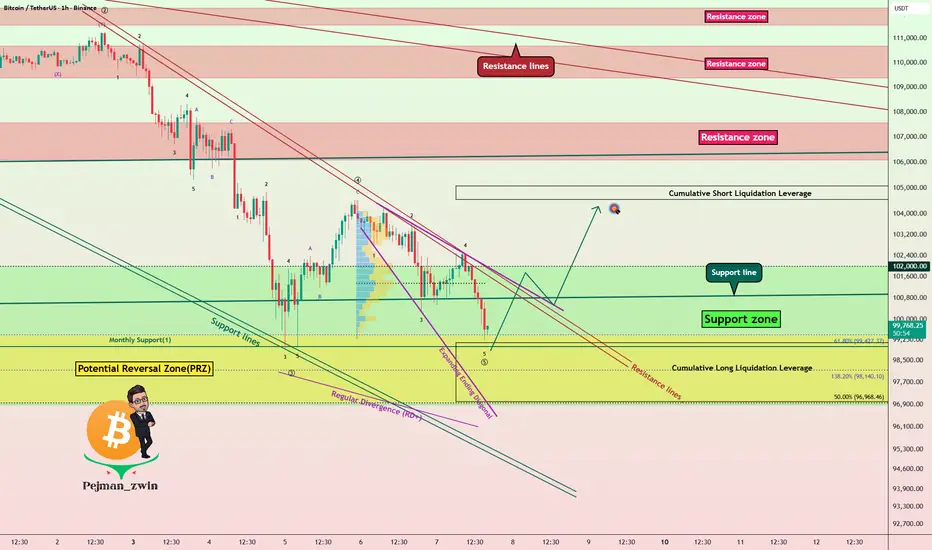
Currently, Bitcoin( BINANCE:BTCUSDT ) is moving in a Support zone($10200,980-$96,880) near a Potential Reversal Zone(PRZ) and a Cumulative Long Liquidation Leverage($99,145-$97,208) .
From an Elliott Wave perspective, it looks like Bitcoin is forming an Expanding Ending Diagonal to complete the microwave 5 of the main wave 5 .
Also, we can see a Regular Divergence(RD+) , which is a good sign of a potential reversal.
Given my expectation that the SPX500 Index will start to rise again, I also expect that Bitcoin will follow suit and could climb at least to around $104,200 .
Cumulative Short Liquidation Leverage: $105,074-$104,551
Stop Loss: $96,178
Please respect each other's ideas and express them politely if you agree or disagree.
Bitcoin Analysis (BTCUSDT), 1-hour time frame.
Be sure to follow the updated ideas.
Do not forget to put a Stop loss for your positions (For every position you want to open).
Please follow your strategy and updates; this is just my Idea, and I will gladly see your ideas in this post.
BTCUSDT(BITCOIN): Bitcoin is bearish for now at least! Bitcoin is in distribution phase if we using the smart money concept, that is why we think price is at the final point before it drop faster. There will be mixed views regarding the bitcoin, but this is our personal view and which is more likely view compare to buying. Please use accurate risk management while trading bitcoin. This setup may take time to get it completed, and we will keep you guys updated.
Good luck and trade safe!
Team Setupsfx_

Bitcoin Daily View — Triangle in Play, Bears May StayIn my view, Bitcoin is currently forming a corrective triangle (ABCDE), and the breakout seems more likely to occur to the downside.
🎯 Targets:
• 1️⃣ 98,000
• 2️⃣ 94,000
• 3️⃣ 92,000
❌ Invalidation Level: 104,500
In my previous posts, I mentioned that I expect Bitcoin to eventually reach 83,000, but for now, I’m setting my target at 92,000, as I don’t think it will drop that far immediately.
⚠️Disclaimer: This is just my personal market view, not financial advice. Always trade with stop-losses!
💬 Share your thoughts in the comments and follow for upcoming Bitcoin updates!
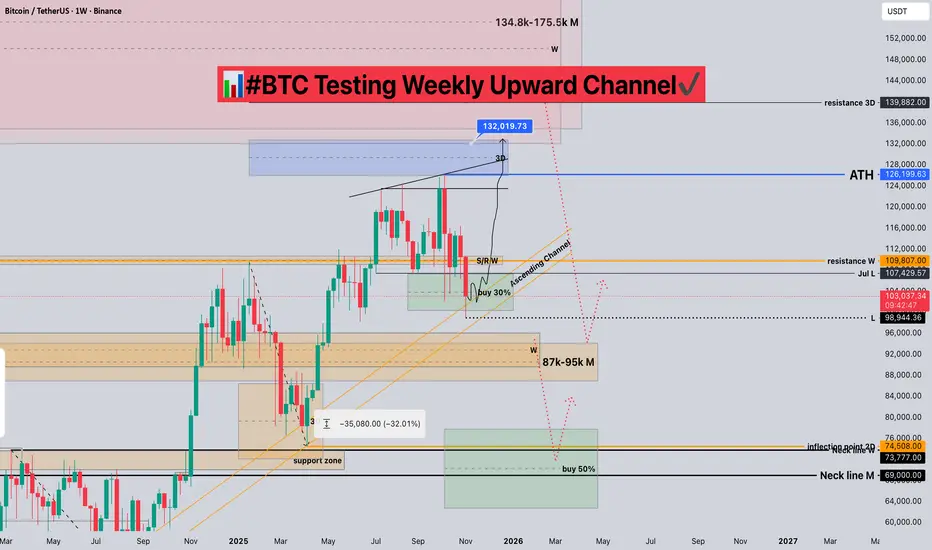
#BTC Testing Weekly Upward Channel📊#BTC Testing Weekly Upward Channel✔️
🧠The overall uptrend remains intact. We are currently testing the weekly upward channel. If we can find support here, we might see a new breakout.
➡️We currently hold a 30% spot position here. If we fail to find support here, the next support level to watch is around 74508.
Let's see 👀
🤜If you like my analysis, please like 💖 and share 💬
BINANCE:BTCUSDT
BTCUSD : Bulls Trying to Reclaim Momentum!Bitcoin has bounced sharply after a deep correction, hinting at a possible short-term recovery phase. If structure holds, we could see one more leg up before the next consolidation or reversal. Key zone to watch: $105,000–$106,000 for potential resistance.
Disclosure: We are part of Trade Nation's Influencer program and receive a monthly fee for using their TradingView charts in our analysis.

Bitcoin sell 15 minBitcoin sell 15 min
Analysis from ABIPA strategy
Advance Blended Institutional Price Action

Bitcoin at a Decision Zone – Day 1👋🏻 Hey everyone! Hope you’re doing great! Welcome to SatoshiFrame channel.
✨ Today we’re diving into the 1-Hour BITCOIN analysis. Stay tuned and follow along!
🪙 Bitcoin on its one-hour timeframe is currently within a trading range, and due to the holidays, both volume and volatility have dropped to their lowest levels. According to the analysis, an important resistance has formed around $103,912, and a micro buyer support around $100,288. Once either of these zones is broken, Bitcoin could provide a trading opportunity.
📊 Bitcoin’s volume on the one-hour timeframe has now reached its lowest level, indicating that we are close to a potential move. This suggests possible upcoming volatility. As for the micro buyer floor, this level is crucial for buyers — when price reaches it, buying volume typically increases. To break this zone, it would require significant selling volume and large whale candles to overcome the long-biased traders.
🧮 My favorite oscillator, RSI, is also ranging between 30 and 70, which nicely overlaps with the identified support and resistance levels. A breakout from these RSI limits can confirm our risk level and validate potential trade entries.
✍️ You can read the possible scenarios for this trading range below. If needed, set your alert zones and use them accordingly. Don’t forget proper risk and capital management.
↗️ Long Position Scenario: A breakout above $103,912, accompanied by an increase in buying volume, would validate a potential long setup. This volume increase should also align with the oscillator, meaning RSI should break above 70 on the 1-hour or 15-minute multi-timeframe chart, along with increased market volatility.
📉 Short Position Scenario: A breakdown below the micro buyer floor at $100,288, with selling pressure and RSI falling below 30, could confirm a short position. However, it’s recommended to wait for a pullback after the breakout before entering the trade.
❤️ Disclaimer : This analysis is purely based on my personal opinion and I only trade if the stated triggers are activated .

TradeCityPro | Bitcoin Daily Analysis #215👋 Welcome to TradeCity Pro!
Let’s move on to Bitcoin analysis. Today is Sunday, and the price is ranging inside a new box it has formed. The breakout from this box is critical and could be the start of the next move.
⏳ 1-Hour Timeframe
On the 1-hour timeframe, Bitcoin has formed a large ranging box between the 100,308 and 103,855 levels, and the price has already faked out once to the downside.
🔔 After this fakeout, a bullish move began, pushing the price up to 103,855.
✅ However, since this move happened on Friday and we entered the weekend afterward, the market's momentum has faded, and now, the price is ranging within a much smaller box.
🎲 This range is forming between 101,601 and 102,489, and breaking either of these levels could give us a position.
💡 A key point to remember is that volume must increase in the direction the price breaks. If volume diverges from the price, the move is likely to be a fakeout.
☘️ The main triggers are still 100,308 and 103,855. Breaking either of these zones will set off the next major move in the market.
❌ Disclaimer ❌
Trading futures is highly risky and dangerous. If you're not an expert, these triggers may not be suitable for you. You should first learn risk and capital management. You can also use the educational content from this channel.
Finally, these triggers reflect my personal opinions on price action, and the market may move completely against this analysis. So, do your own research before opening any position.
