BTCUSDT(BITCOIN): Bitcoin is bearish for now at least! Bitcoin is in distribution phase if we using the smart money concept, that is why we think price is at the final point before it drop faster. There will be mixed views regarding the bitcoin, but this is our personal view and which is more likely view compare to buying. Please use accurate risk management while trading bitcoin. This setup may take time to get it completed, and we will keep you guys updated.
Good luck and trade safe!
Team Setupsfx_
Btcusdtanalysis

Conducting a multi-core factor analysisThe positive macro policies continue to be released: The expectation of the Federal Reserve to cut interest rates is the current core driving force. Federal Reserve Governor Whelley, San Francisco Federal Reserve President Daly, and other officials have expressed support for a rate cut in December. The expectation of easing will cause a large amount of funds seeking high returns to flow into risky assets such as Bitcoin. In addition, the US SEC has accelerated the approval process for crypto ETFs, with over 130 pending applications entering the fast lane. The expectation of compliant funds entering the market has increased, providing important support for the Bitcoin price.
Technical indicators have sent multiple bullish signals: After Bitcoin's single-bottom formation on November 21, the daily line has rebounded for three consecutive days. The 25-day range was once close to the $89,000 threshold. On the indicators, the green column of the daily MACD has shortened for several consecutive days, and the bearish momentum has continued to weaken; the MACD at the hourly level crossed above and moved upward, and the price stabilized above the 7-hour EMA line, providing effective short-term support. At the same time, the Fear and Greed Index has been in an extremely fearful range for a long time, which is often an important bottom signal in history, and there is considerable upward potential in the future. The Elliott Wave Theory also shows that this low point tested the fourth wave target area, and there is a possibility of initiating a fifth wave rise.
Bitcoin trading strategy
buy:86000-87000
tp:88000-89000-90000
sl:85000

Bitcoin - H1 Breakout Alert – Bulls Taking Control!BTC/USDT - Bitcoin has officially broken its descending trendline and completed a successful retest from the demand zone. This shift signals a potential momentum reversal, with buyers stepping in aggressively after weeks of corrective price action. BINANCE:BTCUSDT
🔍 Technical Overview
✔️ Clean trendline breakout on H1 timeframe
✔️ Strong retest at demand zone → buyers defended perfectly
✔️ Price now trading above the trendline, indicating bullish structure
✔️ First target: $95,000 (psychological level + key resistance)
✔️ Second target: $100,000 (major psychological level)
If bullish pressure continues, liquidity grabs above these zones could fuel an extended move.
📊 Fundamental Insight
Institutional interest rises, especially around accumulation zones
ETF inflows remain positive, boosting overall sentiment
#BTC #Bitcoin #BTCUSDT #Crypto #CryptoTrading #BitcoinAnalysis #TradingSetup #Breakout #TrendlineBreakout #PriceAction #TechnicalAnalysis #Binance #CryptoMarket #Bullish
💬 Support the Idea
If you found this analysis useful,
👉 Please LIKE 👍 and COMMENT 💬
Your support helps me share more setups daily!
⚠️ Disclaimer
This analysis is for educational purposes only.
Not financial advice. Always manage risk (1–2% per trade) and follow your trading plan.

BTCUSD – Bullish Setup 4HPrice is pulling back into a key demand zone while holding above the lower boundary of the descending channel. Buyers are slowly stepping back in, and several bullish confluences are building:
🔹 Bullish Confluences
Price rejected the lower channel and is attempting to reclaim short-term EMAs.
Momentum shows weakening bearish pressure after a series of higher lows.
Price is retesting the mid-channel zone, which often acts as springboard in corrective structures.
The Fibonacci retracement from the recent swing displays clear upside targets lined up with channel resistance.
🎯 Fibonacci Targets
38.2% – $87,859
61.8% – $89,179
100% – $91,316
A break above the immediate EMA cluster could confirm bullish continuation toward these Fib levels. Invalidated if price closes below the recent local low.

BTCUSD Relief rally before another dropBTCUSD is currently completing 5 wave bearish structure, I'm expecting a wave 4 retracement before another wave down.
Sell Zone: $92,150 – $96,700
I expect BTC to continue climbing into this zone before distribution begins. Beware that BTC's bullish momentum is exhausted and it might not reach that high. Reaching this sell level might be a complex correction not a simple one.
Buy Zone: $72,100 – $75,990
If this analysis plays out well, and market starts showing bullish signs, I'm expecting it will be the local low for this bearish bitcoin move. Otherwise, price might continue dropping to $62,000 area.
I will update this idea later.
Good Luck!

BTCUSD- Bullish setup 1H Price tapped the 38.2% retracement and reacted with strong buying interest right at the EMA cluster + mid-band support. The bullish structure remains intact as long as price holds above the 1H demand zone and the green volatility band.
Bullish confluences:
Bounce from 38.2% Fib retracement
Price holding above dynamic EMA ribbon support
Rejection from lower band signaling buyers stepping in
Higher-low structure forming after the pullback
Clear liquidity sweep below local lows
Upside Fibonacci targets:
TP1 – 38.2%: ~87,485
TP2 – 61.8%: ~89,590
TP3 – 100%: ~90,891
As long as the 1H support zone holds, continuation to the upper Fib targets remains in play.

BTCUSD – 1H Short Setup BITSTAMP:BTCUSD has pushed into a local resistance zone near 87.8k, aligning with the upper volatility band and showing early signs of exhaustion. Price is also interacting with the 38.2% retracement level, which often acts as a reversal pivot in corrective structures.
Bearish Confluences
Overextended into upper band resistance, historically a fade zone on this timeframe.
Lower-timeframe momentum slowing, with smaller-bodied candles and wicks rejecting the highs.
Fibonacci alignment at 38.2%, matching the start of prior impulsive sell-offs.
Trend ribbon overhead still angled downward, suggesting broader trend pressure remains bearish.
A rejection from the current zone may initiate a pullback toward deeper fib targets as BTC resets from its overextended push.
🎯 Fibonacci Targets
TP1 — 38.2%: ~86,587
TP2 — 61.8%: ~85,784
TP3 — 100% extension: ~84,483
SL above 87,887

BTC/USD/ Bullish. Trend Read The captionSMC Trading point update
Technical analysis of summary of this BTC/USDT H1 chart:
---
Overall Bias: Bullish Short-Term
The chart shows a bullish continuation structure after mitigation of the Fair Value Gap (FVG) and support from EMAs.
---
Key Technical Points
Price retested and respected the FVG zone
Located around 85,300 – 86,000 area, acting as demand.
Price above EMA 50 (blue) and approaching EMA 200 (black)
→ Indicates building bullish momentum and potential trend reversal if EMA 200 breaks.
Structure
Higher lows forming
Price breaking minor structure highs
Strong bullish impulse candles
Target Zone Target highlighted near 90,000 – 90,100
---
Trade Idea Concept
Entry Idea:
Look for retracement back into the FVG/EMA zone for continuation long (mitigation + breakout strategy).
TP Target:
90,000 – 90,100 resistance and liquidity level
Invalidation / Stop:
Clean break below 85,300 demand zone would negate the bullish setup.
---
Smart Money Concept Perspective
FVG used as institutional demand
Liquidity grab below previous lows during correction phase
Targeting premium pricing near EMA 200 and liquidity pool
Mr SMC Trading point
---
Summary
BTC is showing strength and continuation potential. As long as price stays above 85,300–86,000 zone, the path of least resistance is upward toward 90,000.
---
Please support boost 🚀 this analysis

BTCUSD Rejected its Daily Support and Ready For FlyHello Traders
In This Chart BTCUSD HOURLY Forex Forecast By FOREX PLANET
today BTCUSD analysis 👆
🟢This Chart includes_ BTCUSD market update)
🟢What is The Next Opportunity on BTCUSD Market
🟢how to Enter to the Valid Entry With Assurance Profit
This CHART is For Trader's that Want to Improve Their Technical Analysis Skills and Their Trading By Understanding How To Analyze The Market Using Multiple Timeframes and Understanding The Bigger Picture on the Charts

BTCUSD – Sharp Decline Followed by Early Recovery AttemptsAfter an extended downside move, price has started to form a reactive rebound pattern, indicating that short-term buyers may be stepping in. If this developing behaviour continues, a gradual continuation of the recovery phase could unfold as momentum shifts in the sessions ahead.
Disclosure: We are part of Trade Nation's Influencer program and receive a monthly fee for using their TradingView charts in our analysis.

BITCOIN TRADE IDEA Waiting for btcusd to buy …will use a buy stop in order to catch the move to the upside as it’s been dropping for soo long and now needs to retest a fair amount to the upside

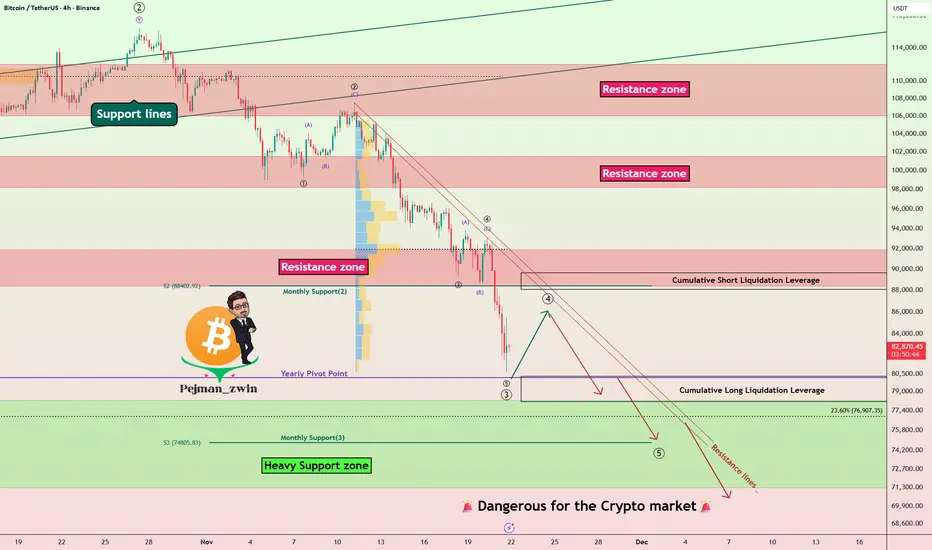
Bitcoin Hits Heavy Support Zone — Is the Next Big Crash Coming?Recently, Bitcoin ( BINANCE:BTCUSDT ) experienced another decline of over -10%, largely due to the sudden drop in the S&P 500( SP:SPX ). As I mentioned in previous ideas, in recent weeks, Bitcoin and the crypto market, especially Bitcoin, have shown a strong correlation with U.S. indices, particularly the S&P 500. This means that even technically sound analyses for Bitcoin can fail if we don’t consider these external factors, which is quite normal. Therefore, it’s crucial to incorporate all parameters—news, fundamentals, on-chain data, and relevant indices—to get an accurate Bitcoin analysis. This complexity can make things a bit challenging.
Over the past ten days, Bitcoin has swiftly broken through several support levels. Many factors have contributed to Bitcoin’s decline recently, but it’s now approaching a heavy support zone($78,300-$71,280). This zone is crucial because if Bitcoin loses it, we could see even larger declines, affecting altcoins as well. Altcoins, in general, haven’t matched Bitcoin’s gains in recent months, so a significant drop in Bitcoin could lead to severe losses for them. It’s essential to manage your investments carefully and stay alert.
From an Elliott Wave perspective, the recent decline suggests that Bitcoin might be in the midst of a five-wave downward, which isn’t positive news. There’s a chance that the heavy support zone($78,300-$71,280) might be breached. However, considering that weekends typically have lower trading volumes, it’s less likely that the support will break in the next couple of days. Still, we must remain vigilant and prepared for any scenario.
In terms of Elliott Waves, it seems Bitcoin has completed its main wave 3, and we might be looking at the completion of the wave 4 over the weekend, with another push towards the heavy support zone($78,300-$71,280) at the start of next week.
Also, the USDT.D% ( CRYPTOCAP:USDT.D ) chart looks bullish, which could not be good news for Bitcoin.
I expect that after a brief rebound, Bitcoin will resume its decline and test the heavy support zone($78,300-$71,280) again.
Cumulative Short Liquidation Leverage: $89,642-$88,079
Cumulative Long Liquidation Leverage: $80,263-$78,131
First Target: $78,523
Second Target: $75,123
Stop Loss(SL): $92,123(Worst)
Points may shift as the market evolves
Note: The S&P 500 also might face downward pressure in the coming days, which could further impact Bitcoin’s support levels. It’s essential to manage your investments carefully and wait for strong reversal signals in higher timeframes. You might miss out on some short-term gains, but it will allow for more confident entries later on.
Note: Tensions between the U.S. and Venezuela are escalating day by day. Should these tensions intensify to the point of direct confrontation, it could act as a trigger for another Bitcoin decline. It’s important to keep this in mind.
Note: Additionally, there have been some suspicious transfers involving the Mt. Gox exchange recently. It’s worth monitoring these developments closely.
💡 Please respect each other's opinions and express agreement or disagreement politely.
📌Bitcoin Analysis (BTCUSDT), 4-hour time frame.
🛑 Always set a Stop Loss(SL) for every position you open.
✅ This is just my idea; I’d love to see your thoughts too!
🔥 If you find it helpful, please BOOST this post and share it with your friends.
BTCUSD Monthly – Elliott Wave Count
Possible we will get a Wave ((IV)) triangle, if structure holds above $65,000 support.
Higher timeframe bias remains bullish.
Key zones: $122,154 (1.618 ext.), $188,111 (2.618 ext.)
Invalidation: Monthly close below $65,000
Roadmap:
Triangle consolidation likely through 2026
Breakout targets $120K-$190K
Impulse confirmation triggers next advance

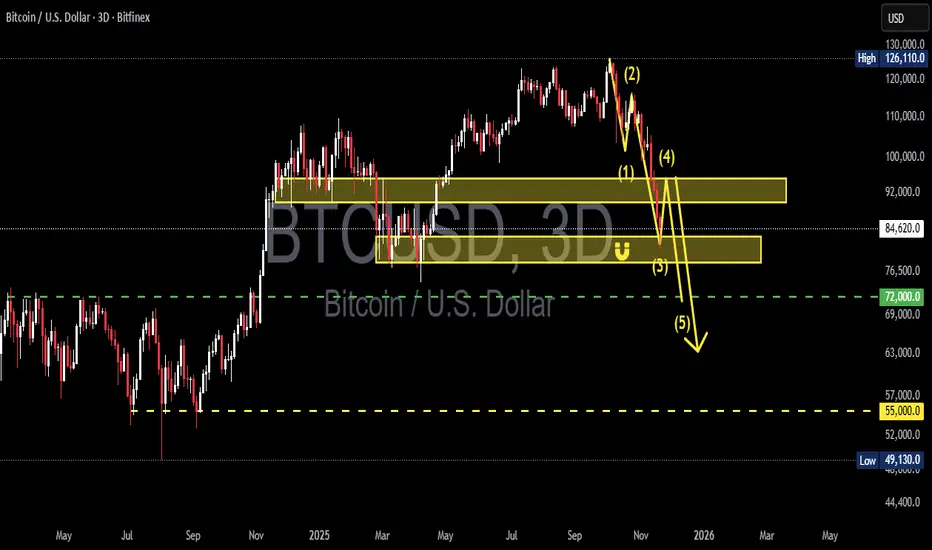
BTC/USDT — Bearish Impulse Structure Near Completion, Is Wave 5?Bitcoin is entering one of its most decisive phases since reaching its recent cycle high. On the 3-Day timeframe, the price is forming a clear 5-wave bearish impulse, and the entire structure is now converging into one critical question:
Are we standing right at the edge of the “final flush” into Wave (5)?
---
📌 The Bigger Picture
After peaking in the 120–126k region, BTC entered a distribution phase that triggered a sharp decline into Wave (1).
The rebound into Wave (2) failed to break new highs — a strong confirmation that the market lost bullish strength.
Now the price is trapped between:
Major Supply Zone (~92k) → Historical distribution block with heavy seller presence
Key Demand Zone (84.6k–78k) → Critical retest zone that acts as the last defensive wall for mid-term buyers
From here, the market narrative becomes very clear:
If BTC loses the 84–78k zone, Wave (5) becomes highly probable — targeting 72k, with an extended risk toward 55k if capitulation unfolds.
---
📉 Bearish Scenario — “The Final Flush”
This is the dominant scenario if the impulse structure continues to hold.
1. Strong rejection from the 92k Supply Zone
If BTC fails to reclaim 92k on a 3D close, Wave (4) is likely complete.
2. Breakdown below 84–78k
This signals buyer exhaustion and confirms momentum toward Wave (5).
3. Wave (5) targets:
72k → primary target
55k → extreme capitulation target (similar to 2019 or 2021 flushes)
This scenario becomes fully validated with a decisive 3D close below 84k.
Volume confirmation will be crucial.
---
📈 Bullish Scenario — “Wave Failure & Trap Reversal”
For BTC to invalidate the bearish structure, buyers must deliver a strong response:
1. A powerful bounce from the 84.6k–78k zone
Not just a wick, but a 3D bullish engulfing with strong volume.
2. A clean break + 3D close above 92k
This invalidates the bearish wave count and opens the door to 105–110k.
3. Formation of a new Higher Low above 84k
A structural confirmation that bulls regain control.
This bullish scenario is less likely —
but in crypto, “unlikely” doesn’t mean “impossible,” especially if the market is setting up a bull trap before the next major leg.
---
🎯 Key Levels to Watch
92,000 → Major Supply / Macro resistance
84,660 – 78,000 → Key Demand Zone / Buyer defense block
72,000 → Critical support & Wave (5) ideal target
55,000 → Deep support if a capitulation event unfolds
---
📊 Why This Pattern Matters
A 5-wave impulsive decline typically appears at either:
The beginning of a major correction, or
The end of a macro bullish expansion
If BTC reaches 72k:
It could become the largest accumulation zone before the next bull expansion
Or signal the completion of the previous macro cycle
Either way, the next move will shape BTC’s direction for the next 6–12 months.
---
#Bitcoin #BTCUSD #BTCAnalysis #CryptoOutlook #ElliottWave #PriceAction #CryptoMarket #BTCBearish #BTCBullish #MarketStructure #CryptoTA
Bitcoin Roadmap: Is This the Beginning of the Short-Term Rally?Today I want to share with you the Bitcoin ( BINANCE:BTCUSDT ) chart on the 15-minute time frame. This analysis is in line with the previous analysis (still valid) .
These days, considering that Bitcoin is facing many parameters to analyze. One of the most important parameters is the SPX500 index ( SP:SPX ). I am long on the SPX500 index.
Bitcoin is currently moving in the Support zone($91,900-$88,400) and near the Support lines and Cumulative Long Liquidation Leverage($91,131-$90,477) .
In terms of Elliott Wave theory, it seems that Bitcoin completed wave 5 with an Expanding Ending Diagonal , and we can now expect the start of the bullish waves , at least in the short term .
I expect Bitcoin to start rising from the Support zone($91,900-$88,400) and at least attack the Resistance lines . If the Resistance lines and the $95,700 level are broken with high momentum, we can expect further growth of Bitcoin.
First Target: $93,921
Second Target: $95,273
Third Target: $97,477
Stop Loss(SL): $89,537
Points may shift as the market evolves
Cumulative Long Liquidation Leverage: $88,570-$87,227
Cumulative Short Liquidation Leverage: $94,500-$93,785
Where do you think Bitcoin’s correction will go?
Please respect each other's ideas and express them politely if you agree or disagree.
Bitcoin Analysis (BTCUSDT), 15-minute time frame.
Be sure to follow the updated ideas.
Do not forget to put a Stop loss for your positions (For every position you want to open).
Please follow your strategy and updates; this is just my Idea, and I will gladly see your ideas in this post.
Please do not forget the ✅' like '✅ button 🙏😊 & Share it with your friends; thanks, and Trade safe.

BTC: Bottoming ConsolidationBTCUSD is staging a weak rebound from the lows and oscillating around the $90,000 mark today. Overall, it has yet to break free from the recent sharp correction trend. Meanwhile, technical indicators are showing oversold rebound signals, while pressures from the macroeconomic and capital sides are significantly restricting the upside potential.
Currently, the 90,000 level serves as a key battleground. Having acted as a crucial support level after the previous breakdown, this level has now become a critical psychological resistance during the ongoing rebound. The immediate resistance zone at 93,500 remains effective, with a further resistance level at 95,000. On the downside, the key support lies at 89,000. A break below this level will most likely trigger a new round of sell-offs, subsequently testing the support range between 80,000 and 85,000.
In the short term, BTCUSD is likely to continue its sideways consolidation to build a bottom. If it can hold firm at the 90,000 level and the macro environment eases—such as the Federal Reserve issuing dovish signals or the resumption of capital inflows into Bitcoin ETFs—the price is expected to rebound to the range of 95,000 - 100,000. However, if a black swan event like the Federal Reserve adopting a more hawkish stance occurs, the price may breach the 88,000 support level and slide further to test the 75,000 - 80,000 range.
Sell 93000 - 93500
SL 94000
TP 90000 - 89500 - 89000
Buy 89000 - 89500
SL 88000
TP 92000 - 92500 - 93000

Tightening liquidity suppresses risky assets. Negative policy factors: Fed Chair Powell clearly stated that "interest rates will remain high for a longer period", causing expectations of rate cuts to plummet; the core PCE inflation rate in the US is above the 2% target, completely dashing expectations of loose liquidity.
Cross-market correlation: The 30-day correlation between Bitcoin and the Nasdaq is 0.78. U.S. technology stocks are under pressure and falling, and high-risk assets are collectively being sold off, further spreading to the cryptocurrency market.
Bitcoin trading strategy
sell:94000-93000
tp:92000-91000-90000
sl:95000

BTCUSDT SHORT SETUP ( 20 NOV 2025 )If you have doubt on our trades you can test in demo.
BINANCE:BTCUSDT SHORT SETUP
📊 EP: 92577.29
💵 TP: 90707.79
❌ SL: 93495.25
Trade Ideas:
Idea is clearly shown on chart + we have some secret psychologies and tools behind this.
Trade Signal:
I provide trade signals here so follow my account and you can check my previous analysis. So don't miss trade opportunity so follow must.

BTC/USDT - Make-or-Break Demand Zone: Reversal or Breakdown?Bitcoin is now entering one of the most critical zones of its mid-term market structure. After a sharp decline from the 126k peak, price is sliding into the major demand block at 83,000–78,000, a region that previously acted as a springboard for the rally earlier this year.
This 3D chart clearly highlights a structural decision point:
➡️ Hold this zone → strong bullish continuation potential
➡️ Lose this zone → the market opens room for a deeper macro correction
The next few candles in this zone will shape the direction of the entire Q4–Q1 trend.
---
Why This Yellow Block Matters
The 83k–78k zone is not random. It represents:
The origin of a previous rally, where institutional buying stepped in aggressively
A macro demand cluster, confirmed by multiple touches and consolidations
A liquidity “rebalance zone”, often retested before trend continuation
A structural higher-low area in the broader bullish cycle
If BTC wants to maintain a macro uptrend, this is where buyers must show up.
---
Market Structure & Pattern Description
The chart shows a macro uptrend, followed by a deep correction from the top.
Price is now approaching the key retracement zone of the previous expansion.
This area previously formed a base pattern before the 50k → 126k breakout.
Candles entering the demand zone show seller exhaustion signals, but no confirmation yet.
A reversal pattern here (engulfing, long-wick rejection, inside bar break) would be the first bullish signal.
A clean 3D close below 78k would convert this demand zone into supply — a strongly bearish structural shift.
This is the type of zone where trends are born or destroyed.
---
Bullish Scenario (Reversal from 83k–78k)
For the bullish thesis to remain valid:
🔥 Conditions Needed
Rejection wick or bullish engulfing on the 3D timeframe
Higher low confirmation on daily
Return above key short-term resistance around 92,400
🎯 Bullish Targets
TP1: 92,000 (short-term reclaim)
TP2: 110,000 (macro mid-range)
TP3: 126,000 (previous high → breakout zone)
If buyers defend this zone, BTC maintains its macro bullish structure.
❌ Bullish Invalidation
A 3D full-body close below 78,000
Followed by failed attempts to reclaim the zone
---
Bearish Scenario (Breakdown of 78k)
If price fails to hold the demand block:
🔥 Breakdown Confirmation
Strong 3D candle close under 78k
Retest of 78k–83k as resistance
Increasing selling volume
🎯 Bearish Targets
Target 1: 72,000 (major liquidity zone)
Target 2: 62,000 range
Target 3: 49,000 (macro support from prior cycle)
A breakdown here would confirm a macro correction, not just a pullback.
❌ Bearish Invalidation
Price quickly reclaims 80k–83k with momentum
Failed retest turns into a deviation
---
Trading Notes
This is a macro (3D) zone — be patient.
Let confirmation develop, avoid knife-catching.
Use wide stops; 3D signals require larger breathing room.
Watch volume:
Increasing volume near the bottom = accumulation
Increasing volume on breakdown = distribution
#Bitcoin #BTCUSD #BTC #CryptoMarket
#PriceAction #DemandZone #CryptoTA #BullishScenario #BearishScenario #MarketStructure #CryptoOutlook #MacroAnalysis

Avoid chasing long positionsBTC has broken below the key level of 90000 today, with the downtrend becoming clear.
If the support around 87500 is broken, it may continue to decline
Accurate signals updated daily. They serve as a reliable guide for trading issues – feel free to refer to them. Hope they help!

Weak Recovery for BTCUSDBTC showed a trend of weak oscillatory recovery after hitting a low today. The price found support after breaking below the critical level of 90,000; however, the market remained in an extreme state of panic, which restricted the overall strength of the rebound.
From a technical perspective, the 85,000 - 90,000 range serves as a strong support zone, corresponding to the Fibonacci 0.618 retracement level. The price has demonstrated support near 89,000 today. On the flip side, the key resistance is concentrated in the 93,500 - 94,200 range. A breakout above this range may lead the price to test 95,000 subsequently, and if it can breach 95,000, it is expected to further move towards and challenge the 96,000 - 96,700 range.
Sell 93,500 - 94,000
SL 94,500
TP 92,000 - 91,500 - 91,000
Buy 89,500 - 90,000
SL 88,500
TP 92,500 - 93,000 - 93,500

BitcoinBTCUSD
- Fair Value Gap
- Change of Characteristics
- Order Block
- Rising Wedge as an corrective pattern in Long Time Frame
- Demand Zone

BITCOIN BIG HIGH BUY PROBABILITY SETUP SOON!!!🚨 BITCOIN HIGH PROBABILITY BUY SETUP 🚨
* Here We Can See Clearly The Next Potential Moves For BTCUSD Coming Hours/Days.
* Keep Your Eyes Close On Your Trading Positions.
* Happy PIP Hunting Traders.
FXKILLA.
