BTCUSDT — Decision Zone: Continuation or Major Correction Ahead?Bitcoin’s 2-Day chart (Bitstamp) is now approaching a critical macro zone — the $106,000–$101,000 support block, which acts as the last stronghold for bulls in this current uptrend.
This area represents a confluence of horizontal support and the main ascending trendline that has guided price since late 2024.
If buyers can defend this zone, Bitcoin could still experience one final leg up toward the cycle top.
However, a decisive breakdown below it would confirm the start of a major structural correction.
---
Structure and Pattern
Primary Pattern: Rising Wedge / Ascending Channel
The pattern indicates weakening bullish momentum — each higher high forms with less strength.
Such formations often end with a sharp breakdown once the support line fails.
Key Levels:
Support zone (yellow block): $106K – $101K
→ Confluence of trendline and horizontal support.
Immediate resistance: $116,500
Upper liquidity zone / cycle top target: $126K – $128.5K
---
Bullish Scenario — “The Final Push”
If Bitcoin successfully rebounds from the $106K–$101K zone, it could trigger the last upward wave toward $126K–$128.5K, potentially marking the final phase of this bull cycle.
Bullish Confirmation:
2D candle closes above $110K–$112K
Formation of a reversal pattern (hammer/pin bar) with increasing volume
Momentum indicators (RSI/MACD) start to turn upward
Upside Targets:
Target 1 → $116,500
Target 2 → $126K – $128.5K
Macro Narrative:
A bounce from this zone would likely lead to the final euphoric rally before distribution begins.
---
Bearish Scenario — “Breakdown of the Cycle”
If Bitcoin closes a 2D candle below $101K, the bullish structure will officially break down, confirming the start of a major correction phase.
This would validate the rising wedge pattern and shift momentum entirely to the bears.
Bearish Confirmation:
2D close below $101K
Failed retest around $104K–$106K
Rising selling volume
Downside Targets:
Target 1 → $92,500
Target 2 → $75,500
Macro Narrative:
A breakdown below $101K would mark the end of the bull market and the beginning of the re-accumulation phase below $90K.
---
Conclusion
Bitcoin is standing at its macro decision zone: $106K–$101K.
This range will determine whether we get one final bullish push — or the start of a major correction.
Holding above → potential rally toward $126K–$128K
Losing support → possible drop toward $92K–$75K
The next 2D candle will decide the macro direction of Bitcoin — continuation or collapse.
---
#Bitcoin #BTCUSD #BTCAnalysis #CryptoMarket #TechnicalAnalysis #PriceAction #SupportAndResistance #RisingWedge #BTCUpdate #BitcoinOutlook #CryptoTrend #MarketStructure #BitcoinChart #BTCOutlook
BTCUSDTPERP

Pay attention to the Payment Innovation ConferenceOn October 21, the Federal Reserve will hold a payment innovation conference that could rewrite the industry landscape, inviting top cryptocurrency companies such as Chainlink, Circle, and Coinbase to its Washington headquarters. This conference precisely targets the core players in the entire chain of stablecoins, infrastructure, and trading terminals. However, it is worth noting that if the meeting only discusses the direction without details, the BTC market may pull back in the short term.
Looking at technical indicators, the short-term MACD has broken through the signal line, reflecting a bullish change, but the divergence signal of the RSI may foreshadow a short-term pullback. Based on the above information, BTC is likely to experience a short-term correction followed by an upward trend. Focus on the lower levels of 109,700-109,300 in the short term, with key support at 107,500-106,500. Above this level, focus on the short-term resistance levels of 111,000-112,000. A break above this resistance level could lead to a move towards 114,000-115,000.
BITSTAMP:BTCUSD

#BTC reaches the divergence zone📊#BTC reaches the divergence zone✔️
🧠From a structural perspective, we rebounded from the overlapping support zone at 103588 and continued the bullish trend, gaining over $8,000. We've now reached a critical level where bulls and bears are battling. Since we've already seen strong returns and a pullback is possible, we've closed our long position.
➡️If the price can pull back to and stabilize near the rising trend support line today, we might consider looking for some long positions. There's a desirable red target zone to reach above.
➡️If there's no pullback and we directly attack the bearish defense, we can use a small position to look for some shorts.
⚠️Note: Both ups and downs in the divergence zone are normal. Only after breaking out of this zone can we find suitable trading opportunities. Don't forget risk management!
🤜If you like my analysis, please like 💖 and share 💬
BITGET:BTCUSDT.P

#BTC reaches support zone, cautious rebound📊#BTC reaches support zone, cautious rebound📈
🧠From a structural perspective, the ideal target area for the bearish cup-and-handle pattern has been achieved, so we should be wary of the risk of a rebound.
➡️After hitting the overlapping support at 103,588, the price rebounded by over $3,000, indicating that the winning rate has been reached. Next, we need to see if the price can stabilize here before continuing to rise. ☕️
⚠️Note that even if we break below the low L, there is a rising channel below to provide support, so don't chase the short here.
🤜If you like my analysis, please like 💖 and share 💬
BITGET:BTCUSDT.P

#BTC Update:- Are we going lower? Or Higher? Don't miss this!Before jumping into the chart, I’ve got a few words for everyone.
The recent crash has been absolutely brutal. It’s shaken the entire market and, sadly, affected so many lives; some people lost everything, and some couldn’t handle the pain. My heart truly goes out to everyone who suffered. 💔
But remember, the past is behind us. What really matters now is what we do today and how we build our tomorrow.
No one was spared from this storm. It felt like a broad daylight robbery, and if you got hit too — please, stay strong. Don’t give up. Sometimes the market resets itself in the harshest ways to prepare us for the next big move.
Take SUI for example, a solid project that would normally take 6–9 months in a bear market to drop 85%, yet it did that in one single daily candle!
From $3.71 to $0.5597, that’s an 84.9% dump in just one day.
And the worst part? Most people couldn’t even catch those prices because exchanges went crazy.
👉 Moral of the story: It’s not over. Far from it. This might just be the reset we needed before the next leg up.
### Now, about the Bitcoin chart:
BTC crashed hard, but guess what? It bounced right off the support.
That’s a strong sign.
The blue EMA you see on the chart is the 200 DEMA, another bullish signal that tells us there’s still strength in the market.
Keeping it short and simple, we’re likely heading higher from here.
Invalidation: A daily break and close below $103K.
---
I’ll be sharing more altcoin charts soon, so stay tuned.
And to everyone reading this, stay strong, stay grounded, and remember… WAGMI 🙌
We’ve been through worse, and we’ll come out of this even stronger.
If this message resonated with you, don’t forget to hit that ❤️. Let’s keep spreading positivity in this space.

Bitcoin Price Outlook: Testing the $97,800 Support ZoneHi there!
Let's analyze Btc!
Bitcoin is currently moving inside a clear descending channel, showing consistent lower highs and lower lows. The price is likely to continue its downward movement until it reaches the daily support area around $97,800.
This zone appears to be a promising area for long-term opportunities. Still, traders should wait for strong confirmation signals before entering, as a reversal will only be valid once momentum shifts from bearish to bullish.

#BTC #BTCUSD #BTCUSDT #BITCOIN #Update #Analysis #Eddy#BTC #BTCUSD #BTCUSDT #BITCOIN #Update #Analysis #Eddy
Warning: Bitcoin and the cryptocurrency market are poised for the next wave of decline. I envision 2 scenarios for Bitcoin, both of which aim to see Bitcoin fall below $90,000. The first scenario, which is a daily block breaker, is more likely. The second scenario will only be activated when Bitcoin consolidates above $109,000, aiming to fill the FVG. Eventually, the second scenario will be activated, and the main decline will begin from the upper supply range that I have identified for you.
I have identified the important supply and demand zones of the higher timeframe for you.
As you can see in the chart, the trend change from bullish to bearish has been confirmed in the decline we had.
This analysis is based on a combination of different styles, including the volume style with the ict style.
Based on your strategy and style, get the necessary confirmations for this analysis to enter the trade.
Don't forget about risk and capital management.
The responsibility for the transaction is yours and I have no responsibility for your failure to comply with your risk and capital management.
💬 Note: This is just a possibility And this analysis, like many other analyses, may be violated. Given the specific circumstances of Bitcoin, it is not possible to say with certainty that this will happen, and this is just a view based on the ICT style and strategy with other analytical styles, including the liquidity style.
Be successful and profitable.
Review the result of my previous analysis on bitcoin :

ElDoradoFx PREMIUM – BTCUSD ANALYSIS (18/10/2025)Prepared by: ElDoradoFx Premium 2.0 Analyst Team
⸻
🧭 Market Overview
Bitcoin is trading around 107,000, attempting to stabilize after a sharp drop from 115,800 earlier in the week.
The daily structure has shifted bearish, following consecutive rejections from the descending trendline and a clean break below the 200 EMA.
However, price is now sitting near a major weekly demand zone (106,300–106,000), aligned with the 1D Golden Zone retracement.
This weekend, the market is expected to consolidate before deciding whether to extend the bearish trend or attempt a technical rebound.
⸻
📊 Technical Breakdown
1️⃣ Daily Chart (D1)
• Structure: Short-term bearish — lower highs and lower lows formed after 115,800 rejection.
• MACD: Strong red histogram; momentum favors sellers.
• RSI: 36.5 → Oversold area, early signs of exhaustion.
• 200 EMA: Recently broken at 107,900 → now acting as dynamic resistance.
• Key Support: 106,300–106,000 (last swing + Golden Zone).
Bias: Bearish to neutral; possible retracement toward 108k before continuation lower.
⸻
2️⃣ 1-Hour Chart (H1)
• Structure: Price is consolidating below descending trendline from 110,000.
• EMA50 < EMA200 → bearish alignment, but short-term rebound visible.
• MACD: Positive momentum beginning to build after strong histogram recovery.
• RSI: 50.1, showing neutral mid-range — space for a minor bullish correction.
Bias: Intraday corrective bullish move likely toward 107,800–108,000 resistance.
⸻
3️⃣ 15M–5M Chart (Intraday Momentum)
• Structure: Higher lows forming from 106,400 → 106,900 → 107,000.
• RSI rising above 55; MACD histogram bullish → short-term recovery pattern.
• Resistance: 107,450–107,800 (FVG + trendline intersection).
• Support: 106,500–106,300 (EQL + demand zone).
Bias: Short-term buy pressure into resistance, watch for rejection near 108k.
⸻
📐 Fibonacci Analysis
Last Swing: 115,800 → 106,300
• 38.2% → 109,820
• 50.0% → 111,050
• 61.8% → 112,280
📊 Golden Zone: 111,050–112,280
→ Expect major sell reaction if price retraces into this area next week.
⸻
🎯 High-Probability Trade Scenarios
✅ BUY SCENARIO (Short-Term Correction)
• Break & Retest: Above 107,450 confirms short-term bullish continuation.
• Retest Zone: 107,300–107,450
• Targets:
TP1 → 107,800
TP2 → 108,500
TP3 → 109,200
• Stop-Loss: Below 106,700
⚠️ SELL SCENARIO (Main Bias)
• Break & Retest: Below 106,300 confirms continuation to the downside.
• Retest Zone: 106,300–106,500
• Targets:
TP1 → 105,800
TP2 → 104,600
TP3 → 103,200
• Stop-Loss: Above 107,000
🚀 SWING SELL (High Probability)
• Ideal Entry: 111,000–112,200 (Fibonacci Golden Zone)
• Targets: 108,000 → 106,000 → 103,500
• Stop-Loss: Above 113,000
⸻
🕐 Fundamental Watch
• Weekend = low volume, potential for range-bound moves.
• Next week: Focus on U.S. CPI follow-through & Fed speakers, which may add volatility.
• CME futures gap remains open near 108,800, likely to be filled early next week.
⸻
⚙️ Key Technical Levels
Type Levels
Resistance 107,450 / 108,000 / 109,800 / 111,000
Support 106,500 / 106,300 / 105,800 / 103,200
Trendline Resistance 107,800 (H1 descending structure)
⸻
🧾 Analyst Summary
BTCUSD is in a corrective phase, showing short-term rebound signs from the 106k support zone, yet still locked under heavy resistance at 107.8k–108k.
A break below 106.3k resumes the bearish trend, targeting 104–103k, while a bounce above 107.4k may trigger a limited retracement to 108.8k–111k before sellers re-enter near the Golden Zone.
Overall market remains bearish but approaching exhaustion levels — watch for short-term buy opportunities within 106.3k–107k range before the next leg down.
⸻
📈 Primary Bias: Bearish below 107,800 – next downside targets 106,000 → 103,200
📉 Alternative Bias: Bullish retracement above 107,450 → 108,800 → 111,000
— ElDoradoFx PREMIUM 2.0 Team 🚀
⸻
🥇 ElDoradoFx PREMIUM 2.0 – PERFORMANCE 17/10/2025 🥇
📊 GOLD TRADE RESULTS:
🔻 SELL +20 pips
🟢 BUY +20 pips
🟢 BUY +210 pips
🟢 BUY LIMIT +20 pips
🔻 SELL LIMIT +110 pips
🟢 BUY +50 pips
❌ BUY –30 pips (SL)
🟢 BUY +200 pips
🟢 BUY +100 pips
🟢 BUY +400 pips
---
💰 TOTAL GOLD PIPS WON: +1,100 pips
📈 RESULT: 10 Signals → 9 Wins | 1 SL
🎯 ACCURACY: 90 %
---
⚡️ SWING SETUPS RUNNING:
🟢 BUY from 4,081 → +2,970 pips
🟢 BUY from 4,181 → +1,970 pips
💎 TOTAL SWING GAIN SO FAR: +4,940 pips
---
🔥 Precision. Patience. Profits.
Ending the week with momentum and clean executions 📈💪
👏 Congratulations if you profited! ✅✅✅🚀🚀🚀

#BTC may retest support 📊#BTC may retest support ⚠️
🧠From a structural perspective, the highs are gradually declining. If the current decline continues, we may continue to test the lower support level of 109,000. We are currently at weak support around 112,000. If it stabilizes from here and breaks through 113,500, we can remain optimistic.
➡️107,500 is a relatively important support level on the daily chart. As long as the closing price is above 107,500, we can still maintain an optimistic bullish outlook.
➡️Extreme support is around 103,400 (which is unlikely to be reached in the near future).
🤜If you like my analysis, please like 💖 and share 💬 BITGET:BTCUSDT.P

Bitcoin at Heavy Supports – Time to Go Long?As I expected in my previous idea , Bitcoin ( BINANCE:BTCUSDT ) completed both its bullish and bearish moves and hit its Long and Short targets .
Bitcoin can still see some upside as long as it holds this Heavy Support zone($111,980-$105,820) . However, given the recent momentum and the wick down to around $102K a few days ago, any further rally depends on breaking the Resistance zone($118,750-$115,730) and touching around $117,220 , which is the high of that significant bearish candle .
Currently, Bitcoin is sitting in a Heavy Support zone($111,980-$105,820) near the 200_SMA(Daily) and a Cumulative Long Liquidation($108,415-$107,156) . It's basically hovering between key weekly support lines, so this is a pretty strong supports .
In terms of Elliott Wave theory , it looks like Bitcoin is still completing its wave 4 . This wave 4 might have formed a Double Three Correction(WXY) , and now we can expect a potential upward move .
I expect that in the next few hours, Bitcoin may start a short-term bullish move up to around $115,000 or to the Cumulative Short Liquidation Leverage($114,973-$113,435) .
Note: Overall, it's better to look for Long positions right now, considering Bitcoin's position. But if it breaks the 200_SMA(Daily) and the Heavy Support zone($111,980-$105,820), we could see a broader crypto market drop.
Note: Around the $108,000 level, we have huge buy orders stacked up, which might act as a significant support zone.
Please respect each other's ideas and express them politely if you agree or disagree.
Bitcoin Analysis (BTCUSDT), 4-hour time frame.
Be sure to follow the updated ideas.
Do not forget to put a Stop loss for your positions (For every position you want to open).
Please follow your strategy and updates; this is just my Idea, and I will gladly see your ideas in this post.
Please do not forget the ✅' like '✅ button 🙏😊 & Share it with your friends; thanks, and Trade safe.

BTC/USDT: Bullish Bounce to 115,400?BINANCE:BTCUSDT is showing signs of a bullish bounce on the 1-hour chart , where price is approaching a downward trendline with potential support confluence, suggesting a reversal opportunity if buyers defend the key levels. The entry zone aligns near this support area , setting up for an upside move toward higher resistances amid recent volatility.
Entry between 109,500-110,200 for a buy position. Target at 115,400 near the take profit zone, offering a risk-reward ratio greater than 1:4 . Set a stop loss on a close below 109,000 to manage downside risk effectively.
Watch for confirmation with a strong bullish candle and rising volume breaking above the entry, capitalizing on Bitcoin's resilience in the crypto market.
Fundamentally, today we have several speeches from Federal Reserve members, along with the Philadelphia Fed Manufacturing Index and Philly Fed Employment report, which could spark volatility in USD pairs and indirectly impact BTC sentiment. 💡
📝 Trade Plan:
✅ Entry Zone: 109,500 – 110,200 (buy zone near support confluence)
❌ Stop Loss: Close below 109,000
🎯 Target: 115,400 (major resistance zone / take-profit area)
💎 Risk-to-Reward: Greater than 1:4, offering an attractive trade setup.
What's your view on this setup? Drop your thoughts below! 👇

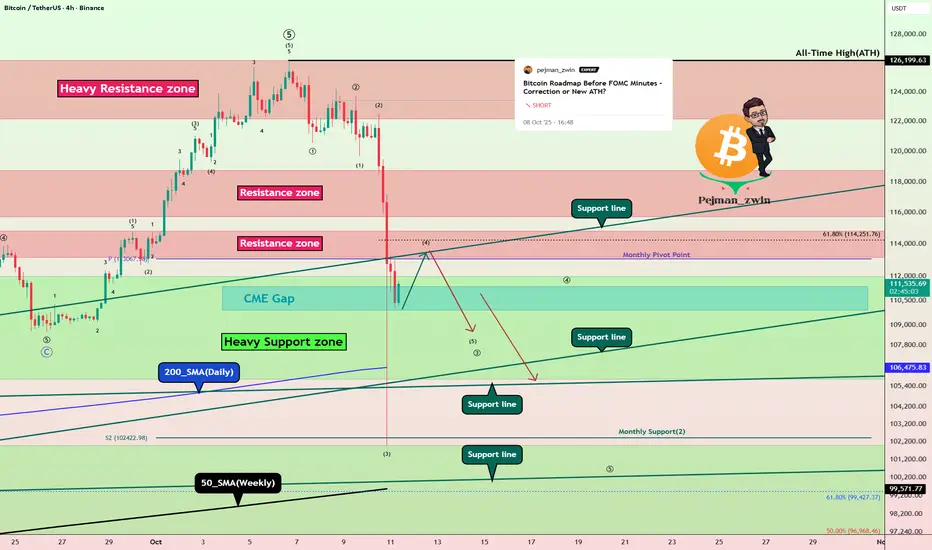
Bitcoin Roadmap: Is a Major Correction the Next Stop?As I expected from the previous analysis , Bitcoin did start to drop and hit its targets .
Now, with the news that the U.S. might impose a 100% tariff on China , we saw Bitcoin sharply sell off last night. Actually, as I mentioned in my previous ideas , the rally from about $109,000 to around $126,199(ATH ) (which was a new all-time high for Bitcoin) had relatively low volume. That was a sign that a correction might be on the way, and last night’s news just acted as a trigger to speed it up.
In fact, what took Bitcoin 10 days to climb was reversed in about 4 days , showing how strong the sellers are right now.
Educational tip: You can use volume candles on TradingView to see which candles had higher volume—the thicker the candle, the more significant the move.
Now, the big question: will Bitcoin keep dropping or bounce back?
Right now, it’s sitting near a cluster of Support lines and close to the daily 200_SMA(Daily) and the 50_SMA(Weekly) , as well as a Heavy Support zone($111,980-$105,820) . Last night’s drop was basically the first test of these supports .
Since it’s the weekend and volumes are usually lower, we don’t expect a huge downward move in the next 48 hours.
Bitcoin might do a pullback to the broken Resistance zone($114,820-$113,180) and then continue its drop.
According to Elliott Wave analysis , Bitcoin seems to be completing a microwave 4 of the main wave 3 .
I expect that after Bitcoin completes , we might see it continue downward and fill the CME Gap($111,355-$109,915) early in the next week.
So, do you think the major correction for Bitcoin has started or not? Let me know what you think!
Note: In case the Support lines break, there’s also a chance that we might see a Death Cross (where the 50-day moving average crosses below the 200-day moving average), which could signal further bearish momentum.
Note: Around the $108,000 level, we have huge buy orders stacked up, which might act as a significant support zone.
Please respect each other's ideas and express them politely if you agree or disagree.
Bitcoin Analysis (BTCUSDT), 4-hour time frame.
Be sure to follow the updated ideas.
Do not forget to put a Stop loss for your positions (For every position you want to open).
Please follow your strategy and updates; this is just my Idea, and I will gladly see your ideas in this post.
Please do not forget the ✅' like '✅ button 🙏😊 & Share it with your friends; thanks, and Trade safe.
Bitcoin Eyeing $108K ZoneCRYPTOCAP:BTC Daily Chart Analysis
Bitcoin is currently trading around $110,300, showing weakness after failing to hold higher levels. The market structure still looks corrective, and we can see price slowly drifting toward the nearest support zone around $108,000–$109,000.
If this zone holds, we might see a short-term bounce or relief rally. But if the market breaks below $108,000, the next major demand area lies near $104,000–$100,000, where buyers are likely waiting.
For now, the key is to watch how price reacts at this support. A strong bounce could confirm accumulation, while a breakdown might trigger deeper correction before any new bullish leg.
DYOR, NFA

Bitcoin - It is either $50.000 or $1.000.000!🪅Bitcoin ( CRYPTO:BTCUSD ) remains undecided:
🔎Analysis summary:
For the past couple of months, Bitcoin has been consolidating. With the two recent all time highs, we could see a similar pattern to what we saw back in 2021, followed by a bear market. But so far, Bitcoin remains bullish with the underlying trend continuation.
📝Levels to watch:
$1.000.000, $50.000
SwingTraderPhil
SwingTrading.Simplified. | Investing.Simplified. | #LONGTERMVISION

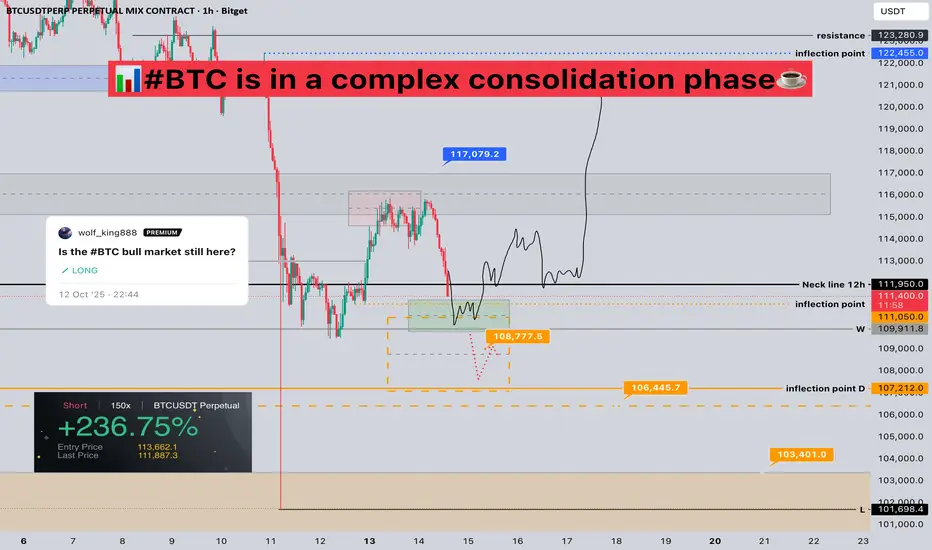
#BTC is in a complex consolidation phase📊#BTC is in a complex consolidation phase☕️
🧠From a structural perspective, we've encountered resistance at the gray resistance band and are now forming a double-top bearish structure. The aggressive support zone is 110,000-111,000, while the extreme support zone is 106,000-108,000.
➡️We've attempted some short trades at the overlapping resistance zone. The market is currently developing as expected. We're currently in a sideways consolidation phase, so we should prioritize range-bound trading!
➡️After most high-leverage positions are liquidated, spot trading opportunities will emerge. Based on previous similar events, it's only a matter of time before we continue to reach new highs. Therefore, the trading range worth participating in is 100,358-107,258, with the target being the ATH.
🤜If you like my analysis, please like 💖 and share 💬
BITGET:BTCUSDT.P
Where is #BTC support?📊Where is #BTC support?
🧠The market has seen a dramatic scene! The price has recovered, but most people have lost their money! This just goes to show the importance of risk management! I'm glad my expectations have aligned with market developments. Going forward, we'll continue to be bullish and focus on long positions. Long-term short positions should be sought above 132k.
➡️Based on the current structure, aggressive support is around 112,700, and extreme support is around 108,000.
🤜If you like my analysis, please like 💖 and share 💬
BITGET:BTCUSDT.P

This year's target: Around 133889.92
Hello, traders!
Follow me to get the latest information quickly.
Have a great day.
-------------------------------------
(BTCUSDT 1W chart)
The price has been rising above the HA-High indicator, forming a step-up trend.
You can see that the upward movement of the step-up trend is slowing down.
The key question is whether the price can rise above the right Fibonacci level 2.618 (133889.92), which is considered this year's target.
If it shows further upward movement, it could rise to around the right Fibonacci level 3 (151018.77).
Even so, it must ultimately break above the HA-High ~ DOM (60) range on the 1W chart. Therefore, we need to see if the price can rise above the 116259.91-119086.64 range and maintain its upward momentum.
If it fails to rise, it will eventually touch the M-Signal indicator on the 1M chart again.
From a long-term perspective, the price must remain above the 69000-73499.86 level to maintain the uptrend.
Therefore, we must first confirm support near the first, second, and third levels.
-
(1D chart)
The 116259.91-119086.64 range is the resistance zone on the 1W chart.
If the price rises above this range, the 120760.81-124658.54 range, which is the resistance zone on the 1D chart, awaits.
Therefore, the 116529.91-124658.54 range should ultimately be considered the resistance zone.
To determine whether this range is important, you should examine the movements of auxiliary indicators such as StochRSI, On-By-Signal (OBV), and TC (Trend Check).
To break above this important range and continue the uptrend,
1. The StochRSI indicator must be trending upward. Ideally, it should not be in the overbought zone.
2. The On-By-Signal (OBV) indicator must be trending upward. If possible, it should remain above the High Line.
3. The TC (Trend Check) indicator should show an upward trend. If possible, it should remain above the 0 level.
It's important to meet the above conditions when breaking above the resistance zone of 116529.91-124658.54.
If not, there's a high chance of failing to break above the resistance zone.
-----------------------------------------------------
The HA-Low and HA-High indicators included in this chart are designed for trading on Heikin-Ashi charts.
Therefore, a basic trading strategy can be utilized: buy near the DOM (-60) ~ HA-Low range and sell near the HA-High ~ DOM (60) range.
However, if the price rises from the HA-High to DOM(60) range, it is likely to exhibit a step-like upward trend. If the price falls from the DOM(-60) to HA-Low range, it is likely to exhibit a step-like downward trend.
Therefore, the basic trading strategy should be a segmented trading approach.
We can see that the HA-High to DOM(60) range, i.e., the resistance zone, is likely to form, and then a pullback is likely to occur as it attempts to break above it.
Auxiliary indicators (StochRSI, OBV, TC) indicate the strength needed to rise again from a pullback, or a downward trend.
Although the 110644.40 level still serves as weak support, the DOM(-60) level has been identified.
For the 110644.40 level to function as support, it must hold for at least three days.
Therefore, during this period of volatility, we need to monitor whether the DOM (-60) indicator holds at 110644.40 after October 14th (October 13th-15th).
This is because if the price fails to break above the resistance zone of 116259.91-124658.54, the 110644.40 level could serve as support.
-
I believe the bull market is likely to continue until this year.
If it rises further, the upward trend could continue through the first quarter of 2026.
However, a major bear market is expected in 2026.
Therefore, we need to finish the year on a good note.
-
Thank you for reading.
I wish you successful trading.
--------------------------------------------------
- This is an explanation of the big picture.
(3-year bull market, 1-year bear market pattern)
I will explain in more detail when the bear market begins.
------------------------------------------------------

Is the #BTC bull market still here?📊Is the #BTC bull market still here?💬
🧠From a structural perspective, the weekly and monthly charts remain bullish, the bullish trend remains intact, and the bullish target range (132k-175k) is still within reach, so don't be too pessimistic.
➡️This type of high-leverage liquidation event isn't the first time. Similar structures occurred on December 5th, 2024, and January 3rd, 2024. If you look back at the market, you'll see that we always hit new highs after liquidating most of the high leverage.
➡️Interestingly, history is similar; the only difference is the price and volatility!
⚠️Note: We shouldn't blindly pursue similar events. We should always maintain a respectful attitude and strictly manage risks. Survival is more important than anything else!
🤜If you like my analysis, please like 💖 and share 💬
BITGET:BTCUSDT.P

Bitcoin Another Bounce Coming?Bitcoin is currently retesting its 50-week Simple Moving Average (SMA) — a historically significant support zone that has acted as a launchpad for multiple bullish continuations throughout previous markets.
Each time BTC has interacted with this moving average since mid-2023, it has managed to rebound strongly, confirming it as a key dynamic support level during this bull phase.
🔶If BTC holds above the 50-week SMA, it may indicate another healthy correction within an ongoing uptrend, potentially setting the stage for the next leg higher.
🔶A clean weekly close below the 50 SMA could suggest a trend weakening and open the door for deeper retracements toward the $90K–$95K region.
Cheers
Hexa

BTCUSD approaching another buy zone?BTCUSD With 7 months of continued series of higher low, price about to break series of higher low which could bring a new buy opportunity at around @$107,456 with break of support in this long term up trend it is highly likely to create a new bullish impulse to coninue it's long term uptrend.
This break from $126305 to current price is a sinngle one move that could lead the price to reverse back to $126,305

BTC Technicals Point to Strong Bullish Setup at $112K SupportLooking at this weekly CRYPTOCAP:BTC chart, you can see Bitcoin has been consistently holding above the 50 EMA, acting as solid support each time it retraces back to it. The key point to note here is how the price has tested this zone multiple times, forming a strong area of confluence. Each time, Bitcoin has successfully bounced, showing a solid structure to keep the uptrend intact.
At this moment, Bitcoin is facing resistance around $126,000, but the market looks strong, especially with the EMA holding as support. If the price breaks this resistance, we could be in for another leg up towards higher targets. The price action here indicates that bulls are in control, and the current setup suggests there's a good chance we might see more upside soon, especially if the zone around $112,000 holds as support.
Keep an eye on the key levels: if BTC holds above the 50 EMA and the confluence zone, the next push could be significant.
DYOR, NFA
#PEACE

Bitcoin Ready to Fly! Harmonic ABCD Pattern
Bitcoin is currently active in the trading market, forming a harmonic ABCD pattern.
Price has retraced around 30% to a key Fibonacci level.
This zone may act as a potential reversal area if buyers hold the level.
RSI shows bullish divergence, indicating weakening bearish momentum.
Risk–Reward Ratio (RRR): 1:2
#BTC #BTCUSD #BTCUSDT #BITCOIN #Analysis #Eddy#BTC #BTCUSD #BTCUSDT #BITCOIN #Analysis #Eddy
I have identified the important supply and demand zones of the higher timeframe for you.
This analysis is based on a combination of different styles, including the volume style with the ict style.
Based on your strategy and style, get the necessary confirmations for this analysis to enter the trade.
Don't forget about risk and capital management.
The responsibility for the transaction is yours and I have no responsibility for your failure to comply with your risk and capital management.
💬 Note: This is just a possibility And this analysis, like many other analyses, may be violated. Given the specific circumstances of Bitcoin, it is not possible to say with certainty that this will happen, and this is just a view based on the ICT style and strategy with other analytical styles, including the liquidity style. (( The fall of Bitcoin may not change the trend of altcoins and money will move out of Bitcoin and into altcoins, and we will see altcoins grow. ))
Be successful and profitable.
