#BTC 4H Bearish Structure, Cautiously Bullish 📊 #BTC 4H Bearish Structure, Cautiously Bullish ⚠️
🧠From a structural perspective, we've broken below the yellow support zone, which has transformed into the blue resistance zone. This also indicates a bearish structure has emerged on the 4H chart, so caution with bullish sentiment! If price can rebound into the blue resistance zone, we could look for short opportunities.
➡️Interim support is around 118,000, with extreme support around 114,888 (if it reaches this level today, we could try to take some long positions).
🤜If you like my analysis, please like 💖 and share 💬
BITGET:BTCUSDT.P
BTCUSDTPERP

The key is whether the upward trajectory can continue
Hello, fellow traders.
If you "Follow," you'll always get the latest information quickly.
Have a great day.
-------------------------------------
(BTCUSDT 1D chart)
The price rose after forming a DOM(-60) ~ HA-Low range, and is now forming a HA-High ~ DOM(60) range, showing a upward trajectory.
Trend-wise, a decline below the M-Signal indicator on the 1W chart is likely to initiate a downtrend, and a decline below the M-Signal indicator on the 1M chart is expected to initiate a downtrend.
Therefore, when the price falls to the HA-High ~ DOM (60) range, it's important to identify support and resistance levels formed at the M-Signal indicator on the 1W chart.
-
Therefore, it's important to maintain the price above the 116259.91-119086.64 range.
The next important range is the 104463.99-108353.0 range.
-
To break above these key levels or ranges,
- The StochRSI indicator must be trending upward. If possible, it's best to avoid entering the overbought zone.
- The On-By-Signal (OBV) indicator must be trending upward. If possible, it should remain above the High Line.
- The TC (Trend Check) indicator should show an upward trend. If possible, it should remain above the 0 level.
If the above conditions are met, an upward breakout of the HA-High ~ DOM (60) range is expected.
The next period of volatility is expected around October 14th (October 13th-15th).
-
Thank you for reading to the end.
I wish you successful trading.
--------------------------------------------------
- This is an explanation of the big picture.
(3-year bull market, 1-year bear market pattern)
I will explain in more detail when the bear market begins.
------------------------------------------------------
BTC/USDT Update
📊 BTC/USDT Update
⚔️ This level is the battle line between Bulls 🐂 and Bears 🐻.
✅ Bullish as long as price holds above support.
❌ If this support breaks, expect BTC to dive below $90K 📉.
🔎 Stay alert — this zone will decide the next big move 🚀.

Bitcoin Roadmap Before FOMC Minutes – Correction or New ATH?Today, we have one of the most important macro events — the FOMC Meeting Minutes
Let’s quickly understand what it is and why it could shake the crypto market
What are FOMC Minutes?
They’re the detailed notes from the last Federal Reserve meeting, showing what members discussed about interest rates, inflation, and the economy.
Markets carefully read every line to find hints about future rate cuts or continued tightening.
Why does it matter for Bitcoin?
When the Fed turns dovish (hinting at lower rates), risk assets like Bitcoin usually rally But when the tone is hawkish (worried about inflation), investors move to cash or bonds, causing crypto to dip.
Let’s take a look at Bitcoin ( BINANCE:BTCUSDT ) on the 4-hour timeframe .
Before analyzing the chart, let’s quickly review what defines a strong uptrend :
1-Higher Lows(HL):
Each new low should form above the previous one, showing that buyers are stepping in earlier each time.
2-Higher Highs(HH):
Each new high should be higher than the last, confirming that bullish momentum is still in control.
3-Structure Respect:
The new low should not break below the previous high — if it does, it doesn’t necessarily mean the trend is over, but it indicates a weakening of the bullish structure.
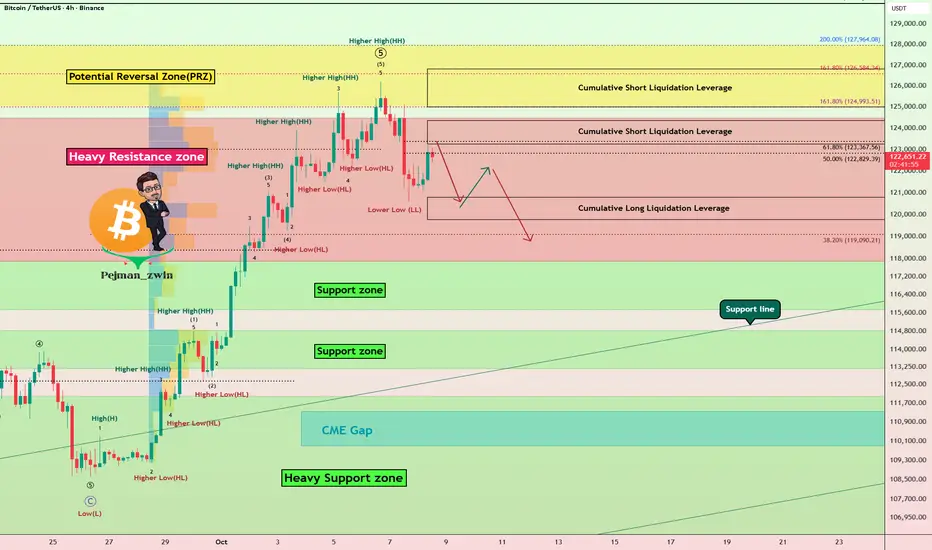
Based on the points above, Bitcoin failed to form a new Higher Low(HL) during the past 24 hours, and the previous high was retested .
These signals indicate a loss of bullish momentum, suggesting that we might see at least a short-term correction from a technical perspective.
Bitcoin has already started to bounce back nicely from the Potential Reversal Zone (PRZ) and is currently trading in a Heavy Resistance zone($124,474-$117,900) .
In terms of Elliott Wave theory , it seems that with the formation of a Lower Low(LL) , Bitcoin has completed at least a series of impulsive waves , and we can now expect corrective waves .
I expect Bitcoin to drop to at least Cumulative Long Liquidation Leverage($120,779-$119,957) before the FOMC Meeting Minutes start and could continue to rise or correct depending on the tone of the FOMC Meeting Minutes .
Note: You should note that these days, Bitcoin has a higher correlation with the SPX500( SP:SPX ) index than before, so if there is a sudden movement in Bitcoin, one of the reasons could be a sudden movement in the SPX500.
Do you think this bullish move could lead to a new all-time high (ATH) for Bitcoin again!?
Cumulative Short Liquidation Leverage: $124,350-$123,244
Cumulative Short Liquidation Leverage: $126,813-$125,000
CME Gap: $111,355-$109,915
Please respect each other's ideas and express them politely if you agree or disagree.
Bitcoin Analysis (BTCUSDT), 4-hour time frame.
Be sure to follow the updated ideas.
Do not forget to put a Stop loss for your positions (For every position you want to open).
Please follow your strategy and updates; this is just my Idea, and I will gladly see your ideas in this post.
Please do not forget the ✅' like '✅ button 🙏😊 & Share it with your friends; thanks, and Trade safe.

Bitcoin Cup and Handle Pattern!BTCUSDT technical analysis update
BTC is forming a cup and handle pattern on the weekly chart. The price is currently forming the handle, which could take 1-2 months to complete. Once the price breaks the neckline, we can expect a significant bullish move in BTC.
Regards
Hexa

Elliott Wave + Gartley Harmonic: Why Bitcoin May Correct Soon!?Bitcoin( BINANCE:BTCUSDT ) has shown strong bullish momentum over the past week, climbing nearly +10% and testing key resistance zones . Several fundamental and technical factors fueled this rally.
Key Drivers of the Rise:
ETF inflows – Significant net inflows into spot Bitcoin ETFs boosted demand.
Macro uncertainty – U.S. government shutdown risk and weaker job data supported risk assets.
Monetary policy – Expectations of softer Fed policy improved market sentiment.
Derivatives impact – Options expiry, high OI, and short squeezes added upward pressure.
Exchange outflows – Lower BTC supply on exchanges signaled accumulation.
Positive sentiment – “Uptober” narrative and bullish analyst targets lifted confidence.
-------------------------------------------
Now, if we look at the Bitcoin chart in the above timeframes from a technical analysis perspective , we can see the following:
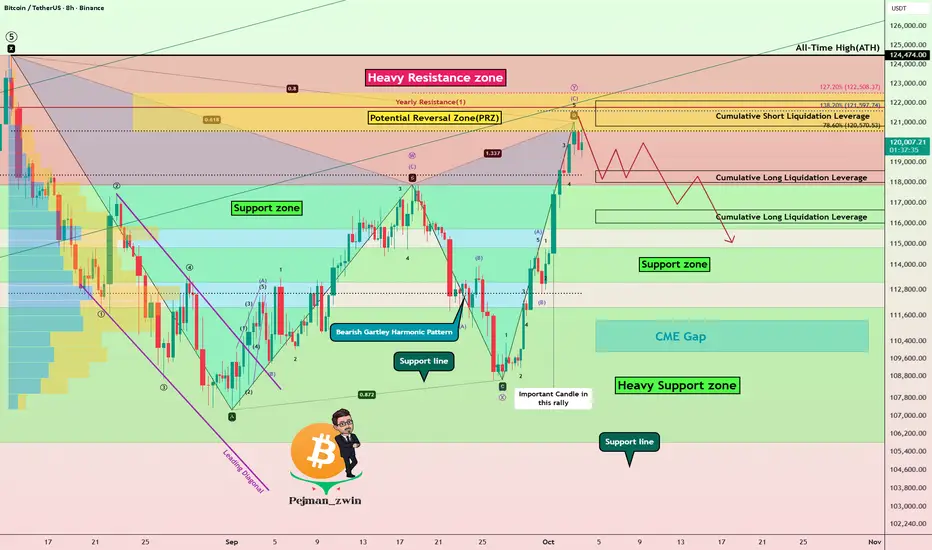
First of all, let me say that the rally that Bitcoin has had over the past 7 days has NOT been accompanied by high volume, and this is not good news for Bitcoin to create a new All-Time High(ATH) .
Bitcoin is entering a Heavy Resistance zone($124,474(ATH)-$117,900) and is moving near the Potential Reversal Zone (PRZ) and Cumulative Short Liquidation Leverage($122,120-$120,823) .
In terms of Elliott Wave theory , Bitcoin appears to be completing a microwave C of the main wave Y . One of the reasons I saw the waves as corrective , other than the microwaves, was the low volume of Bitcoin in the past 7-day rally .
If we look at the Bitcoin chart from a pattern perspective , the important Bearish Gartley Harmonic Pattern is also well and standardly defined on the chart, such that point D in the PRZ can be completed. The Gartley Harmonic Pattern is the most important pattern among the harmonic patterns .
I DO NOT expect a new ATH formation for Bitcoin in this rally due to the above reasons, and I expect it to at least decline to the Support zone($114,820-$113,180) .
Note: Important prices to watch for if Bitcoin reverses (in order of importance of volume): $118,400-$112,700
Note: You should note that these days, Bitcoin has a higher correlation with the SPX500( SP:SPX ) index than before, so if there is a sudden movement in Bitcoin, one of the reasons could be a sudden movement in the SPX500.
Educational Tip : The volume of each candle is considered to be the identity and credibility of that candle, and you can find these candles with the help of volume candle charts.
Cumulative Long Liquidation Leverage: $118,583-$118,000
Cumulative Long Liquidation Leverage: $116,652-$116,000
CME Gap: $111,355-$109,915
Stop Loss(SL): $125,00(Worst)
Please respect each other's ideas and express them politely if you agree or disagree.
Bitcoin Analysis (BTCUSDT), 8-hour time frame.
Be sure to follow the updated ideas.
Do not forget to put a Stop loss for your positions (For every position you want to open).
Please follow your strategy and updates; this is just my Idea, and I will gladly see your ideas in this post.
Please do not forget the ✅' like '✅ button 🙏😊 & Share it with your friends; thanks, and Trade safe.
Is the #BTC rally over? Can 120k hold?📊 Is the #BTC rally over? Can 120k hold?
🧠From a structural perspective, we've established a bearish structure after hitting a new all-time high. This structure targets 118,500-120,377. The neckline support zone is also nearby, so consider monitoring the support strength here to identify potential long trades.
➡️After the uptrend support line was broken, we're currently testing the yellow support zone. Therefore, shorting here is not recommended. Instead, consider looking for long positions in anticipation of a rebound.
🤜If you like my analysis, please like 💖 and share 💬
BITGET:BTCUSDT.P

Bitcoin - The path remains clearly bullish!💰Bitcoin ( CRYPTO:BTCUSD ) remains bullish either way:
🔎Analysis summary:
For the past 1.000 days, Bitcoin has simply been heading higher. Considering that the previous bullruns lasted about 800 days, Bitcoin is ready for a correction. But market structure tells us, that Bitcoin remains bullish, even if we see a short term correction in the near future.
📝Levels to watch:
$50.000, $1.000.000
SwingTraderPhil
SwingTrading.Simplified. | Investing.Simplified. | #LONGTERMVISION

Harmonic Pattern made ...Hello everyone
According to the chart that you can see the price of BTC was completed the harmonic pattern and according to the rules of the classical technical we expect the market after some correction rise up to the PRZ level that we shown and after that we update the analysis.
Be your hero
AA

#BTC UPDATE!CRYPTOCAP:BTC is currently breaking below the 1H uptrend line, showing early signs of weakness.
If we get a confirmed 1-hour candle close below this trendline, short setups could come into play.
The first key support sits around $123,200, with the next major demand zone near $119,415.
For now, the focus is on how this hourly candle closes. A strong rejection could push BTC back above $124,474, but a confirmed breakdown would likely shift short-term momentum to the bearish side.
DYOR, NFA
CRYPTOCAP:BTC BITSTAMP:BTCUSD BINANCE:BTCUSDT
#Crypto

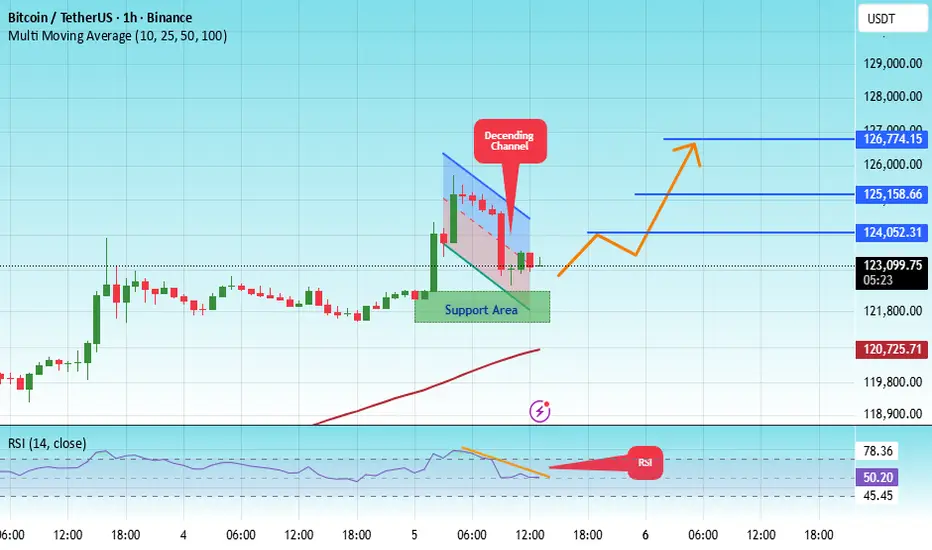
#BTC/USDT Let Bitcoin make a new ATH#BTC
The price is moving within a descending channel on the 1-hour frame, adhering well to it, and is heading for a strong breakout and retest.
We have a bearish trend on the RSI indicator that is about to be broken and retested, which supports the upward move.
There is a major support area in green at 121900, which represents a strong support point.
We are heading for consolidation above the 100 moving average.
Entry price: 123300.
First target: 124050.
Second target: 125160.
Third target: 126774.
Don't forget a simple matter: capital management.
When you reach the first target, save some money and then change your stop-loss order to an entry order.
For inquiries, please leave a comment.
Thank you.
#BTC Potential Bearish Head and Shoulders📊#BTC Potential Bearish Head and Shoulders📉
🧠From a structural perspective, we've reached a new all-time high, but the weekly resistance level is nearby. Chasing the trend here presents a less-than-ideal profit-loss ratio and carries a higher risk. There's a chance a bearish head and shoulders pattern could form. If so, consider some short trades.
➡️If you're shorting now, be aware that you're trading against the trend, so use a small position. The advantage of this approach is a higher profit-loss ratio, but a lower win rate.
🤜If you like my analysis, please like 💖 and share 💬
BITGET:BTCUSDT.P

Want to Trade Like a Pro? This BTC Layer Strategy is Your Answer🚀 Become a Pro Trader: The "Thief" Layer Strategy for BTC/USDT (Bullish Swing Plan) 🚀
Unlock a professional money-making operation! This detailed plan combines a unique entry technique with deep fundamental & sentimental analysis to give you an edge.
📈 Trade Idea: BTC/USDT (Swing / Day Trade)
Bias: Bullish | Timeframe: 4H - 1D
🎯 The "Thief" Layer Entry Strategy
This strategy "steals" good entries at various levels instead of chasing the market.
Entry Method: Multiple Buy Limit Orders (Layering)
Proposed Entry Zones: $111,000 | $111,500 | $112,000 | $112,500
You can add more layers based on your capital and risk appetite.
⛔ Stop Loss (Risk Management)
Hard Stop Loss: $110,000 (Below key support)
⚠️ IMPORTANT NOTE (Thief OG's): This is MY stop loss. You MUST adjust your SL based on your personal risk management strategy. Protect your capital first.
🎯 Take Profit (Exit Strategy)
Primary Target: $116,000 (Strong Resistance + Overbought Zone)
The Plan: Escape with "stolen" profits before any potential trap snaps shut!
⚠️ IMPORTANT NOTE (Thief OG's): This is MY target. You are free to take profit earlier or adjust based on your own analysis. Secure your bags!
🔍 Why This Plan? The "Thief's" Analysis
This trade setup is backed by a confluence of technical, fundamental, and sentimental factors.
📊 Technical & Sentimental Backdrop (As of Sept 9, 2025)
Price Action: BTC showed strength with a +1.52% gain, bouncing from the $111,184 support.
Market Sentiment (Fear & Greed Index): 48/100 (Neutral) 😐. This indicates a balanced market with no extreme fear or greed—often a good base for a move.
Retail vs. Institutional:
Retail Traders: 55% Long (Slightly Bullish) 🤔. Fueled by Fed rate cut expectations.
Institutional Traders: 60% Short (Cautiously Bearish) 🏢. Their selling pressure appears to be exhausting, as shown by declining volume on dips. This creates a contrarian opportunity.
🌍 Fundamental & Macro Tailwinds
The $7.26T Cash Pile: Money market funds are holding a massive $7.26 Trillion. A Fed rate cut could unleash this capital into risk assets like Bitcoin. 🏦
Fed Rate Decision: An expected 25-50 bps cut is highly bullish for crypto, potentially triggering a major rotation.
Strong Bitcoin Fundamentals:
Low Inflation Rate: Only 1.17% (low new supply pressure). ✅
Network Health: Active addresses and settlement volume remain stable (~$12.9B/24h).
Dominance: BTC is outperforming traditional safe havens like gold (+102% YoY vs. gold's +42%).
✅ Overall Outlook Score
Bull (Long) Score: 55/100 → Neutral-Bullish 🐂
Bear (Short) Score: 45/100 → Weak Bearish Pressure 📉
🎯 Final Thief's Outlook: Cautiously optimistic. The layered entry strategy allows us to capitalize on potential upside driven by macro factors while strategically managing risk.
👀 Related Pairs to Watch
BINANCE:ETHUSDT | BINANCE:SOLUSDT | BINANCE:BNBUSDT (Altcoins follow BTC's lead)
TVC:DXY (U.S. Dollar Index) | CBOE:SPX (S&P 500)
✨ “If you find value in my analysis, a 👍 and 🚀 boost is much appreciated — it helps me share more setups with the community!”
#BTC #Bitcoin #Trading #Strategy #LayerStrategy #SwingTrading #Cryptocurrency #TechnicalAnalysis #FundamentalAnalysis #ThiefStrategy

#BTC heavy resistance zone!Cautious callback📊#BTC heavy resistance zone!Cautious callback📉
🧠From a structural perspective, we're currently near an overlapping resistance zone, raising the probability of a pullback. Therefore, proceed with caution when buying higher!
➡️A break below the uptrend support line would further strengthen the bearish outlook. At that point, look for shorting opportunities after a rebound.
⚠️If we continue to reach new all-time highs, the bearish outlook would be invalidated!
🤜If you like my analysis, please like 💖 and share 💬
BITGET:BTCUSDT.P

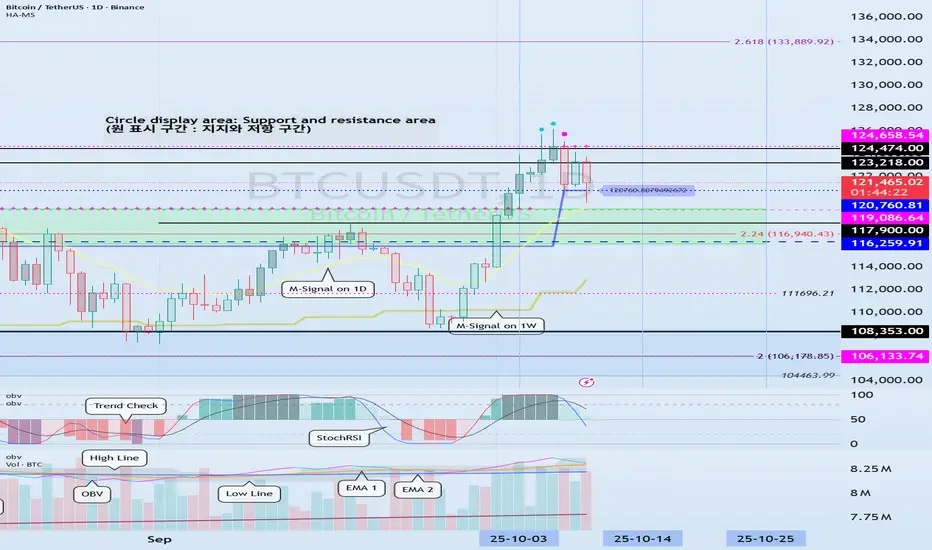
Next Volatility Period: Around October 14th
Hello, traders!
Follow us to get the latest information quickly.
Have a great day!
-------------------------------------
(BTCUSDT 1D Chart)
This volatility period is expected to last until October 4th.
Accordingly, the key question is whether it can find support near 119,177.56 and rise.
If not, and the price declines, support near 115,854.56 will be crucial.
If it finds support near 119,177.56 and rises, it is expected to challenge the Fibonacci ratio of 2.618 (133,889.92).
The key areas for maintaining an uptrend are:
- Short-term: 115,854.56-119,177.56,
- Medium-term: 104,463.99-108,353.0,
- Long-term: 87,814.27-93,570.28.
-
Thank you for reading.
We wish you successful trading.
--------------------------------------------------
- Here's an explanation of the big picture.
(3-year bull market, 1-year bear market pattern)
I'll explain more in detail when the bear market begins.
------------------------------------------------------

Bitcoin Faces $120K Resistance – Bull Trap or Breakout?Bitcoin ( BINANCE:BTCUSDT ) continued its uptrend of the last 2-3 days as I expected in my previous idea . Today, the announcement of the ADP Non-Farm Employment Change index worked like a catalyst for Bitcoin .
Bitcoin is currently surrounded by Resistance zones and a Potential Reversal Zone (PRZ) , and is near the important price of $118,400(Volumetric importance) and the $120,000(Round Number) .
From the perspective of Elliott Wave theory , it seems that Bitcoin could be in corrective waves and that the increase of the last few days could only serve as a Bull Trap .
I expect Bitcoin to decline at least to the Support lines .
Cumulative Long Liquidation Leverage: $113,590-$111,900
Cumulative Long Liquidation Leverage: $115,823-$115,087
Cumulative Short Liquidation Leverage: $120,000-$118,000
Note: If Bitcoin falls below the Support zone($114,820-$113,180), we should expect further declines.
CME Gap: $111,355-$109,915
Stop Loss(SL): $120,103
Please respect each other's ideas and express them politely if you agree or disagree.
Bitcoin Analysis (BTCUSDT), 1-hour time frame.
Be sure to follow the updated ideas.
Do not forget to put a Stop loss for your positions (For every position you want to open).
Please follow your strategy and updates; this is just my Idea, and I will gladly see your ideas in this post.
Please do not forget the ✅' like '✅ button 🙏😊 & Share it with your friends; thanks, and Trade safe.

#BTC/USDT Analysis — Pullback Before Bullish Continuation#BTC
The price is moving within a descending channel on the 4-hour frame, adhering well to it, and is heading for a strong breakout and retest.
We have a bearish trend on the RSI indicator that is about to be broken and retested, which supports the upward breakout.
There is a major support area in green at 111600, which represents a strong support point.
We are heading for consolidation above the 100 moving average.
Entry price: 111750.
First target: 112684.
Second target: 113672.
Third target: 115048.
Don't forget a simple matter: capital management.
When you reach the first target, save some money and then change your stop-loss order to an entry order.
For inquiries, please leave a comment.
Thank you.

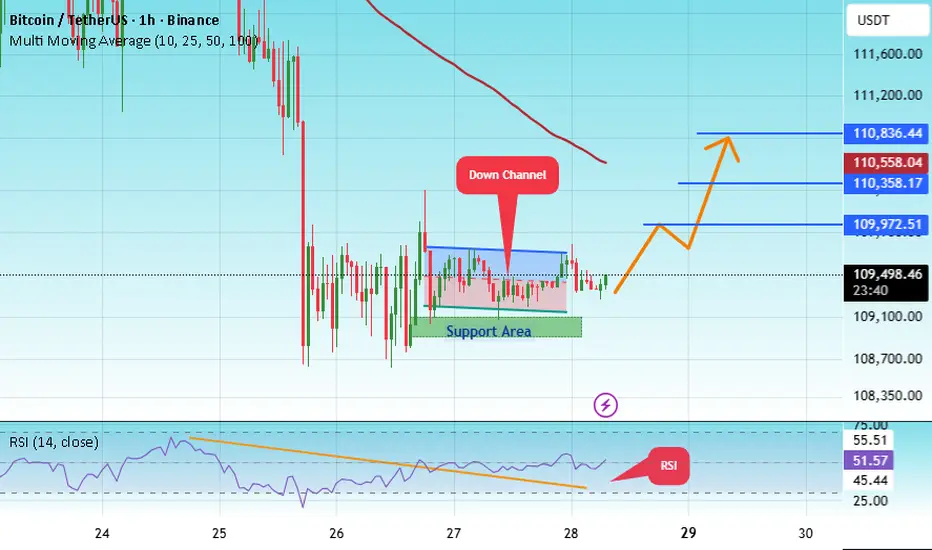
#BTC/USDT Analysis: Key Level to Watch#BTC
The price is moving within a descending channel on the 1-hour frame, adhering well to it, and is heading for a strong breakout and retest.
We have a bearish trend on the RSI indicator that is about to be broken and retested, which supports the upward breakout.
There is a major support area in green at 109100, representing a strong support point.
We are heading for consolidation above the 100 moving average.
Entry price: 109470.
First target: 109900.
Second target: 110360.
Third target: 110836.
Don't forget a simple matter: capital management.
When you reach the first target, save some money and then change your stop-loss order to an entry order.
For inquiries, please leave a comment.
Thank you.
Trading Strategy
Hello, fellow traders!
By "Following" us, you'll always receive the latest information quickly.
Have a great day.
-------------------------------------
The conditions that lead people to start trading vary.
Before starting a trade, you should consider a trading strategy.
A trading strategy should include:
1. Investment period
2. Investment size
3. Trading method and profit realization method
You should categorize the coins (tokens) you wish to trade based on items 1-3 above.
1. The investment period is the most important.
While the investment period varies from person to person, BTC and ETH are generally considered long-term investments.
Since BTC and ETH are important coins that support the cryptocurrency market, I recommend investing in either BTC or ETH.
All coins other than BTC are broadly categorized as altcoins. However, among them, BNB, SOL, XRP, TRX, and ADA LINK, which have high market capitalizations and have been around for a long time, are suitable for mid- to long-term investment.
However, since these coins are also broadly categorized as altcoins, it's recommended to increase the number of coins (tokens) that generate income, if possible, for mid- to long-term investment.
This method involves selling the original purchase price (plus transaction fees) when the price rises, leaving the remaining coins (tokens) available for profit.
This allows you to increase the number of coins (tokens) with an average purchase price of zero, making mid- to long-term investment feasible.
While it's certainly advisable to sell your holdings to generate cash profits, this practice is not suitable for mid- to long-term investment.
This is because if you make a mistake, you could end up buying at a high price and incur losses for a long period of time.
-
2. You should determine your investment size based on your investment period.
In other words, if you're making a long-term investment and have already invested all your capital, you could miss out on good opportunities in the future.
Therefore, it's best to invest in the following order: long-term investment < mid- to long-term investment < short-term investment.
Furthermore, you should keep approximately 20% of your total investment in cash.
This allows you to trade when a good opportunity arises.
If you run out of cash after trading, try to sell when the price rises to secure cash.
Furthermore, you should avoid investing in too many coins (tokens).
-
3. Once you've determined your investment period and size, you need to find the right buy and sell points for actual trading.
Therefore, you need to define your trading method and profit-making method.
The basic trading strategy is to buy in the DOM(-60) ~ HA-Low range and sell in the HA-High ~ DOM(60) range.
However, if the price rises in the HA-High ~ DOM(60) range, a stepwise upward trend is likely, while if the price falls in the DOM(-60) ~ HA-Low range, a stepwise downward trend is likely.
Therefore, the basic trading strategy should be a split trading strategy.
In other words, if you buy in the DOM(-60) ~ HA-Low range and the price rises to form the HA-High ~ DOM(60) range, it's best to sell in splits and observe the situation.
This stabilizes your psychological state, allowing you to re-analyze the charts.
Maintaining a stable psychological state is crucial for trading.
If your psychological state is unstable, you're more likely to make unexpected trades.
Therefore, it's important to have a basic trading strategy that suits your investment style.
As mentioned earlier, to maintain a mid- to long-term investment, you need to decide whether to increase the number of coins (tokens) that generate profits or to generate cash returns. Before conducting a trade, you need to decide whether to do so.
Since the coin market is increasingly interconnected with the stock market, you can try to interpret it using the same method as the stock market.
In other words, rather than examining the flow of funds within the coin market itself, you should prioritize assessing the stock market, social issues, the economy, and politics to determine market trends.
I believe this problem stems from a lack of understanding of the coin market.
While some external factors may influence the flow of funds within the coin market, they are not suitable for predicting it.
Therefore, you should check the USDT, USDC, USDT.D, and BTC.D charts to confirm the flow of funds within the coin market.
Next, you should check the charts of the coin (token) you wish to trade to determine if it fits your basic trading strategy and develop a trading strategy.
Finally, by examining issues beyond the coin market, you can make an objective decision about your trading.
Otherwise, you will likely make inappropriate trades based on subjective opinions stemming from issues outside the coin market.
To analyze and interpret the coin market like the traditional stock market, the two markets must be integrated.
Otherwise, I believe the coin market should not be analyzed or interpreted like the stock market.
-
Thank you for reading to the end.
I wish you successful trading.
--------------------------------------------------

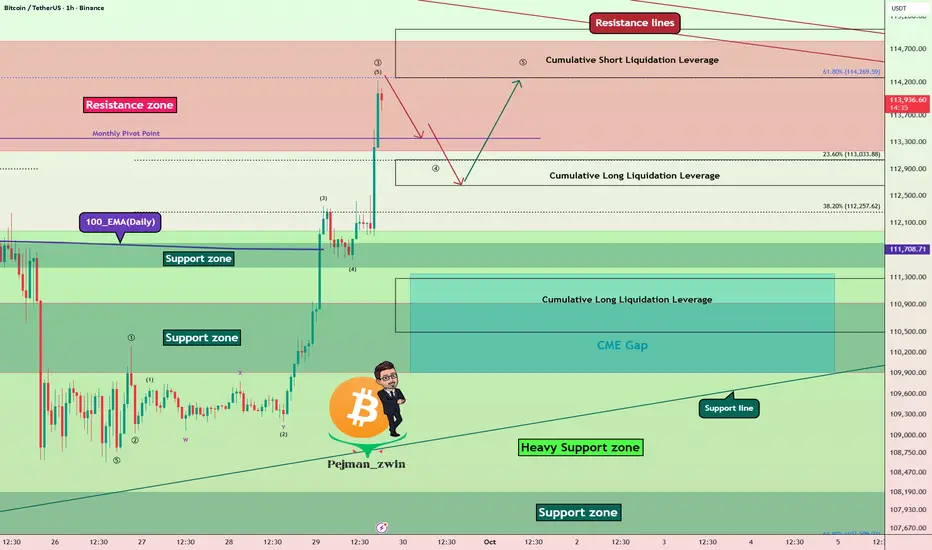
Bitcoin Resistance Zone Battle – ATH or Fakeout?Bitcoin ( BINANCE:BTCUSDT ) has shown strong momentum over the past 5 days , liquidating many traders in both Long and Short positions .
Bitcoin has now entered the Resistance zone($114,820-$113,170) and is moving near the Cumulative Short Liquidation Leverage($115,000-$114,272) and Resistance lines .
From an Elliott Wave Theory perspective, given Bitcoin’s strong bullish momentum over the past 24 hours, it appears to be completing Wave 3. This Wave 3 seems to be of the extended type.
I expect Bitcoin , after a correction , to make another attempt toward the Resistance zone($114,820-$113,170) and potentially test the Resistance lines .
Do you think this bullish move could lead to a new all-time high (ATH) for Bitcoin?
Cumulative Long Liquidation Leverage($113,037-$112,650) + Near Monthly Pivot Point($113,356): An area where Bitcoin could start rising again (if there is a correction, of course).
Cumulative Long Liquidation Leverage: $111,100-$110,500
CME Gap: $111,355-$109,915
Note: Also, Bitcoin approaching the 61.8% golden Fibonacci level could lead to a Bitcoin correction.
Please respect each other's ideas and express them politely if you agree or disagree.
Bitcoin Analysis (BTCUSDT), 1-hour time frame.
Be sure to follow the updated ideas.
Do not forget to put a Stop loss for your positions (For every position you want to open).
Please follow your strategy and updates; this is just my Idea, and I will gladly see your ideas in this post.
Please do not forget the ✅' like'✅ button 🙏😊 & Share it with your friends; thanks, and Trade safe.
#BTC Rising Wedge📊#BTC Rising Wedge📉
🧠From a structural perspective, we are within the target zone of a bullish pattern and near the previous high. Therefore, chasing the rally here is not recommended. If you want to enter a long trade, consider the support near the rising trend support line. If we break through the h D point directly, the next strong resistance level will be around 120,000.
➡️From a chart perspective, a rising wedge may be forming here. If the lower edge of the wedge is broken, bearish expectations will increase.
🤜If you like my analysis, please like 💖 and share 💬
BITGET:BTCUSDT.P

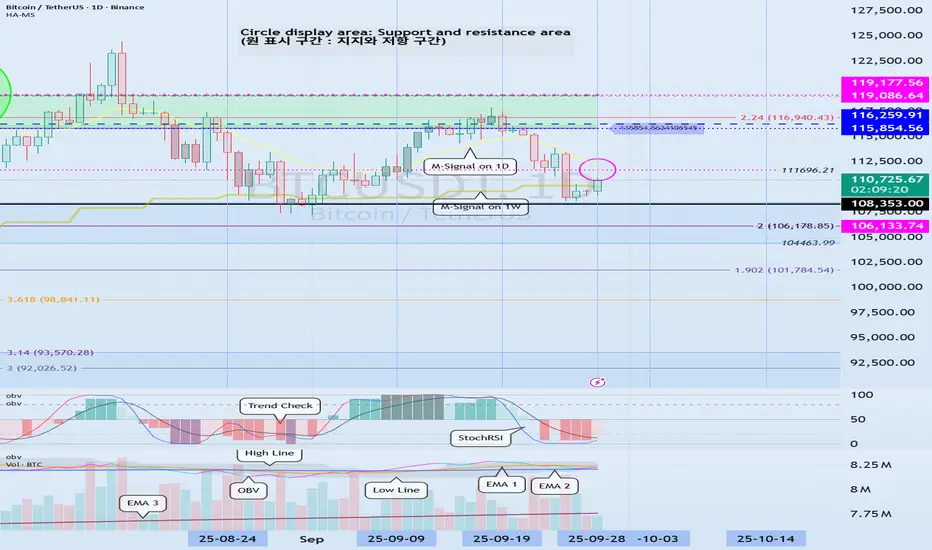
Next Volatility Period: Around October 3rd (October 2nd-4th)
Hello, fellow traders!
Please "Follow" to get the latest information quickly.
Have a great day!
-------------------------------------
(BTCUSDT 1D Chart)
This volatility period lasts until September 29th, but since the next volatility period is around October 3rd (October 2nd-4th), it's highly likely that the volatility period will continue until October 4th.
Therefore, we need to see if the price can sustain above 11696.21 after the volatility period.
If it fails to do so and falls below the 104463.99-108353.0 range, a sharp decline is likely.
If a sharp decline occurs, we need to check for the formation of new indicators such as the DOM (-60) or HA-Low indicators.
If new support is formed, it's important to determine whether there is support near that area.
If support is not found, a step-down trend is likely.
-
It is currently located near the M-Signal indicator on the 1W chart and the M-Signal indicator on the 1D chart.
Therefore, if the price rises above 111696.21 and holds, further upward movement is likely.
At this point, the key question is whether the price can rise above 115854.56 and hold.
To sustain the uptrend,
- The StochRSI indicator must show an upward trend. It must rise from the oversold zone.
- The On-By-Signal (OBV) indicator must show an upward trend. It must rise above EMA 1 and, if possible, above the High Line and remain there.
- The TC (Trend Check) indicator must show an upward trend. It must rise above the 0 point and remain there.
If the above conditions are met, the uptrend is likely to continue above 111696.21.
-------------------------------------------
The basic trading strategy is to buy in the DOM(-60) ~ HA-Low range and sell in the HA-High ~ DOM(60) range.
However, if the price rises in the HA-High ~ DOM(60) range, a stepwise upward trend is likely, while if the price falls in the DOM(-60) ~ HA-Low range, a stepwise downward trend is likely.
Therefore, the basic trading strategy should be a segmented trading approach.
This basic trading strategy principle was developed for trading on Heikin-Ashi charts.
Adding the M-Signal indicator on the 1M, 1W, and 1D charts allows you to see the overall trend.
The remaining indicators indicate support and resistance points or zones for chart analysis or trading strategies.
Trading is all about reaction, so understanding support and resistance points or zones is crucial.
However, you should interpret the charts based on core fundamental trading strategies.
-
Thank you for reading to the end.
I wish you successful trading.
--------------------------------------------------
- Here's an explanation of the big picture.
(3-year bull market, 1-year bear market pattern)
I'll explain more in detail when the bear market begins.
------------------------------------------------------