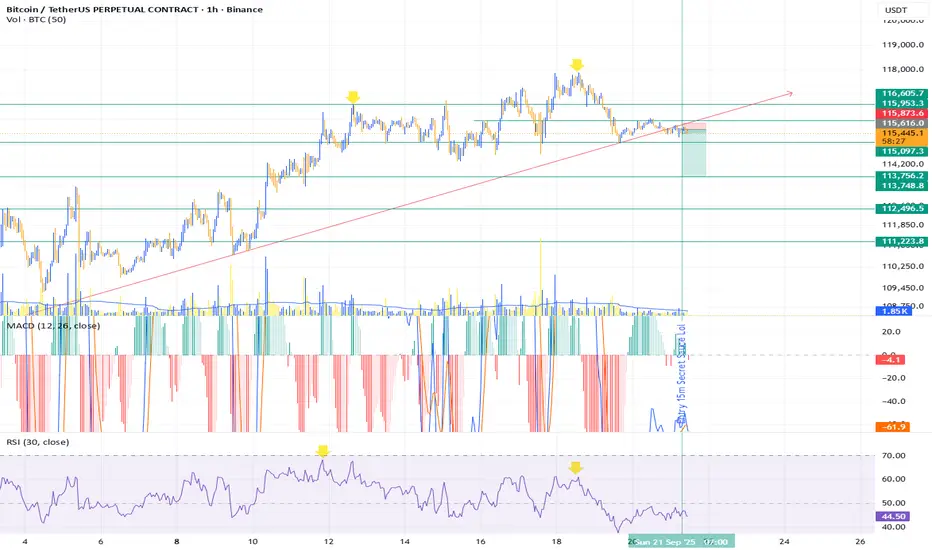
$BTCUSDT Long Limit SetupCRYPTOCAP:BTC is taking short term pull back here.
Confluences:
Broke out from the current lower-lower structure.
Shifted 4hr+1D Structure to Bullish
Getting a pull back to 1D-4H OB.
Keep limits open or stay updated with me.
Follow for more <3
BTCUSDTPERP

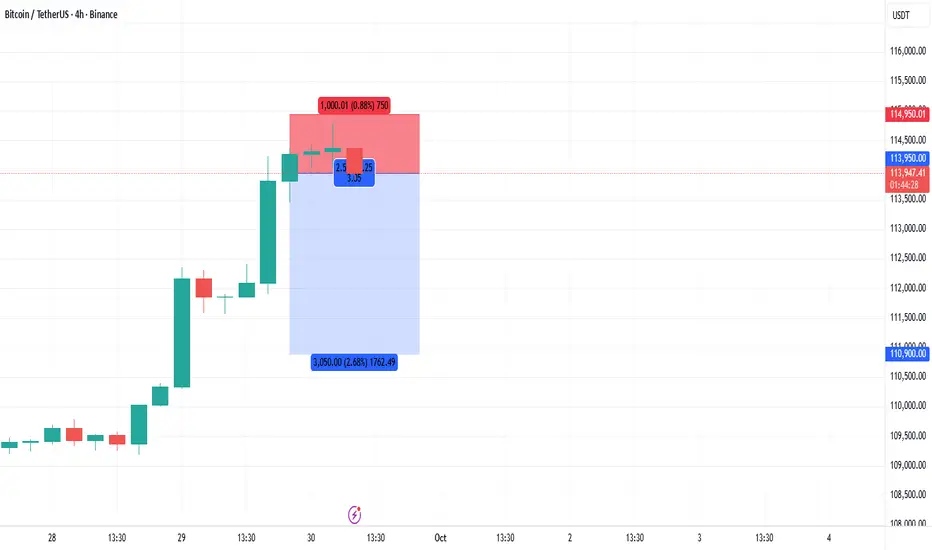
BTCUSDT Short Position on futuresBitcoin seems to have a downtrend below 114,000. Opened a short position around these important levels
Entry Price: 113,950
SL: 114,950
TP1: 112,000
TP2: 110,950
#BTCUSDT.P (15m Chart)#BTCUSDT.P
(15m Chart)
🔹️ Bitcoin Futures Analysis 🔹️
✅ Entry Zone: 109,800 – 109,500
❌ Stop Loss: 108,000
🎯 Targets:
🔰 Target 1: 111,000
🔰 Target 2: 111,800
🔰 Target 3: 112,400
🔰 Target 4: 113,600
🔰 Target 5: 114,500
📌 Based on the current conditions of Bitcoin and USDT dominance, I expect a bullish move in the market this week.
📍 This is the setup I expect to play out for Bitcoin.
⚠️ Important Notes:
Keep leverage below 10.
Follow risk management strictly.
Do not place pending orders. I’m monitoring the market myself, and if the entry zone is reached and conditions look good, I’ll announce the entry.
🆔 @Rasoolahmadi

Bitcoins future...Been playing around and we could be in trouble here if the bottom line of the rising wedge ends up broken.
We could see price levels as low as 1500-2k in worst case scenarios!
Most likely we will go down and test 60k area based on trendlines and resists.
The circles shows a zone/area we can go up and fill to complete the rising wedge.
These times are so exciting so much money can be made if you're watching it closely!

Bitcoin Roadmap: Can BTC Hold the $108K Before Next Big move!?Bitcoin( BINANCE:BTCUSDT ) managed to break the Support zone($110,920-$109,900) and Support lines yesterday with the help of a Bearish Marubozu Candle(the Marubozu candle volume was acceptable).
Bitcoin is still moving in the Heavy Support zone($112,000-$105,800) and near the important Support line, Potential Reversal Zone(PRZ) , Cumulative Long Liquidation Leverage($108,165-$107,000).
In terms of Elliott Wave theory, Bitcoin appears to be completing microwave 5 of the main wave 3. Microwave 4 of the main wave 3 is of the Contracting Triangle type, and the main wave 3 is of the extended type.
I expect Bitcoin to start rising and attack the Resistance lines after completing the main wave 3 from the Potential Reversal Zone(PRZ) , Support zone($108,200-$107,240), and Important Support line.
Cumulative Short Liquidation Leverage: $110,624-$109,836
Note: If Bitcoin touches $106,800, we can expect a break of the Heavy Support zone($112,000-$105,800).
Note: If Bitcoin goes above $111,000, we can expect a renewed rise in Bitcoin.
---------------------------------------------
One of the indices that helps the Roadmap of Bitcoin and other tokens is the USDT.D%.
USDT.D% currently seems to have managed to break the heavy resistance zone and this is NOT good news for Bitcoin and other tokens, and perhaps a further correction in the crypto market is on the way.
USDT.D%’s roadmap for me is that it is almost in line with today’s analysis of Bitcoin.
---------------------------------------------
Please respect each other's ideas and express them politely if you agree or disagree.
Bitcoin Analysis (BTCUSDT), 1-hour time frame.
Be sure to follow the updated ideas.
Do not forget to put a Stop loss for your positions (For every position you want to open).
Please follow your strategy and updates; this is just my Idea, and I will gladly see your ideas in this post.
Please do not forget the ✅' like '✅ button 🙏😊 & Share it with your friends; thanks, and Trade safe.

BTCUSD LongThis is a buy-the-dip setup. If 107k holds, BTC could rebound toward 112k–120k. If 105k breaks, expect deeper downside risk.

BTC/USDT — Bull Flag Formation: Continuation Rally or Breakdown?📝 Full Analysis
Bitcoin is currently forming a classic Bull Flag pattern. This setup appears after a strong impulsive rally (flagpole), followed by a corrective consolidation within a descending channel (the flag). Technically, a bull flag often indicates a bullish continuation, suggesting the market is taking a breather before resuming its upward trend.
🔍 Bull Flag Characteristics on the Chart
Flagpole: The sharp rally that pushed BTC up to 124,474.
Flag: A descending parallel channel where price consolidates with lower volatility and reduced volume.
Key Support (~109k): This level acts as the foundation of the flag. As long as BTC holds above it, the bull flag remains valid.
---
📈 Bullish Scenario (Bull Flag Confirmation)
Price holds above 109k and bounces higher.
A valid breakout above the upper flag trendline with a strong 2D candle close and higher volume would confirm the bull flag.
Upside targets:
Immediate Resistance: 117k → 120k.
Retest of Previous High: 124.4k.
Theoretical Bull Flag Target: potentially extending toward 130k+ in the mid-term.
---
📉 Bearish Scenario (Invalidation of Bull Flag)
If BTC fails to sustain above 109k, the bull flag risks invalidation.
A breakdown of this key level could drag price back to 103k, with extended downside risk toward 74.5k if selling pressure intensifies.
In this case, the flag turns into a failed continuation setup, shifting market sentiment bearish.
---
⚖️ Conclusion
The chart currently reflects a textbook Bull Flag: impulsive rally → corrective descending channel.
As long as 109k holds, the bullish continuation bias remains intact.
A breakdown below 109k, however, opens the door to a deeper correction.
---
📌 Trading Outlook (Not Financial Advice)
Bullish Plan: Enter on a confirmed breakout above the flag with strong volume. Targets: 117k → 120k → 124k+.
Bearish Plan: If breakdown occurs below 109k, short-term target ~103k, extended target ~74.5k.
---
#Bitcoin #BTC #BTCUSDT #BullFlag #Crypto #TechnicalAnalysis #ChartPattern #BullishContinuation #Breakout

Volatility Period: Around September 19th (September 18th-20th)
Hello, traders!
Follow us to get the latest information quickly.
Have a great day!
-------------------------------------
(BTCUSDT 1D Chart)
This volatility period is around September 19th (September 18th-20th).
As this period of volatility progresses, we need to examine the direction in which the price deviates from the 115,854.56-119,177.56 range.
As previously mentioned, the key ranges are 87,814.27-93,570.28 and 104,463.99-108,353.0.
Therefore, if the price falls below 115,854.56, we need to check for support near these key levels.
-
It's perhaps natural for trading volume to decrease after a new ATH (Any New High).
If a new ATH (Any New High) is met with high trading volume, it could indicate a significant amount of profit-taking, increasing the likelihood of a downward trend.
Therefore, I don't think it's wise to interpret the current decline in trading volume as a sign of a decline.
We're using the On-By-Volume (OBV) indicator, which helps us understand the movement of trading volume, so we can roughly gauge the current trading volume trend.
-
The HA-High ~ DOM(60) range on the 1D chart is 115854.56-119177.56, and the HA-High ~ DOM(60) range on the 1W chart is 116259.91-119086.64.
Since these two resistance levels overlap, a breakout above this level suggests a potential surge.
-
Thank you for reading to the end.
We wish you successful trading.
--------------------------------------------------
- This is an explanation of the big picture.
(3-year bull market, 1-year bear market pattern)
I will explain in more detail when the bear market begins.
------------------------------------------------------

Corrections Are Temporary, Bullish Trend Is NotWhile the price is correcting now, it's important to remember this is likely just a healthy consolidation before the next move up. The overall trend is still bullish, with higher highs being made over time, even through corrections.
So, don't let short-term dips cloud your judgment. Focus on the long-term trend, as these corrections can present opportunities to accumulate at key support levels.
Stay tuned for more updates
#PEACE ✌

#BTC/USDT THE ONLY BITCOIN CHART YOU NEED!BTC : Almost There!
BTC is currently following the trajectory shown in my last chart. It took some time, but it’s playing out exactly as expected. Sooner or later, a bounce is coming — there’s no reason to panic unless we break below $103.5K, which is the key support level.
You need to understand that only when money moves out of BTC and big-cap alts will THE MID AND THE SMALL CAPS will have their time to shine. And sooner or later, you'll realise all this happened for good if you played it right. Even if not, many opportunities are coming ahead.
You’ll see this happen soon.
MY MESSAGE TO YOU ALL:
If you've been in crypto for a few years, you know this moment: it’s when the market is on the brink of a big move.
Be patient, it won’t happen overnight, but sooner or later, it will.
If you're currently in the red, take it as a lesson. It happens to the best of us. I've had four positions stopped out, too. It could have been worse if I hadn’t had a STOP LOSS in place.
The silver lining? I can re-enter at a better price.
A lesson I’ve learned over the years: STOP LOSS is a life-saver.
Stay strong and don’t give up right before the big opportunity we’ve all been waiting for.
Opportunities are ahead, manage your risks and remember to take a break, touch some grass. I’m with you.
I'll drop more charts shortly.
Stay strong, folks.
WAGMI!
Do hit the like button, and if you have any doubts, questions, or chart requests, drop them in the comments.
Thank you
#PEACE

Bitcoin Setup: Eyeing CME Gap at $113KBitcoin( BINANCE:BTCUSDT ) is currently trading in a Heavy Support zone($112,000-$105,800) and near the Support zone($110,920-$109,900), Support lines, Potential Reversal Zone(PRZ) , and Cumulative Long Liquidation Leverage($110,430-$109,660).
In terms of Elliott Wave theory, Bitcoin seems to have completed a microwave 5, the reason for today's drop was the correction in the SPX500 index( SP:SPX ) and the release of US indices(Final GDP q/q, Unemployment Claims).
Also, we can see the Regular Divergence(RD+) between Consecutive Valleys.
I expect Bitcoin to move back above 100_EMA(Daily) because the breakout volume was not enough, and attack the Resistance lines. If the Resistance lines are broken we can expect the CME Gap($113,380-$113,275) to fill.
First Target: $112,600
Second Target: $113,280
Stop Loss(SL): $109,280
Cumulative Short Liquidation Leverage: $114,866-$113,720
Please respect each other's ideas and express them politely if you agree or disagree.
Bitcoin Analysis (BTCUSDT), 1-hour time frame.
Be sure to follow the updated ideas.
Do not forget to put a Stop loss for your positions (For every position you want to open).
Please follow your strategy and updates; this is just my Idea, and I will gladly see your ideas in this post.
Please do not forget the ✅' like '✅ button 🙏😊 & Share it with your friends; thanks, and Trade safe.

Bitcoin Outlook: From Support Bounce to Short Liquidation TargetBitcoin ( BINANCE:BTCUSDT ) moved as I expected in my previous idea ( Long and Short positions hit their targets ).
Bitcoin is currently moving near the Resistance zone($114,820-$113,170) , Resistance line, and the Monthly Pivot Point , and seems to have failed to break 100_EMA(Daily) .
In terms of Elliott Wave theory , Bitcoin completed wave 5 as I expected by attacking 100_EMA(Daily) and Heavy Support zone($112,000-$105,800) , and we can expect more bullish waves .
I expect Bitcoin to break the Resistance line in the coming hours and attack the Resistance zone ($114,820-$113,170) and the Cumulative Short Liquidation Leverage ($114,334-$113,400) .
Cumulative Long Liquidation Leverage: $110,950-$110,350
Note: If Bitcoin goes above $115,000, we should expect Bitcoin to rise again.
Please respect each other's ideas and express them politely if you agree or disagree.
Bitcoin Analysis (BTCUSDT), 1-hour time frame.
Be sure to follow the updated ideas.
Do not forget to put a Stop loss for your positions (For every position you want to open).
Please follow your strategy and updates; this is just my Idea, and I will gladly see your ideas in this post.
Please do not forget the ✅' like '✅ button 🙏😊 & Share it with your friends; thanks, and Trade safe.
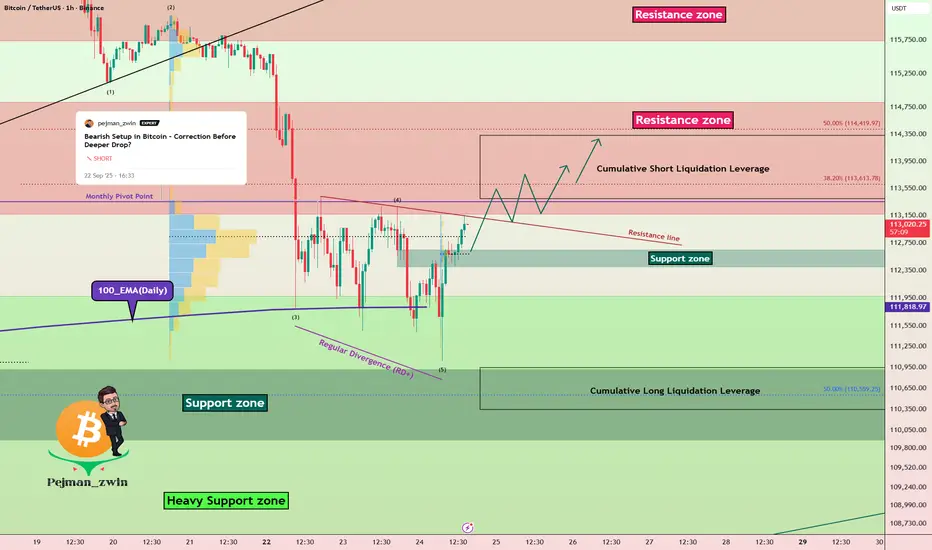
Bearish Setup in Bitcoin – Correction Before Deeper Drop?Bitcoin ( BINANCE:BTCUSDT ) started to decline and broke the ascending channel and Support zone($114,820-$113,170) with the help of the Bearish Flag Pattern , as I expected in the previous idea update .
Do you think Bitcoin can go below $105,000 !?
Bitcoin is once again approaching 100_EMA(Daily) and the Heavy Support zone($112,000-$105,800) .
From the perspective of Elliott Wave theory , Bitcoin appears to have completed the Zigzag Correction(ABC/5-3-5) in the ascending channel, and now it seems that we should expect bearish waves .
I expect Bitcoin to FAIL to break the 100_EMA(Daily) with one attack and have an upward correction to Fibonacci levels and Cumulative Short Liquidation Leverage($114,098-$113,229) , and then re-attack the Heavy Support zone($112,000-$105,800) and 100_EMA(Daily) .
Cumulative Long Liquidation Leverage: $111,850-$110,421
Note: If Bitcoin goes above $115,000, we should expect Bitcoin to rise again.
Note: There is also a possibility that the SPX500 index( SP:SPX ) will also correct and, given Bitcoin's correlation with this index, cause Bitcoin to correct further.
Please respect each other's ideas and express them politely if you agree or disagree.
Bitcoin Analysis (BTCUSDT), 4-hour time frame.
Be sure to follow the updated ideas.
Do not forget to put a Stop loss for your positions (For every position you want to open).
Please follow your strategy and updates; this is just my Idea, and I will gladly see your ideas in this post.
Please do not forget the ✅' like '✅ button 🙏😊 & Share it with your friends; thanks, and Trade safe.

BTC Swing short SetupIf setup failed, then possible btc may form 3 drive pattern n dump again, in this case will share new setup, while not bearish but looking for a good correction, take short with low margin from first setup, n 4% on second setup must use SL on both short setups. Best Of Luck. Don't short any alt coin, wait for btc to retrace these levels and open long for swing setups, will share some good gems, after confirmation

SOL/USDT Intra day - Long IdeaBINANCE:SOLUSDT.P is showing a Bullish Divergence, if it breaks out, i am looking for longs :)

Drop to around 115300 at midnightAt midnight, BTC saw a significant pullback, dropping to around 115300. Currently fluctuating around this level, and we still maintain that it will stay in an upward trend during the daytime.

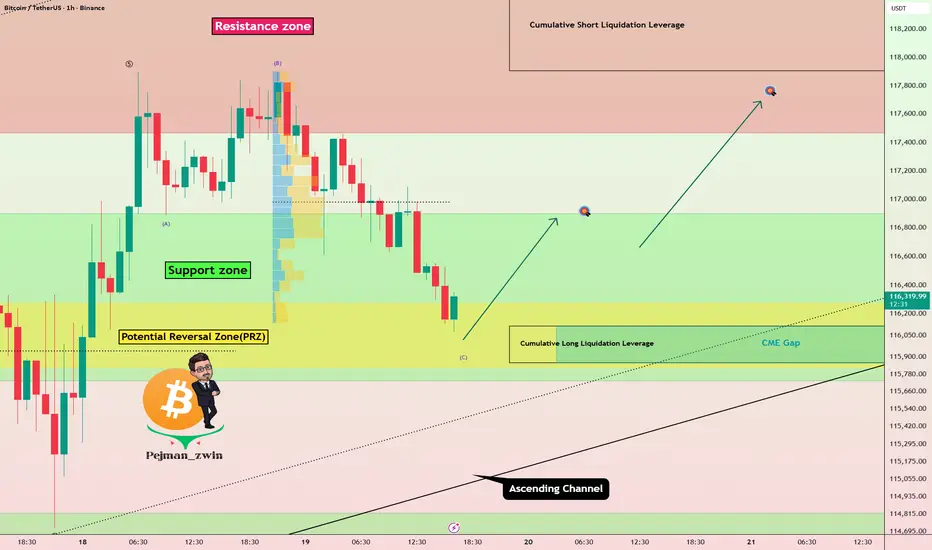
Key PRZ Ahead for Bitcoin – Bounce or Breakdown?Bitcoin ( BINANCE:BTCUSDT ) moved as I expected in my previous idea and rose to the Resistance zone($118,580-$117,460) .
First of all, let me say that this is a short-term Bitcoin analysis .
Bitcoin is filling the CME Gap($116,115-$115,860) and is moving near the Support zone($116,900-$115,730) [, Cumulative Long Liquidation Leverage($115,555-$114,424) , Potential Reversal Zone(PRZ) , and the lower line of the ascending channel .
In terms of Elliott Wave theory , Bitcoin appears to be completing a wave C of the Expanding Flat(ABC/3-3-5) .
I expect Bitcoin to rise to at least $116,910 if it even manages to break the ascending channel.
Second Target: $117,760
Stop Loss(SL): $$115,300
Cumulative Short Liquidation Leverage: $118,965-$117,906
Please respect each other's ideas and express them politely if you agree or disagree.
Bitcoin Analysis (BTCUSDT), 1-hour time frame.
Be sure to follow the updated ideas.
Do not forget to put a Stop loss for your positions (For every position you want to open).
Please follow your strategy and updates; this is just my Idea, and I will gladly see your ideas in this post.
Please do not forget the ✅' like '✅ button 🙏😊 & Share it with your friends; thanks, and Trade safe.
BTC Analysis TodayAs we’ve maintained all this time, BTC dipped to around 115500 at one point today and that was a great time to buy. Right after the pullback, it rebounded and started rising. the overall upward trend holds, and support level strong.
Buy 115000 - 115500
TP 116000 -116500 - 117000
Daily-updated accurate signals are at your disposal. If you run into any problems while trading, these signals serve as a reliable reference—don’t hesitate to use them! I truly hope they bring you significant assistance

Shorting before OctoberBTC showing signs of Breakdown, hoping to turn some more profit with BINANCE:BTCUSDT.P
BTCUSD 4H chartAs we mentioned yesterday, BTC dipped to around 115500 at one point today and that was a great time to buy. Right after the pullback, it rebounded and started rising. BTC is now trading between 115600–115700, but the overall upward trend holds, and support level strong.
Buy 115000 - 115500
TP 116000 -116500 - 117000
Daily-updated accurate signals are at your disposal. If you run into any problems while trading, these signals serve as a reliable reference—don’t hesitate to use them! I truly hope they bring you significant assistance

Nailed it! Accurate Prediction of BTCAs we accurately predicted on the 16th, BTC’s resistance level would be concentrated between the 117000 and 118000 and that is exactly what occurred. After advancing to around 117000, it pulled back; subsequently, it rebounded to near 118000 before retreating immediately.
Currently, the support level at 114400 remains solid, and the overall trend continues to be upward.
Buy 115500 - 116000
TP 116500 -117000 - 117500
Daily-updated accurate signals are at your disposal. If you run into any problems while trading, these signals serve as a reliable reference—don’t hesitate to use them! I truly hope they bring you significant assistance

BTC/USDT: Bullish Leap to 122K? As the previous analysis worked exactly as predicted, BINANCE:BTCUSDT is gearing up for a bullish move on the 4-hour chart , with an entry zone between 111750-113000 near a key support and rising trendline. 🎯
The target range at 122000 aligns with the next major resistance, signaling strong upside potential. Set a stop loss on a daily close below 110000 to manage risk effectively.
Attention: The price may not hit the red box and could move upward with momentum after touching the ascending trendline. Exercise caution in managing your capital.
📝 Trade Plan:
✅ Entry Zone: 111,750 – 113,000 (support + trendline area)
❌ Stop Loss: Daily close below 110,000 to manage risk
🎯 Target: 122,000 (next major resistance)
💡 Ready for this surge? Drop your take below! 👇

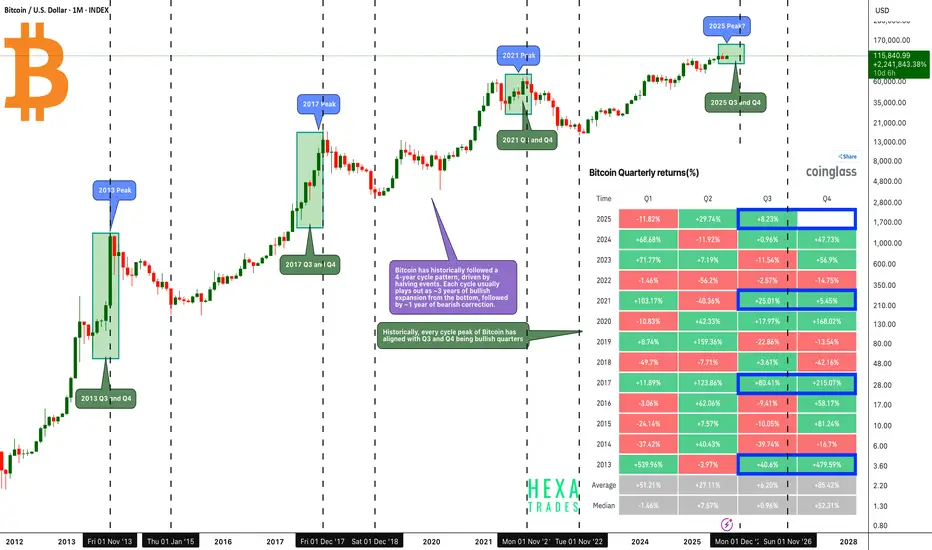
Bitcoin - Final Pump Before the Crash?Bitcoin has historically followed a 4-year cycle pattern, driven by halving events. Each cycle usually plays out as ~3 years of bullish expansion from the bottom, followed by ~1 year of bearish correction.
Historically, every cycle peak of Bitcoin has aligned with Q3 and Q4 being bullish quarters, making the second half of the year the most critical period for cycle tops.
Key Observations from Previous Cycle Peaks:
🔶 2013 Peak:
- Q3: +40.6%
- Q4: +479.59%
Strong acceleration into year-end marked the cycle top.
🔶 2017 Peak:
- Q3: +80.41%
- Q4: +215.07%
A similar explosive move as Bitcoin entered the mania phase.
🔶 2021 Peak:
- Q3: +25.01%
- Q4: +5.45% .
🔶 Current Cycle (2025 Peak?):
- Q3 2025 is already up +8.23% with 15 days remaining until the quarter ends.
- If history repeats, Q4 could be the blow-off phase where Bitcoin accelerates sharply to its peak.
🔶 Potential 2025 Target:
Bitcoin’s Q4 2025 peak could realistically reach the $140K–$160K range before entering the next corrective phase.
Conclusion: If Bitcoin follows its established 4-year cycle structure, we could be entering the final bullish leg of this cycle. History suggests Q3 and Q4 have the highest probability of producing outsized gains, with Q4 especially aligning with cycle peaks.
Cheers
Hexa
BINANCE:BTCUSDT CRYPTOCAP:BTC BITSTAMP:BTCUSD BINANCE:BTCUSDC