BTC: $115K Support Zone Under PressureBitcoin is currently testing the $115K support zone, and it's showing signs of breaking through. If this level doesn't hold, we could see a drop toward the next support around $110K-$112K. On the flip side, if CRYPTOCAP:BTC bounces back, it might target the $120K resistance zone.
Set a market alert for a break below $115K to track any major moves.
DYOR, NFA
BTCUSDTPERP

BTCUSDT Added Long positionBTCUSDT is in a critical zone now. could take a long side up to 118000 to grab the Liquadation zone. From there, we take a future position For nwo taking small risk of 1:2.2 reward

#BTC/USDT - Are the bulls looking for a liquidity grab?#BTC
The price is moving within a descending channel on the 1-hour frame, adhering well to it, and is heading for a strong breakout and retest.
We have a bearish trend on the RSI indicator that is about to be broken and retested, which supports the upward move.
There is a major support area in green at 115,000, which represents a strong support point.
We are heading for consolidation above the 100 moving average.
Entry price: 115,600.
First target: 116,215.
Second target: 117,000.
Third target: 117,900.
Don't forget a simple matter: capital management.
When you reach the first target, save some money and then change your stop-loss order to an entry order.
For inquiries, please leave a comment.
Thank you.

#BTC/USDT Breaks Resistance: Eyes on 117436 K#BTC
The price is moving within a descending channel on the 1-hour frame, adhering well to it, and is heading for a strong breakout and retest.
We have a bearish trend on the RSI indicator that is about to be broken and retested, which supports the upward move.
There is a major support area in green at 114400, which represents a strong support point.
For inquiries, please leave a comment.
We are in a consolidation trend above the 100 Moving Average.
Entry price: 114715
First target: 115650
Second target: 116518
Third target: 117436
Don't forget a simple matter: capital management.
When you reach the first target, save some money and then change your stop-loss order to an entry order.
For inquiries, please leave a comment.
Thank you.

BTCUSD – Key Levels & Outlook Bitcoin trades near $115,445 as mBitcoin trades near $115,445 as markets weigh the upcoming FOMC rate decision that could spark broad risk-asset moves.
Key Levels
Resistance (1H): $115,668 – 116,318. A clean breakout above this zone could open the door to $116,600+.
Intermediate Zone: $115,532 – 115,477 around the 30m FVG (fair value gap).
Support (1H): $115,100, with deeper bids around $114,744 – 114,376 and a final line near $114,134.
Scenarios
Bullish: A dovish Fed or rate-cut surprise could lift BTC through the 1H resistance toward $116,600–117,000.
Bearish: If the Fed stays hawkish or signals fewer cuts, watch for a slide toward $115,100 and potentially $114,700.
Fundamentals
The FOMC decision (8 pm UTC-2) is pivotal. A rate cut would generally weaken USD liquidity costs and may boost crypto demand.
Risk sentiment is key—BTC often mirrors equity volatility during major Fed events.
⚠️ Plan: Expect heightened volatility around the announcement; confirmation of direction likely comes after the Fed press conference.
This is market commentary, not financial advice.
Greetings,
MrYounity

#BTC is in heavy resistance, beware of a pullback📊#BTC is in heavy resistance, beware of a pullback ⚠️
🧠From a structural perspective, we've reached a significant resistance zone. It's also important to note that the CME gap near 116,600 has been filled, raising the possibility of a pullback.
➡️From a chart perspective, we're moving within an ascending channel. We encountered resistance at the upper edge of the channel and then fell back, so the support level to watch is near the lower edge.
⚠️Note that this week is the interest rate decision week, and expectations of a rate cut have already been released in advance. Be wary of "selling the news"!
Let's take a look 👀
🤜If you like my analysis, please like 💖 and share 💬 BITGET:BTCUSDT.P

BTC Eyes 120K but 115K Support is the Last LineCRYPTOCAP:BTC is currently trading around 116K after a strong run-up. The chart shows a rising wedge pattern forming, with immediate support sitting near 115K. If this level holds, BTC could make another push toward the upper resistance zone around 120K.
On the flip side, a breakdown below 115K may trigger a short-term correction, sending price lower before bulls step back in.
Overall, BTC is in a critical zone, holding support keeps the bullish momentum alive, but a rejection at resistance could slow things down.
DYOR, NFA
Stay tuned for more update

The 115854.56-119177.56 area is a resistance zone
Hello, fellow traders!
Follow us to get the latest information quickly.
Have a great day!
-------------------------------------
(BTCUSDT 1D chart)
Looking at the big picture, there are two important areas.
These are the 104463.99-18353.0 and 84814.27-93570.28 levels.
To continue the stepwise uptrend, an upward breakout of the 116259.91-119177.56 level is necessary.
The M-Signal indicator on the 1D and 1W charts is passing through the 108353.0-116259.91 level. If support is found in this area, the price is likely to continue attempting to break above the 116259.91-119177.56 level.
If the price declines to the 104463.99-18353.0 level and encounters resistance, it is expected to eventually encounter the M-Signal indicator on the 1M chart.
Currently, the M-Signal indicator on the 1M chart is moving between 84814.27 and 93570.28, so it's important to determine whether it can find support within this range.
--------------------------------------
Two OBV EMA lines have been added to the OBV indicator in the Low Line ~ High Line channel.
OBV EMA 1 can be used as a short-term indicator, EMA 2 as a medium-term indicator, and EMA 3 as a long-term indicator.
Disabling EMA 3 reveals that the OBV is currently above both EMA 1 and EMA 2, indicating a transition from EMA 1 to EMA 2.
If OBV rises above the High Line and remains above it, the price is likely to continue its upward trend.
Currently, the price has been trending upward as the OBV indicator has risen above the High Line, but with the High Line indicator re-emerging, it appears to be declining below the High Line.
However, as mentioned earlier, since the OBV indicator is holding above EMA 1 or EMA 2, the key is whether the current support and resistance zones hold support.
In other words, the key is whether support can be found and an upward movement can occur around the 115,854.56-116,259.91 range.
The 115,854.56 and 116,259.91 points are the HA-High indicator levels on the 1D and 1W charts.
Therefore, the current support and resistance zones should be considered resistance zones and a corresponding strategy should be developed.
The basic trading strategy is to buy between DOM(-60) and HA-Low and sell between HA-High and DOM(60).
However, if the price rises in the HA-High ~ DOM(60) range, it could exhibit a step-like upward trend, while if it falls in the DOM(-60) ~ HA-Low range, it could exhibit a step-like downward trend.
Therefore, the basic trading strategy should be a segmented trading strategy.
Therefore, those who bought near the DOM(-60) ~ HA-Low range should consider selling in segments.
If you want to make a new purchase, you can do so when the HA-High ~ DOM(60) range shows support. However, this requires a quick and short response, so caution is advised.
From a broader perspective, this means buying in a sell zone.
-
I believe whether the price will rise or fall in the future depends on whether it can break above Zone 1.
There's a possibility of a bear market turning around, with a new all-time high (ATH) occurring between the week of November 24th and the week of January 26th, 2026.
More details will likely emerge as this month progresses.
This month's volatility period will be around September 19th and September 28th.
-
Thank you for reading.
I wish you successful trading.
--------------------------------------------------
- This is an explanation of the big picture.
(3-year bull market, 1-year bear market pattern)
I will explain in more detail when the bear market begins.
------------------------------------------------------

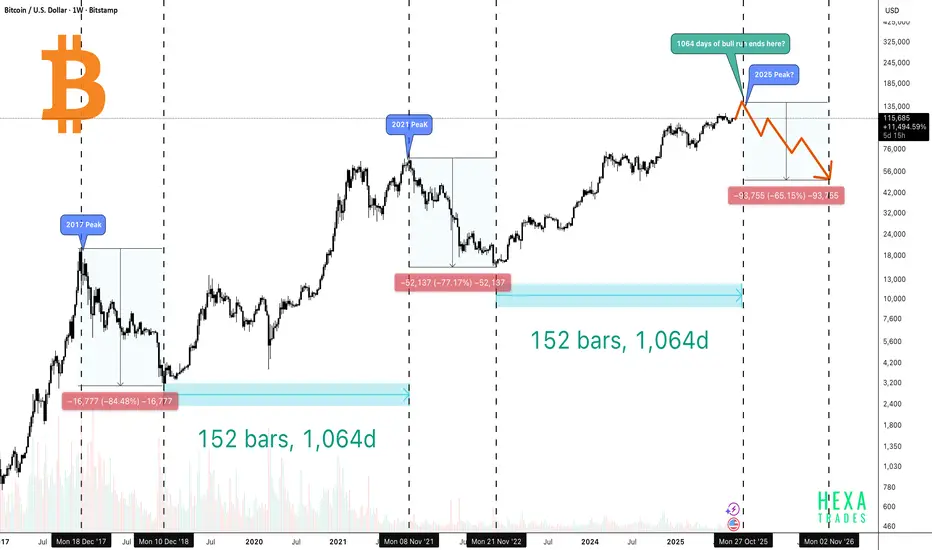
Bitcoin Peak Coming in 45 Days?The above chart compares Bitcoin’s previous market cycles (2017 and 2021) with its current trajectory in 2025, aiming to identify whether history might be repeating. It highlights how long Bitcoin’s bull runs last, how steep the crashes are afterward, and when the next peak and correction could happen.
🔶 2017 Peak
- Bitcoin topped out in December 2017.
- After the peak, BTC crashed by -84%, dropping from around $20K to nearly $3K.
- The bear market lasted about 1 year of decline, followed by roughly 1,065 days of bull run from the bottom before a new cycle peak.
🔶 2021 Peak
- Bitcoin peaked again in November 2021.
- Price fell by -77%, retracing from nearly $69K to about $15K.
- Similarly, the downturn lasted around 1 year of drop, and the recovery phase extended for about 1,065 days of bull run from the bottom.
🔶 2025 Peak?
- If the pattern repeats, the next top could align around late October 2025 and reach the $140K–$150K range.(1,064–1,065 days from the December 2022 bottom).
- In every cycle, Bitcoin’s crash percentage has decreased, suggesting the asset is maturing. If this pattern repeats, we could see a 60–70% drop, pushing the price back toward the $40K–$60K range.
Conclusion
Bitcoin’s historical cycles suggest a repeating rhythm of 1 year of decline followed by ~3 years of recovery and growth. Both the 2017 and 2021 cycles lasted about 1,065 days from bottom to top, with each new bull run setting higher all-time highs and each crash becoming less severe.
If this pattern continues, Bitcoin could potentially reach the $140K–$150K range by late October 2025, before facing another correction in the 60–70% range, possibly pulling the price back to the $40K–$60K zone.
While the market shows signs of maturity with institutional adoption and reduced crash percentages, history reminds us that sharp corrections often follow euphoric peaks. For long-term investors, the lesson remains clear: cycles repeat, but opportunities also return.
Today's BTCUSD Market AnalysisBTCUSD has shown little overall change compared to yesterday, with the broader market structure remaining intact. The support level remains firm, while esistance level continues to be concentrated in the 117,000–118,000
Buy 114500-115000
TP 115500-116500-117500
Daily-updated accurate signals are at your disposal. If you run into any problems while trading, these signals serve as a reliable reference—don’t hesitate to use them! I truly hope they bring you significant assistance

BTCUSD Market AnalysisObserving price movements, BTCUSD experienced a brief pullback lately after a wave of upward momentum, but the broader bullish structure stays intact. During this pullback, the underlying support proved effective, and the price subsequently rebounded. When it comes to upper resistance, the focus remains on the 117,000 to 118,000 interval.
Buy 114500-115000
TP 115500-116500-117500
Daily-updated accurate signals are at your disposal. If you run into any problems while trading, these signals serve as a reliable reference—don’t hesitate to use them! I truly hope they bring you significant assistance

High-level fluctuations, BTC short-term trading arrangements#BTCUSD
After BTC started to rise from 113500, it continued to fluctuate and consolidate at a high level, and is also waiting for the specific basis point of the Federal Reserve's interest rate cut. In the short term, BTC is experiencing a retracement. Aggressive traders can consider trying to arrange long orders at 115500-115000. Once it falls below 115000, SL is carried out in time, with the target looking at 116500-117500.

Daily Market Analysis of BTCUSDFrom the observation of price movements, recently, after a wave of rise, BTCUSD has experienced short-term pullback, but the overall bullish structure remains intact. During the pullback, the support below was effective, and then the price rose again.
For upper resistance, the focus remains on the 117,000–118,000 USD range.
Buy 114500-115000
TP 115500-116500-117500
Daily-updated accurate signals are at your disposal. If you run into any problems while trading, these signals serve as a reliable reference—don’t hesitate to use them! I truly hope they bring you significant assistance

#BTC/USDT options market is bullish.#BTC
The price is moving within a descending channel on the 1-hour frame and is expected to break and continue upward.
We have a trend to stabilize above the 100 moving average once again.
We have a downtrend on the RSI indicator that supports the upward break.
We have a support area at the lower boundary of the channel at 114650, acting as strong support from which the price can rebound.
We have a major support area in green that pushed the price upward at 114400.
Entry price: 115152.
First target: 115476.
Second target: 115990.
Third target: 116633.
To manage risk, don't forget stop loss and capital management.
When you reach the first target, save some profits and then change your stop order to an entry order.
For inquiries, please comment.
Thank you.

PPI Shock Pushes Bitcoin Higher – Fake Pump Before Drop?Bitcoin ( BINANCE:BTCUSDT ) has been making high momentum Sharpe moves over the last few days , which has made it a little difficult to trade, which is why I am still sticking to my previous analysis , and this analysis is an update of targets and even new entry points .
Bitcoin is currently moving near the Resistance zone($114,720-$113,580) , Reversal Zone(PRZ) , Cumulative Short Liquidation Leverage($114,510-$113,771) , Monthly Pivot Point , and Resistance lines = a set of Resistances
A few minutes ago, the US Core PPI m/m and PPI m/m data were released, which triggered a pump in Bitcoin . In my view, we should wait for Bitcoin to digest this shock and then continue its real trend .
Do you agree with me?
In terms of Elliott Wave theory , it seems that Bitcoin has completed microwave 5 of microwave C of the main wave Y , and we can expect a downtrend .
I expect Bitcoin to drop again to at least $111,600(First Target) .
Second Target: $110,883
Third Target: $110,000 and more dumps.
Stop Loss(SL): $114,923(Worst)
CME Gap: $117,235-$113,800
Cumulative Long Liquidation Leverage: $110,822-$109,752
Note: Be sure to follow capital management and do not take risks.
Please respect each other's ideas and express them politely if you agree or disagree.
Bitcoin Analysis (BTCUSDT), 1-hour time frame.
Be sure to follow the updated ideas.
Do not forget to put a Stop loss for your positions (For every position you want to open).
Please follow your strategy and updates; this is just my Idea, and I will gladly see your ideas in this post.
Please do not forget the ✅' like '✅ button 🙏😊 & Share it with your friends; thanks, and Trade safe.

Precise Prediction and Forecast for BTCUSD MarketYesterday, we accurately predicted that BTC would rally to around 116,000 USD and face certain resistance. Today, after breaking through 116,000 USD as expected, the price retraced to hover around 115,000 USD.
Looking ahead, if BTC can stabilize near the 115,000 USD level, it is highly likely to continue its upward trajectory, with the potential to retest the 120,000 USD mark. For upper resistance, the focus remains on the 117,000–118,000 USD range
Buy 114000-114500
TP 115000-116000-1175000
Daily-updated accurate signals are at your disposal. If you run into any problems while trading, these signals serve as a reliable reference—don’t hesitate to use them! I truly hope they bring you significant assistance

BTCUSD 4-Hour Chart AnalysisLooking at the BTCUSD 4-hour chart, the price has recently exhibited a dynamic trend. After a prior upward movement, it underwent a pullback. Now, it has found solid support at the 112,500 level. This support zone appears reliable, as the price has stabilized above it, indicating that buying interest has emerged here to prevent further declines.
In terms of resistance, the 116,000 level is a key hurdle to watch. If the price can successfully break through 116,000 with strong momentum, it would open the door to further upside potential. Before that, the 115,000 level could act as a near-term resistance to test the bulls' strength.
For traders, the strategy could be to monitor the price action around the 112,500 support. If the support holds and there are signs of a bullish reversal , it may be an opportunity to consider long positions with a target towards 115,000 and then 116,000. Conversely, a breakdown below 112,500 would shift the bias to the downside, with the next support level to watch at 110,640
Overall, the near-term trend hinges on the price's interaction with the 112,500 support and the subsequent attempt to challenge the 115,000 - 116,000 resistance zone.
Buy 112500 - 113500
TP 114500 - 115500 - 116000
Daily-updated accurate signals are at your disposal. If you run into any problems while trading, these signals serve as a reliable reference—don’t hesitate to use them! I truly hope they bring you significant assistance

BTC/USDT: Bitcoin Surge to 118K?🚀 BINANCE:BTCUSDT is shaping up for a bullish move on the 4-hour chart , with an entry zone between 109000-110000 near a key support and rising trendline.
🎯 First target at 113500 marks initial resistance, second at 114500 , and a third at 118000 could signal a major breakout! 📈 Set a stop loss on a 4hours close below 107240 to manage risk.
🌟 A break above 110500 with strong volume could trigger this rally, driven by market sentiment and whale activity. Watch BTC dominance! 💡 Ready for this lift-off? Drop your take below! 👇
📝 Trade Plan:
✅ Entry Zone: 109,000 – 110,000 (support)
❌ Stop Loss: close below 107,240 to manage risk
🎯 Target 1: 113,500 (first resistance)
🎯 Target 2: 114,500 (secondary resistance)
🎯 Target 3: 118,000 (final target)

BTCUSD 4-Hour Chart Analysis
In terms of resistance, the 116,000 level is a key hurdle to watch. If the price can successfully break through 116,000 with strong momentum, it would open the door to further upside potential. Before that, the 115,000 level could act as a near-term resistance to test the bulls' strength.
For traders, the strategy could be to monitor the price action around the 112,500 support. If the support holds and there are signs of a bullish reversal , it may be an opportunity to consider long positions with a target towards 115,000 and then 116,000. Conversely, a breakdown below 112,500 would shift the bias to the downside, with the next support level to watch at 110,640
Overall, the near-term trend hinges on the price's interaction with the 112,500 support and the subsequent attempt to challenge the 115,000 - 116,000 resistance zone.
Buy 112500 - 113500
TP 114500 - 115500 - 116000
Daily-updated accurate signals are at your disposal. If you run into any problems while trading, these signals serve as a reliable reference—don’t hesitate to use them! I truly hope they bring you significant assistance

BTC forms an ascending triangle, 113000 is just the beginningBITSTAMP:BTCUSD BTC saw a slight rise during the day. From the hourly and 4H charts, the MACD technical indicator formed a golden cross and broke through the upper short-term pressure of 113000. The short-term trend formed an ascending triangle. Bold and aggressive investors can rely on 113500-112000 to go long, with the target looking at 115500-116500.
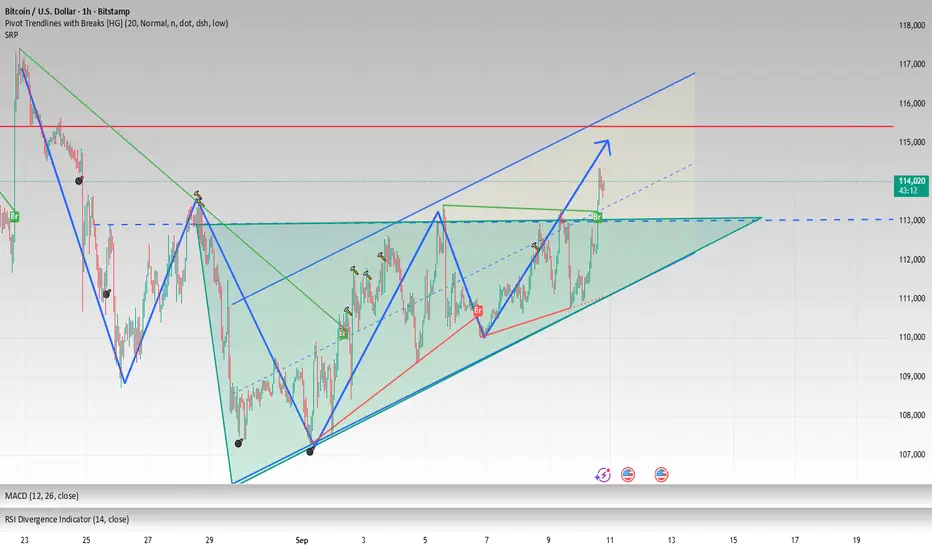
BTC – Bullish Head & Shoulders Pattern!Bitcoin is currently showing signs of a bullish inverse head & shoulders pattern on the 4H chart. This setup is typically a reversal signal, suggesting potential upside if the neckline resistance is broken.
Key Highlights:
- Left Shoulder, Head, Right Shoulder formation is clearly visible.
- Neckline Resistance: Around $113,500 – a breakout above this level could confirm the pattern.
- Potential Upside: If confirmed, BTC could see a strong move toward higher resistance zones.
- Volume Watch: A breakout backed by strong volume would add conviction.
Cheers
Hexa
CRYPTOCAP:BTC BITSTAMP:BTCUSD BINANCE:BTCUSDT

MSTR 1D Time frameMarket Snapshot
Current Price: ~$328.50
Daily Change: -0.4% (approx)
Technical Overview
Indicators & Momentum
RSI (14-day): ~40 → Neutral, slightly below the midpoint—no major squeeze yet.
MACD: Negative (~–1.6) → Weak bearish momentum.
Stochastic Oscillator: Around 31 → Neutral to slightly oversold.
Stochastic RSI: Overbought zone → Possible short-term exhaustion.
Williams %R: ~–39 → Suggests room for both upside and downside.
ADX: ~18–26 → Indicates a weak to moderate trend—market lacks strong direction.
Moving Averages
Short-term moving averages (like 5-day and 10-day) show buy signals, while broader averages—including the 20-day, 50-day, 100-day, and 200-day—are all negative, suggesting broader downward pressure.
Support & Resistance
Based on various pivot point analyses:
Immediate Support: ~$324–325
Near-term Support Zone: ~$320
Immediate Resistance: ~$332–334
Further Resistance: ~$340–345
Broader Technical & Market Context
Downtrend in Play: The stock has declined nearly 40% from its July highs and is approaching its lowest levels since April.
Death Cross Forming: The 50-day moving average is nearing a bearish crossover below the 200-day average.
Diving Technical Ratings: Most moving averages and oscillators point to a negative bias—short-term signals are weak, and longs are retreating.
Bullish Divergence? Some chart setups hint at a potential wedge or triangle pattern with possible bullish divergence, but these are speculative and not yet confirmed.
MicroStrategy remains under pressure, with indicators pointing overwhelmingly to neutral or bearish signals. While short-term moving averages show minor support, the broader technical picture remains weak—and a breakout above ~$334 would be needed to suggest a reversal.

$100K Remains the Critical Psychological Level for BTCCRYPTOCAP:BTC just broke below a key trendline, showing weakness in momentum. The zone that once acted as support has now flipped into resistance, which explains why price is struggling to push higher.
At the same time, there’s a strong demand zone and a big psychological level sitting around $100K. If price pulls back deeper, that’s where buyers are most likely to step in aggressively.
Right now, BTC is consolidating inside a small upward channel. A breakout from this channel will decide the next move, either reclaiming resistance or retesting that $100K demand area.
DYOR, NFA
Stay tuned for more updates
