#BTC is in a complex consolidation phase 📊 #BTC is in a complex consolidation phase ☕️
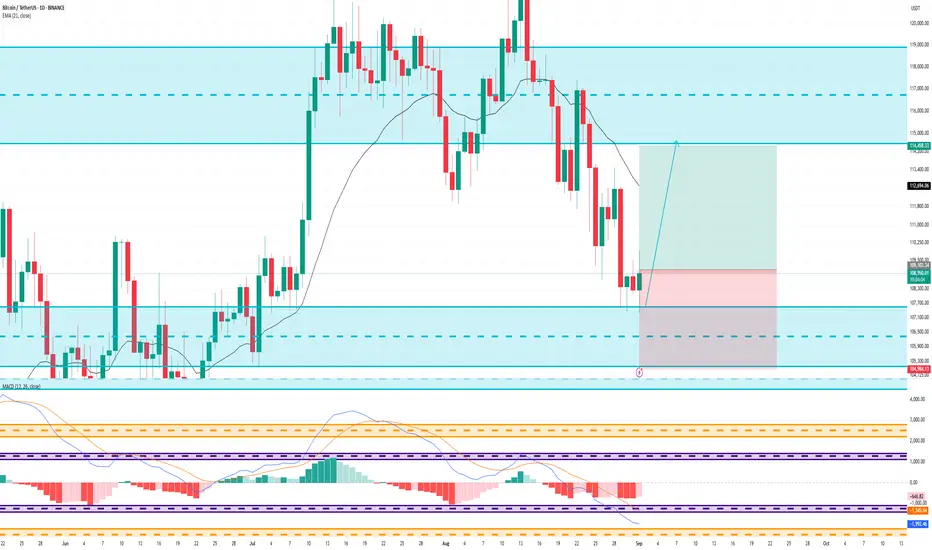
🧠From a structural perspective, we've rebounded after hitting the yellow support zone and are currently testing resistance near 113,000. We remain optimistic only if this resistance is broken and price stabilizes above the blue neckline. If this happens, we could attempt to challenge resistance near 120,000.
➡️If we break below the yellow uptrend support line, we'll need to focus on support near 108,200.
⚠️Complex consolidation phases are suitable for swing traders, so trend traders should either take a break or avoid being too greedy.
Let's see 👀
🤜If you like my analysis, please like 💖 and share 💬
BITGET:BTCUSDT.P
BTCUSDTPERP

Bitcoin Roadmap – Breakdown Toward $107K or Bounce?Bitcoin ( BINANCE:BTCUSDT ) has been moving with high momentum this week , with the US indexes and Gold ( OANDA:XAUUSD ) bullish .
Bitcoin is currently trying to break the Support lines , Support zone($110,920-$110,200) and 100_EMA(Daily) .
In terms of Elliott Wave theory , it seems that the waves that Bitcoin has made this week have been in the form of a Triple Three Correction(WXYXZ) .
I expect Bitcoin to decline to at least $109,133(First Target) AFTER the Supports are broken.
Second Target: $107,740
Third Target: $106,660
Stop Loss(SL): $114,108(Worst)
Note: As I said at the beginning of this analysis, the financial markets have been a bit emotional and sudden with their movements this week, so always be prepared for any scenario and pay more attention to capital management.
Note: Generally, trading volume is low on Saturdays and Sundays. Perhaps it is a bit far-fetched to expect a break of the Heavy Support zone($111,980-$105,820) during the weekend. What do you think?
Cumulative Short Liquidation Leverage: $114,976-$113,440
Cumulative Short Liquidation Leverage: $111,907-$111,607
Cumulative Long Liquidation Leverage: $109,346-$108,259
Cumulative Long Liquidation Leverage: $107,181-$106,479
CME Gap: $117,235-$113,800
Please respect each other's ideas and express them politely if you agree or disagree.
Bitcoin Analysis (BTCUSDT), 1-hour time frame.
Be sure to follow the updated ideas.
Do not forget to put a Stop loss for your positions (For every position you want to open).
Please follow your strategy and updates; this is just my Idea, and I will gladly see your ideas in this post.
Please do not forget the ✅' like '✅ button 🙏😊 & Share it with your friends; thanks, and Trade safe.

Bitcoin Rally Entering Final Stages!Bitcoin Bull Cycle Analysis:
Historically, Bitcoin has moved in clearly defined market cycles, each lasting roughly 1,064–1,065 days (about 3 years) from bottom to peak, followed by a sharp correction.
2013–2017 Cycle
🔶Bitcoin bottomed in early 2015 and then entered a strong bull run.
🔶Over the next 1,064 days, Bitcoin surged by more than 12,000%, ultimately peaking in late 2017.
🔶After the peak, Bitcoin experienced an 84% decline over the following year, entering a prolonged bear market.
2017–2021 Cycle
🔶From the December 2018 bottom, Bitcoin again began a long bull phase.
🔶In the next 1,064 days, Bitcoin gained over 2,000%, reaching a new all-time high in late 2021.
🔶Similar to the previous cycle, the market corrected sharply, with Bitcoin losing around 76% of its value within a year.
2021–2025 Cycle (Current)
🔶The most recent bottom was recorded in late 2022. Since then, Bitcoin has been in a sustained uptrend.
🔶As of today, the cycle has lasted 1,000+ days, during which Bitcoin has appreciated by roughly 675%.
🔶If the historical pattern continues, this bull run may have about two months left before reaching a cycle peak.
🔶Afterward, the market could undergo a significant correction, potentially in the range of 60–70%, though smaller than previous drops.
Conclusion : Bitcoin’s market history shows a repeating cycle of multi-year bull runs followed by sharp corrections. While past performance does not guarantee future results, the consistency in cycle length and the pattern of diminishing corrections suggest that Bitcoin may soon approach its next major peak. If the trend holds, a significant pullback of 60–70% could follow, offering both risks for late entrants and opportunities for long-term investors. This highlights the importance of caution, disciplined risk management, and strategic planning as we near the potential end of the 2021–2025 bull cycle.

ETH: Clear Move DownOn September 1, the Ethereum market turned downward on the 1-hour timeframe around the $4,444 zone. The move was sharp: price broke through several key levels and reached $4,261, giving a maximum difference of about $183 per coin. By the time the trade was closed, the third target had been reached, and the result was fully realized.
The essence lies not only in profit, but in how the trade was managed. The algorithm step by step highlighted profit-taking zones, enabled a shift to breakeven, and protected capital from emotional mistakes. This transformed trading such a volatile asset into a structured process where every step was clear in advance.
The market will always throw challenges. But when management is built on an algorithmic approach, trading stops being a guessing game and becomes a systematic strategy."

Bitcoin Crash Incoming?Bitcoin Cycle Analysis – Are We Nearing the 2025 Peak?
The above chart highlights Bitcoin’s historical market cycles, which have shown a remarkable pattern of consistency over the past decade. Each bull cycle has lasted roughly 1,064 days from the cycle bottom to the cycle peak, followed by a sharp correction phase.
Historical Cycles
- 2013 Peak → After the 2011–2012 bottom, Bitcoin rallied for ~1,064 days before peaking in late 2013. This was followed by a deep bear market.
- 2017 Peak → From the 2015 bottom, Bitcoin surged over 12,000% in ~1,064 days, peaking in December 2017 before dropping 84%.
- 2021 Peak → From the December 2018 bottom, Bitcoin rallied for 1,064 days again, gaining over 2,000% and peaking in late 2021. The following year saw a 76% correction.
Current Cycle (2021–2025)
- The most recent bottom was established in late 2022, marking the start of the current cycle.
- We are now over 1,000 days into this bull run, and Bitcoin has gained approximately 675% so far.
- If the historical cycle length repeats, the 2025 peak could occur around late October 2025.
Price Projection Based on Curved Support & Resistance
- Bitcoin’s price action has respected a curved support–resistance channel across the past three cycles.
- If the same pattern continues, the current cycle could see Bitcoin touch the curved resistance around the $130K–$140K level in October 2025.
- Historically, October has been a bullish month for Bitcoin, with strong momentum in previous cycles. Notably, in October 2021, Bitcoin printed a powerful bullish candle that led to the cycle peak.
- If history repeats, we could see a similar October rally in 2025, potentially marking the cycle top.
After the peak, a correction in the range of 60–70% is expected, consistent with the pattern of diminishing drawdowns (84% → 76% → projected 60–70%). This would place the potential next cycle bottom in the $50K–$60K range.
Conclusion
Bitcoin is nearing the end of its 2021–2025 bull cycle, with a potential peak around $130K–$140K in October 2025. Historically, October has been a bullish month, and past cycles suggest a 60–70% correction could follow, likely bringing prices back to the $50K–$60K range. With diminishing corrections each cycle, the market shows signs of maturity, but caution and risk management remain essential as we approach the cycle top.
Cheers
Hexa
CRYPTOCAP:BTC BINANCE:BTCUSDT BITSTAMP:BTCUSD

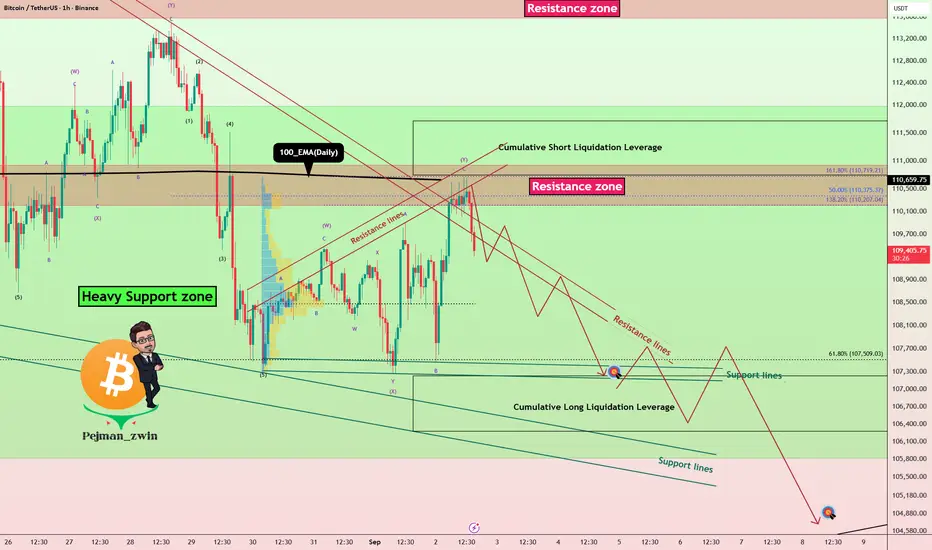
Bitcoin’s Heavy Support Zone Under Attack–Will It Finally Break?Bitcoin ( BINANCE:BTCUSDT ) currently appears to have completed its pullback to the 100_EMA(Daily) , and Bitcoin has failed to break the Resistance lines with high momentum. The Resistance zone($110,920-$110,200) , Resistance lines , and Cumulative Short Liquidation Leverage($111,711-$110,745) could prevent Bitcoin from rising.
In terms of Elliott Wave theory , Bitcoin appears to have completed the wave Y of the Double Three Correction(WXY) .
I expect Bitcoin to decline at least to the Support lines and Cumulative Long Liquidation Leverage($107,230-$106,277) . And there is a possibility that Bitcoin will eventually break the Heavy Support zone($111,980-$105,820) in this attack .
Do you think Bitcoin can finally break the Heavy Support zone($111,980-$105,820)?
CME Gap: $117,235-$113,800
Stop Loss(SL): $111,880(Worst)
Please respect each other's ideas and express them politely if you agree or disagree.
Bitcoin Analyze (BTCUSDT), 1-hour time frame.
Be sure to follow the updated ideas.
Do not forget to put a Stop loss for your positions (For every position you want to open).
Please follow your strategy and updates; this is just my Idea, and I will gladly see your ideas in this post.
Please do not forget the ✅' like '✅ button 🙏😊 & Share it with your friends; thanks, and Trade safe.
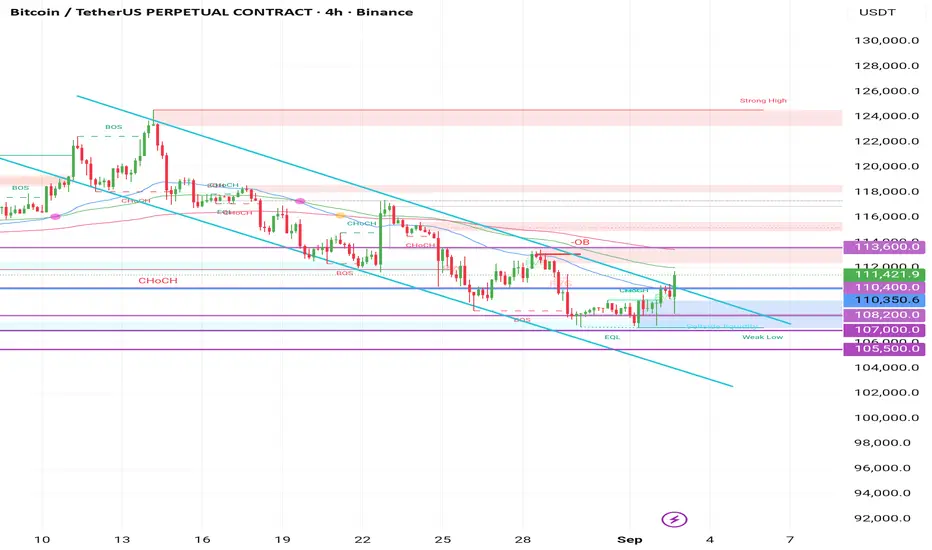
Bitcoin 4H – Key Test at 112,000Bitcoin is trading around 110,500, approaching the 112,000 – 113,600 resistance zone inside the descending channel.
Support: 110,400 – 108,200 – 107,000
Resistance: 112,000 – 113,600
📈 Break and hold above 113,600 could target 115,000 – 117,000.
📉 Rejection here may send price back toward 110,400 – 108,200.

NFP Jobs Data Could Trigger $116K or $105K Bitcoin MoveBitcoin is testing a critical breakout above $112,168 as markets prepare for tomorrow’s Non-Farm Payrolls report. The 4-hour chart has shown positive momentum, with BTC clearing resistance at $110,918 and pushing toward $112,856. If bulls can hold above $112K, the roadmap opens to $114,189 and $116,072. But if Bitcoin loses momentum, supports sit at $110,918, $108,592, and the deeper zone near $105,320.
The jobs report could be the catalyst that decides Bitcoin’s next big move. Consensus is around 75,000 jobs, just above last month’s 73,000. A weaker report could boost risk assets like Bitcoin as traders price in more Fed cuts. But a stronger print could cool risk sentiment and pressure BTC back into support. Either way, volatility is coming, and these levels will be key.

Bitcoin 4H Update – Rejection from 112,000, Back to Support ZoneBitcoin faced rejection from the 112,000 resistance area and dropped back below 110,400, now trading around 109,500 inside the descending channel.
🔑 Key Levels:
Support: 109,000 – 108,200 – 107,000 – 105,500
Resistance: 110,400 – 112,000 – 113,600
📉 Trend:
The broader structure remains bearish. The recent bounce from 107,000 – 108,200 looks like a corrective move that failed to break out of the channel.
🎯 Scenarios:
📈 If Bitcoin reclaims 110,400 and holds, it may attempt another test of 112,000 – 113,600.
📉 Continued rejection keeps pressure on supports, with the risk of retesting 108,200 – 107,000.
✨ Update Note:
The rejection from resistance confirms sellers are still in control. Watch the reaction at 109,000 – 108,200 for the next move.

Check for support near 111696.21
Hello, traders!
Follow us to get the latest information quickly.
Have a great day!
-------------------------------------
(BTCUSDT 1D chart)
The TC (Trend Check) indicator appears to have risen above the 0 level.
Accordingly, the key question is whether support can be found around 111696.21.
For the uptrend to continue, the OBV indicator must rise above the High Line and remain so.
-
The volatility period in September is expected to occur around September 9th, September 19th, and September 28th.
-
Thank you for reading.
I wish you successful trading.
--------------------------------------------------
- This is an explanation of the big picture.
(3-year bull market, 1-year bear market pattern)
I will explain in more detail when the bear market begins.
------------------------------------------------------

#BTC/USDT Bullish Divergence on 1H, Low Risk Trade#BTC
The price is moving within a descending channel on the 1-hour frame, adhering well to it, and is poised to break it strongly upwards and retest it.
We have a bearish trend on the RSI indicator that is about to be broken and retested, supporting the upside.
There is a major support area in green at 108062, which represents a strong basis for the upside.
For inquiries, please leave a comment.
We are in a consolidation trend above the 100 Moving Average.
Entry price: 108450
First target: 108959
Second target: 109541
Third target: 110325
Don't forget a simple matter: capital management.
When you reach the first target, save some money and then change your stop-loss order to an entry order.
For inquiries, please leave a comment.
Thank you.

BTC Macro Top or Supercycle Ahead?Bitcoin’s long-term price action, alongside the monthly RSI, shows a repeating pattern at major cycle tops. Historically, whenever the RSI reached the descending resistance trendline (Above 85 level) , Bitcoin entered a cycle peak followed by a correction.
Currently, the RSI is once again approaching this key level, raising the question of whether history will repeat or if BTC can finally break through this long-term resistance.
Historical Pattern:
🔷 2013: RSI touched the upper trendline → BTC entered a cycle peak, followed by a deep correction.
🔷 2017: Once again, RSI hit the resistance → marked the bull market top.
🔷 2021: RSI faced rejection at the same line → led to a prolonged bear market.
Now, in 2025–2026, RSI is climbing back toward this resistance level, and the big question remains: Will Bitcoin break the cycle, or repeat history?
Key Points:
🔶 CRYPTOCAP:BTC has respected this RSI downtrend at previous market cycle tops (2013, 2017, 2021).
🔶 Price is trading near all-time highs while RSI nears historical resistance.
🔶 A breakout above this RSI trendline could signal a new phase of strength.
🔶 A rejection would suggest another cyclical cooling phase.
Conclusion
Bitcoin is at a macro decision point. For over a decade, this RSI trendline has defined cycle tops. A confirmed breakout would mark a historic shift in BTC’s market structure, while another rejection could mean history repeats.
Cheers
Hexa
BITSTAMP:BTCUSD BINANCE:BTCUSDT BINANCE:BTCUSDC

Bitcoin (BTC/USDT) Trade Setup🚀 BINANCE:BTCUSDT Trade Setup 🚀
📉 After a sustained downtrend inside a parallel channel, BTC has finally broken out with bullish momentum. Currently, price is hovering around the 111K zone.
🔑 Key Levels:
Support: Channel retest zone (110K – 109.5K)
Resistance: 113K – 114K
Next Major Target: 116K – 118K 🎯
⚡ Trading Plan:
If BTC successfully retests the channel breakout and flips the resistance into support ✅, we could see a massive upside move (potential Elliott Wave structure forming 🔄).
🔥 Confirmation of strength will come once BTC breaks & sustains above 113K with volume.
This could trigger a huge pump towards Wave 3 & Wave 5 targets 🚀💎
🛡️ Risk Management: Place SL below 109K support to protect against false breakouts.
📈 Summary:
BTC breakout + possible retest = high probability bullish setup 📉➡️📈.
Keep an eye on volume and channel validation before entering.

Bitcoin 4H Update – Testing the Channel ResistanceBitcoin bounced strongly from the 108,200 – 107,000 support zone and is now trading around 111,400, moving closer to the top of the descending channel.
🔑 Key Levels:
Support: 110,400 – 108,200 – 107,000 – 105,500
Resistance: 112,000 – 113,600
📉 Main Trend:
The overall structure is still bearish as long as price trades inside the descending channel.
🎯 Scenarios:
📈 A confirmed breakout above 112,000 – 113,600 would signal strength and open the way to 115,000 – 117,000.
📉 Rejection from this zone could send price back to 110,400 – 108,200.
✨ Update Note:
The market is at a decisive resistance area. Next move depends on whether Bitcoin can break the channel or gets rejected again.
Bitcoin 4H Update – Approaching the 110,400 ResistanceBitcoin bounced strongly from the 108,200 – 107,000 support zone and is now trading around 110,200 inside the descending channel.
🔹 Trend:
The overall bias is still bearish as long as price stays below 110,400 – 113,600.
This move looks like a short-term relief rally within the downtrend.
🔑 Key Levels:
Support: 108,200 – 107,000 – 105,500
Resistance: 110,400 – 112,300 – 113,600
🎯 Scenarios:
📈 If Bitcoin breaks and holds above 110,400, we may see continuation toward 112,300 – 113,600.
📉 Rejection at 110,400 could bring the price back to test 108,200 – 107,000.
✨ Recommendation:
The market is at a decisive level. Better to wait for a clear reaction at 110,400 before confirming direction.

BTC IdeaBTC has broken out of the falling channel after retesting the $108.5K demand zone and is now showing signs of strength above $110K.
If buyers shows strength, BTC can push higher towards $112,000 - $115,000. But if momentum weakens, it may fall back to test the demand zone again.

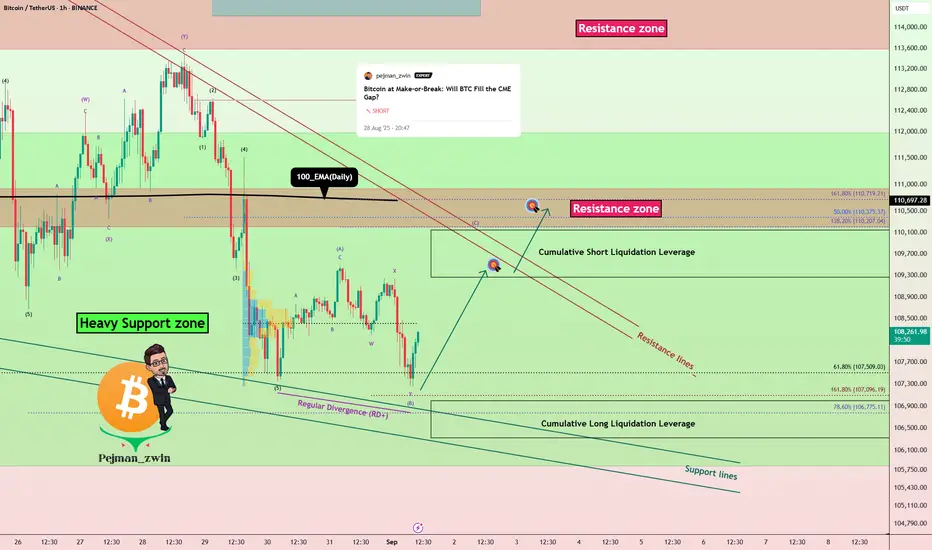
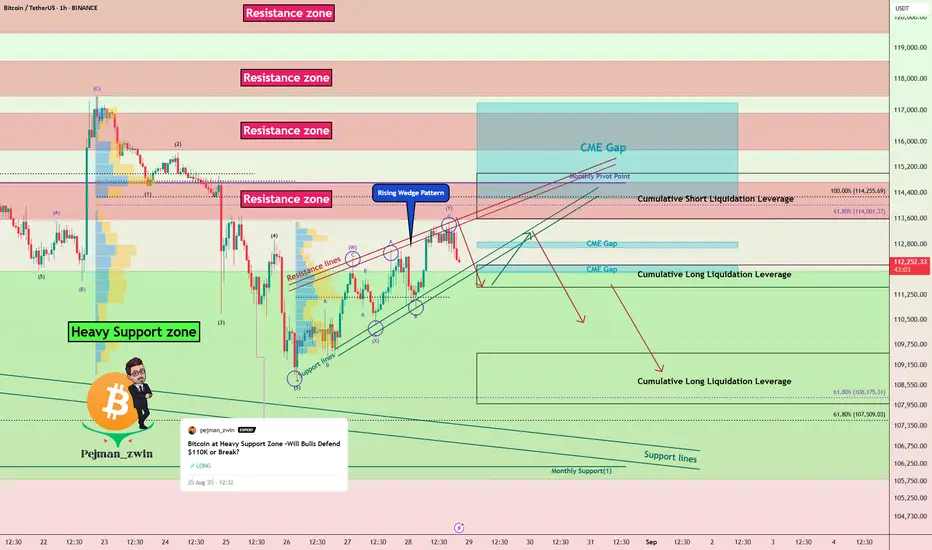
Bitcoin at Heavy Support – Will Bulls Defend or Break Below?Bitcoin ( BINANCE:BTCUSDT ) fell as I expected in my previous idea .
The question is, can Bitcoin break the Heavy Support zone($111,980-$105,820) ?
Bitcoin is currently trading in the lower areas of the Heavy Support zone($111,980-$105,820) and near the Support lines and Cumulative Long Liquidation Leverage($107,000-$106,330) .
In terms of Elliott Wave theory , it seems that Bitcoin has completed 5 downwaves at the support lines, and we should expect upward corrective waves . The corrective waves could follow the Expanding Flat(ABC/3-3-5) .
Also, we can see the Regular Divergence(RD+) between Consecutive Valleys.
I expect that if Bitcoin is going to break the Heavy Support zone($111,980-$105,820) , it will attack the Resistance zone($110,920-$110,200) and the Resistance lines first. Do you agree with me!?
Cumulative Short Liquidation Leverage: $110,147-$109,266
CME Gap: $117,235-$113,800
Stop Loss(SL): $105,600(Worst)
Please respect each other's ideas and express them politely if you agree or disagree.
Bitcoin Analyze (BTCUSDT), 1-hour time frame.
Be sure to follow the updated ideas.
Do not forget to put a Stop loss for your positions (For every position you want to open).
Please follow your strategy and updates; this is just my Idea, and I will gladly see your ideas in this post.
Please do not forget the ✅' like '✅ button 🙏😊 & Share it with your friends; thanks, and Trade safe.
BTCUSD Rejected its Daily Support and Ready For FlyHello Traders
In This Chart BTCUSD HOURLY Forex Forecast By FOREX PLANET
today BTCUSD analysis 👆
🟢This Chart includes_ BTCUSD market update)
🟢What is The Next Opportunity on BTCUSD Market
🟢how to Enter to the Valid Entry With Assurance Profit
This CHART is For Trader's that Want to Improve Their Technical Analysis Skills and Their Trading By Understanding How To Analyze The Market Using Multiple Timeframes and Understanding The Bigger Picture on the Charts

Bitcoin 4H – Downtrend Continues, Key Levels to WatchBitcoin is still trading inside a descending channel on the 4H timeframe, confirming the overall bearish trend.
🔹 Current Trend:
Price remains bearish as long as it’s trading below 110,400. Recent rejections from the channel top confirm sellers are still in control.
🔑 Key Levels:
Support: 108,200 – 107,000 – 105,500
Resistance: 110,400 – 112,300 – 113,600
🎯 Opportunities:
📉 Bearish scenario: A breakdown below 108,200 could accelerate the move toward 107,000 – 105,500.
📈 Bullish scenario: If price holds above 108,200 and reclaims 110,400, short-term relief may push towards 112,300 – 113,600.
✨ Recommendation:
Currently, the bias stays bearish unless Bitcoin breaks and holds above 110,400. Best to watch support reactions before entering new trades.

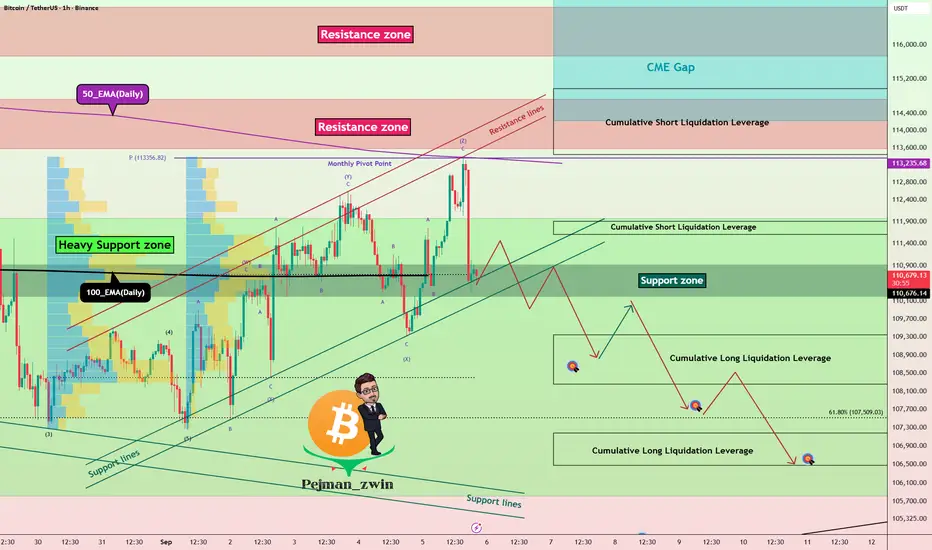
Bitcoin at Make-or-Break: Will BTC Fill the CME Gap?Bitcoin ( BINANCE:BTCUSDT ) increased to $113,500 as I expected in my previous idea .
Do you think Bitcoin can fill the upper CME Gap($117,235-$113,800) !?
Bitcoin is currently moving near the Resistance zone($114,720-$113,580) , Cumulative Short Liquidation Leverage($115,000-$113,588) , Resistance lines , and Monthly Pivot Point .
In terms of Elliott Wave theory , Bitcoin’s movement over the past 2 days has been in the form of corrective waves and has had low momentum . The corrective wave structure is a Double Three Correction(WXY) .
From a Classic Technical Analysis perspective, Bitcoin appears to be completing a Rising Wedge pattern .
I expect Bitcoin to move towards Cumulative Long Liquidation Leverage($109,500-$108,000) after volatile movements over the next two days .
CME Gap: $112,870-$112,700
CME Gap: $112,155-$111,940
Stop Loss(SL): $115,510(Worst)
Please respect each other's ideas and express them politely if you agree or disagree.
Bitcoin Analyze (BTCUSDT), 1-hour time frame.
Be sure to follow the updated ideas.
Do not forget to put a Stop loss for your positions (For every position you want to open).
Please follow your strategy and updates; this is just my Idea, and I will gladly see your ideas in this post.
Please do not forget the ✅' like '✅ button 🙏😊 & Share it with your friends; thanks, and Trade safe.
Bitcoin 4H – Key Support & Resistance LevelsKept the chart clean by focusing only on the main levels without overcomplicating it.
🔹 Support: 108,200 – 107,000 – 105,500
🔹 Resistance: 109,150 – 110,400 – 113,600
📉 Current Trend:
Bitcoin remains in a clear downtrend inside the descending channel on the 4H timeframe.
Momentum is still bearish as long as price trades below 110,400.
🎯 Opportunities:
Bullish scenario: A bounce from the 108,200 – 107,000 support zone could trigger a move towards 110,400 – 113,600.
Bearish scenario: A clean breakdown below 107,000 may open the way to deeper liquidity around 105,500 – 104,800.
Keeping it simple: watch support reaction before taking the next trade.
