Bitcoin (BTC/USDT) – 4H Chart Update !!Bitcoin (BTC/USDT) – 4H Chart Update
BTC is trading near $110,000 and respecting a descending trendline. The price is currently consolidating near support with RSI around 40, showing slight weakness.
Immediate Support → $109,456
Long-term Support → $98,376
Immediate Resistance → $112,935
Long-term Resistance → $122,879
Possible Scenarios:
Bullish Case (Long Setup):
A breakout above $112,935 could open doors to $116,818 → $120,001 → $122,879.
Long entry valid above breakout confirmation, SL below $109,456.
Bearish Case (Short Setup):
Failure to hold $109,456 could drag price down to $105,189 → $102,154 → $98,376.
Short entry valid below $109,456, SL above $112,935.
The market is at a critical decision zone – waiting for a breakout/rejection will give clearer direction.
DYOR | Not Financial Advice
BTCUSDTPERP

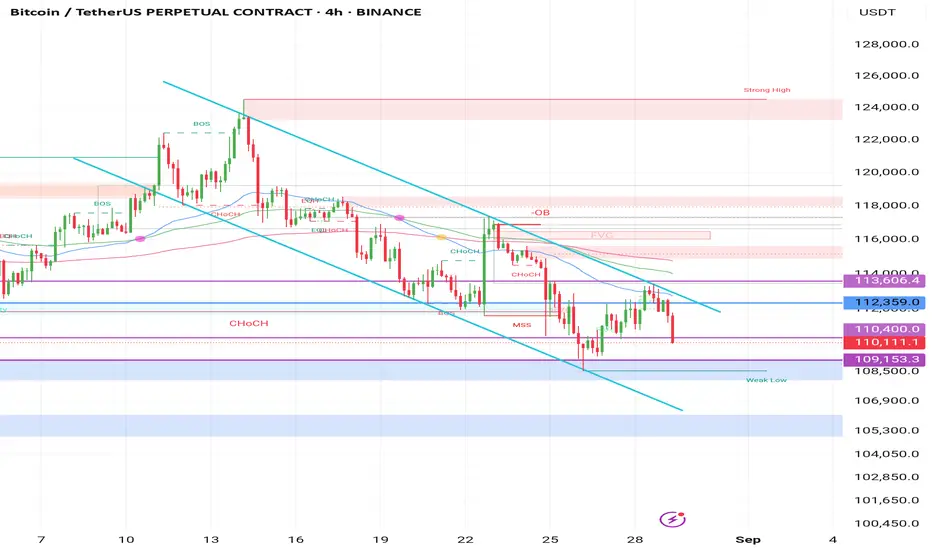
Bitcoin 4H Update – Testing Key Support Levels Inside the Bitcoin continues to respect the descending channel on the 4H chart.
After rejecting the upper boundary near 112,300 – 113,600, price dropped back towards the 110,400 – 109,150 support zone.
Holding above this area could trigger a short-term bounce, while a clear breakdown may open the way to deeper liquidity levels around 108,400 – 107,000.
I’ll be watching closely for reaction at these supports before confirming the next move.
Bitcoin at Heavy Support Zone –Will Bulls Defend $110K or Break?Bitcoin ( BINANCE:BTCUSDT ) rose to $114,400 and even higher, as I expected in my previous idea . Of course, Powell's words also played a significant role in this increase.
Bitcoin has started to decline after the rebound and is currently trading at a Heavy Support zone($111,980-$105,820) near the Potential Reversal Zone(PRZ) , Cumulative Long Liquidation Leverage($110,157-$109,000) , 100_EMA(Daily) , and Support lines .
The question is whether Bitcoin will manage to break the Heavy Support zone($111,980-$105,820) or will it start to rise again. What do you think?
In terms of Elliott Wave theory , Bitcoin appears to be completing microwave 5 of the downtrend waves the past two days . Microwave 5 could be completed at Potential Reversal Zone(PRZ) and Cumulative Long Liquidation Leverage($110,157-$109,000) .
Also, we can see the Regular Divergence(RD+) between Consecutive Valleys.
I expect Bitcoin to rise to at least $113,500 after entering the Potential Reversal Zone(PRZ) or hitting the Support lines . Market conditions may get a little emotional with the US market opening , so please observe money management.
Second Target: $114,517
Cumulative Long Liquidation Leverage: $108,000-$106,747 =Important
Cumulative Short Liquidation Leverage: $114,246-$113,326
Cumulative Short Liquidation Leverage: $117,939-$115,500
CME Gap: $117,235-$113,800
Stop Loss(SL): $108,670 /If your long position trigger was near the lower lines of the descending channel, it could be =Stop Loss(SL)=$106,417
Please respect each other's ideas and express them politely if you agree or disagree.
Bitcoin Analyze (BTCUSDT), 1-hour time frame.
Be sure to follow the updated ideas.
Do not forget to put a Stop loss for your positions (For every position you want to open).
Please follow your strategy and updates; this is just my Idea, and I will gladly see your ideas in this post.
Please do not forget the ✅' like '✅ button 🙏😊 & Share it with your friends; thanks, and Trade safe.

#BTC Expanding Wedge📊#BTC Expanding Wedge🚀
🧠From a structural perspective, we've hit weekly support and rebounded. Price is currently consolidating near the neckline resistance zone. If we can hold above the neckline resistance zone, resistance will turn into support, and we'll likely continue higher. The CME gap near 116,600 could also be filled.
➡️If we fail to hold above the neckline resistance zone, we'll need to be wary of the risk of a further pullback. The most noteworthy support zone is around 98,200.
➡️If we continue the bullish momentum, short-term resistance lies around 114,157, with extreme resistance around 118,000-120,000.
Let's see 👀
🤜If you like my analysis, please like 💖 and share 💬
BITGET:BTCUSDT.P

Bitcoin Above Support · 10X LONG · 416% Profits PotentialBitcoin is trading above support in the form of EMA144 daily. This is a very strong moving average focused on the long-term. When the action is happening above this level, the market is considered bullish.
Here BTCUSDT is safely trading above this line. The reading of EMA144 sits at $107,500. The low today reached $108,560.
The session today has a long lower wick and is already back-up, green. The day is not over but a bullish close is highly desirable, it would indicate the retrace is likely over.
Notice how the volume is very low and actually dropping. For the bearish size, on this chart, it has been dropping since December 2024.
The higher the leverage, the higher the risk. If you are unsure, lower it.
Are you in a mental rollercoaster?
An emotional one?
How to get out of this situation?
If you are using margin and you are having a hard time getting around your position, it only means one thing; your level of leverage is just too high. Instead of 20X, 30X or 10X, try 1-2X. If you can't do it, prepare to lose money long-term.
Start small and grow. You can't earn money fast if you can't earn money slow.
You won't be able to appreciate the big if you can't appreciate the small.
The market offers endless opportunities, take the time to grow and you will produce amazing results.
Your results are not based on good luck or timing, your results are a perfect reflection of your mentality, dedication and hard work.
Want to earn big with Crypto? Just go LONG.
Bitcoin is going up.
Full numbers below:
______
LONG BTCUSDT 10X (PP: 416%)
ENTRY: $102,000 - $111,000 (STOP: $99,000)
TARGETS: $122,000, $137,000, $155,600
______
Thank you for reading.
I am always wishing for you the best.
We can all have good times, bad times. We can all do right but we can also make mistakes.
Regardless of what you've done in the past, remember, you are a divine living being and will always deserve the best. We all deserve a second chance.
Thanks a lot for your continued support.
Namaste.

Powell's Speech Sparks Turmoil: BTC Surges and Pulls BackPowell's speech triggered a sharp surge in both BTC and gold 🚀. Amid such significant volatility, many traders will likely see their accounts wiped out 💥. BTC has pulled back today and may continue to drop to around 112,000 before rebounding ↘️↗️
⚡️⚡️⚡️ BTCUSD ⚡️⚡️⚡️
🚀 Sell@ 117000 - 11600
🚀 TP 115000 - 114000 - 113000
Daily updates bring you precise trading signals 📊 When you hit a snag in trading, these signals stand as your trustworthy compass 🧭 Don’t hesitate to take a look—sincerely hoping they’ll be a huge help to you 🌟 👇

Important range: 115854.56-119177.56
Hello, traders!
Follow us for quick updates.
Have a great day!
-------------------------------------
(BTCUSDT 1D chart)
This period of volatility is expected to last from August 23rd to 25th.
It found support near 111696.21 and rose above 115854.56.
Therefore, the key question is whether it can find support near 115854.56 and rise above 119177.56.
If it falls below 115854.56, it could fall to around 108353.0.
If it rises above 119177.56 this time and holds, it could attempt to rise near the right Fibonacci level 2.618 (133889.92) during the next volatility period, around September.
Therefore, we should watch for support in the HA-High ~ DOM (60) range of 115854.56-119177.56 and see if it rises above that level.
-
Looking at the OBV indicator of the Low Line ~ High Line channel, it appears to be transitioning into a downward channel.
Therefore, if the OBV indicator fails to rise above the High Line, there is a possibility of forming a short-term top.
-
Thank you for reading to the end.
I wish you successful trading.
--------------------------------------------------
- Here's an explanation of the big picture.
(3-year bull market, 1-year bear market pattern)
I will explain more in detail when the bear market begins.
------------------------------------------------------

Bitcoin 4H BullishBitcoin tapped into the liquidity at $111,881. There was strong support from the green trendlines, along with a bullish signal from a bullish divergence ✅. This pushed the market significantly higher.
News: Powell also added a positive impulse, helping the 4h candle close above 115k.
👉 As long as we remain within this range, the outlook stays bullish for next week.
👉 A possible re-entry for me is in the yellow box ($114,119), where a high-leverage long position is also placed.
👉 Our weekly close remains the key support for further upward movement.
Wishing you a great weekend! ✌️🚀"

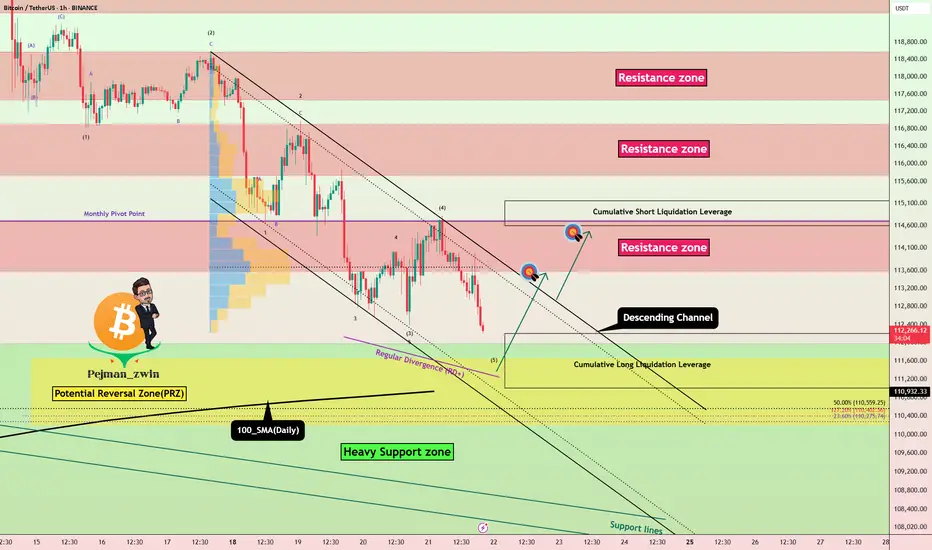
Bitcoin Long Setup: PRZ + Heavy Supports in Action!Bitcoin ( BINANCE:BTCUSDT ), as I expected in the previous idea , fell to at least $112,640 and is completing the second target (Full Target) .
Bitcoin is approaching the Heavy Support zone($111,980-$105,820) and 100_SMA(Daily) , Potential Reversal Zone(PRZ) , and Cumulative Long Liquidation Leverage($112,200-$111,000) , generally , heavy supports and resistances are NOT broken with the first attack , so I am publishing this analysis with the label ''LONG'' .
In terms of Elliott Wave theory , Bitcoin is completing a main wave 5 , as the main wave 3 was an extended wave .
Also, we can see the Regular Divergence(RD+) between Consecutive Valleys .
I expect Bitcoin to start rising from the Potential Reversal Zone(PRZ) and Cumulative Long Liquidation Leverage($112,200-$111,000) and increase to at least $113,617 .
Second Target: $114,391
Cumulative Short Liquidation Leverage: $115,157-$114,599
Note: Stop Loss(SL): $110,100
Please respect each other's ideas and express them politely if you agree or disagree.
Bitcoin Analyze (BTCUSDT), 1-hour time frame.
Be sure to follow the updated ideas.
Do not forget to put a Stop loss for your positions (For every position you want to open).
Please follow your strategy and updates; this is just my Idea, and I will gladly see your ideas in this post.
Please do not forget the ✅' like '✅ button 🙏😊 & Share it with your friends; thanks, and Trade safe.
#BTC is about to test support 📊#BTC is about to test support ⚠️
🧠From a structural perspective, the 8-hour support zone has been broken, turning into resistance. Optimism remains only if this zone is successfully broken and stabilized. Currently, the price is within the 12-hour support zone, and there has been no rapid test of the important support zone of 110,000-112,000. I believe the probability of a test of this support zone is still high, so please ensure proper risk management.
Let's see 👀
🤜If you like my analysis, please like 💖 and share 💬
BITGET:BTCUSDT.P

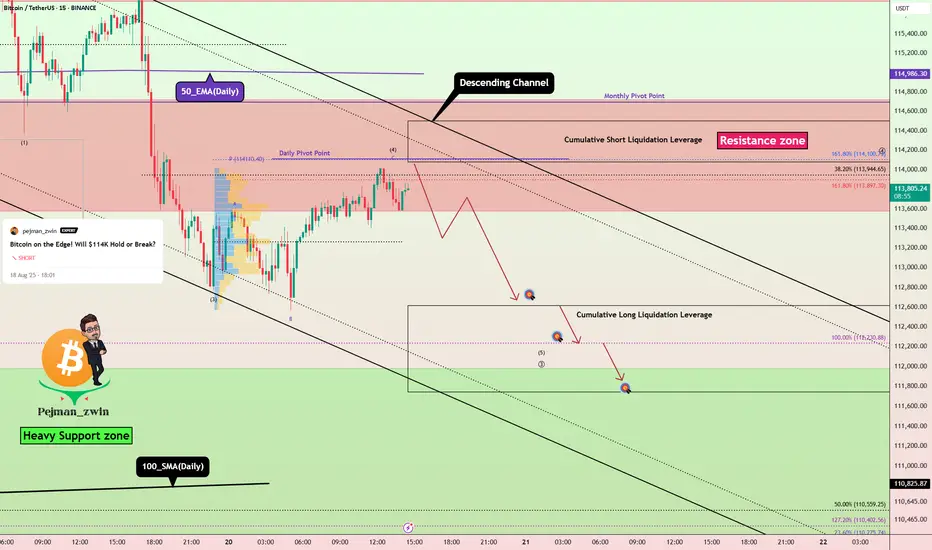
Bitcoin Short Setup _ Short-termBitcoin ( BINANCE:BTCUSDT ) has managed to break the Support zone($114,720-$113,570)/Now=Resistance zone and 50_EMA(Daily) , as I expected in the previous idea . And now it seems that Bitcoin is completing a pullback .
Also, on the 1-hour time frame , if you look closely, Bitcoin seems to be moving inside a descending channel .
In terms of Elliott wave theory , Bitcoin seems to be completing microwave 4 of the main wave 3 , so that microwave 4 could have an Expanding Flat structure(ABC/3-3-5) .
I expect Bitcoin to drop to at least $112,640 after completing the pullback ( microwave 4 of the main wave 3 ).
Second Target: $112,323
Cumulative Short Liquidation Leverage: $116,755-$115,778
Cumulative Short Liquidation Leverage: $114,500-$114,077
Cumulative Long Liquidation Leverage: $112,615-$111,743
Note: From today until Friday, important indexes will be released from the US, which can create excitement in financial markets, especially crypto, and even change the market trend when released.
Note: Most likely, after Bitcoin touches the Heavy Support zone($111,980-$105,820) and 100_SMA(Daily), we should wait for Bitcoin to bounce back (you might be able to look for a long position trigger in that zone).
Note: Stop Loss(SL): $114,823
Please respect each other's ideas and express them politely if you agree or disagree.
Bitcoin Analyze (BTCUSDT), 15-minute time frame.
Be sure to follow the updated ideas.
Do not forget to put a Stop loss for your positions (For every position you want to open).
Please follow your strategy and updates; this is just my Idea, and I will gladly see your ideas in this post.
Please do not forget the ✅' like '✅ button 🙏😊 & Share it with your friends; thanks, and Trade safe.
BTC — Sharp Drop: Signal Hit TP3
On August 14, the indicator on the 4H timeframe generated a clear short signal around the $118,000 zone. From the very first hours it became evident that the market could no longer handle the overheated conditions: momentum broke down sharply, and a rapid decline began.
The drop was intense and unfolded almost without pauses. The price quickly moved through the key levels, confirming the strength of the signal. TP1 and TP2 were hit in quick succession, and by August 21, the market reached TP3 at around $113,000. This move became one of the clearest confirmations of how fast the market can unwind built-up pressure in just a matter of days.
What’s important is that the signal still remains open. No clear reversal impulse has been seen, and sellers continue to hold control. The weak reaction from buyers at local support levels only increases the likelihood of further downside.
This current dynamic highlights a key lesson: when the market is overheated, corrections often come sharply and without warning. In such moments, a systematic approach is essential — entering on a valid signal and following the trade step by step toward predefined targets.
Bitcoin on the Edge! Will $114K Hold or Break?Bitcoin ( BINANCE:BTCUSDT ) started to decline from the Potential Reversal Zone(PRZ) as I expected in the previous idea .
Bitcoin currently appears to have managed to break the Support zone($116,900-$115,730) and is currently trading near the Support zone($114,720-$113,570) , 50_EMA(Daily) , Monthly Pivot Point , and Cumulative Long Liquidation Leverage($114,300-$113,841) .
In terms of Elliott Wave theory , it appears that Bitcoin is completing microwave 4 of the main wave 3 (probably), and we should expect a re-attack on the Support zone($114,720-$113,570) in the coming hours .
I expect Bitcoin to attack the Support zone($114,720-$113,570) at least once more after completing the pullback to the Support zone($116,900-$115,730) from Cumulative Short Liquidation Leverage($116,411-$115,760) and if it breaks , we should expect a drop to the Heavy Support zone($111,980-$105,820) .
Cumulative Short Liquidation Leverage: $120,115-$118,751
Note: Stop Loss(SL): $117,320
Please respect each other's ideas and express them politely if you agree or disagree.
Bitcoin Analyze (BTCUSDT), 1-hour time frame.
Be sure to follow the updated ideas.
Do not forget to put a Stop loss for your positions (For every position you want to open).
Please follow your strategy and updates; this is just my Idea, and I will gladly see your ideas in this post.
Please do not forget the ✅' like '✅ button 🙏😊 & Share it with your friends; thanks, and Trade safe.

#BTC is in support, be wary of a rebound📊 #BTC is in support, be wary of a rebound ⚠️
🧠From a structural perspective, we're currently in an overlapping support zone on the 8-hour chart, so we need to be wary of the risk of a rebound. Short-term resistance lies around 117,000-118,500. 120,000 is extreme resistance, and I believe it will be difficult to reach directly.
➡️If the rebound fails here, we'll need to focus on the 12-hour support level, around 112,000, which was also the starting point of the rally in early August.
Let's see 👀
🤜If you like my analysis, please like 💖 and share 💬 BITGET:BTCUSDT.P

Bitcoin Market Update – August 19, 2025: Key Levels to WatchDear Crypto Enthusiast,
As of August 19, 2025, here is your latest Bitcoin (BTC) market analysis to help you stay ahead in this dynamic market.
Bitcoin Price Overview
Bitcoin recently experienced a pullback from its mid-August highs around $124,000, settling near the critical support level of $115,000. This zone could act as a launching point for a potential rebound or signal further volatility depending on upcoming market dynamics.
What the Technicals Are Saying
Short-term bullish momentum is visible as BTC oscillates between $115,000–$117,500. A decisive close above this range would reinforce upward momentum.
Should BTC dip below $110,000, it might trigger deeper corrections in the near term.
Looking Ahead
August trading is expected to be volatile, with BTC price fluctuating roughly between $115,600 and $122,000.
Forecasts suggest an upward surge in September, possibly pushing Bitcoin prices up to $131,700.
Market Sentiment and Outlook
Post-correction rallying from $112,000 lows indicates renewed bullish interest, supported by rising activity on CME futures and strengthening institutional demand. As digital asset treasuries grow cautiously, the medium-term outlook for Bitcoin remains constructive.
What This Means for You
Monitor the $115,000 support closely; it’s pivotal for near-term trading strategies.
Watch for potential breakouts above $117,500 as confirmation of sustained buying pressure.
Stay alert to macroeconomic factors that can influence crypto markets overall.
Stay tuned with CryptosignalApp for real-time signals and expert market insights to capitalize on Bitcoin’s evolving trends.
Trade smart, trade informed.
Best regards,
The CryptosignalApp Team

BTC: Rebound Imminent, Go LongBTC today broke below 115000, then rebounded right away 📉→📈. The rebound will keep going and retest 120000—now’s a solid chance to go long! 🚀
⚡️⚡️⚡️ BTCUSD ⚡️⚡️⚡️
🚀 Buy@ 115000 - 115500
🚀 TP 117000 - 118000 - 119000
Daily updates bring you precise trading signals 📊 When you hit a snag in trading, these signals stand as your trustworthy compass 🧭 Don’t hesitate to take a look—sincerely hoping they’ll be a huge help to you 🌟 👇

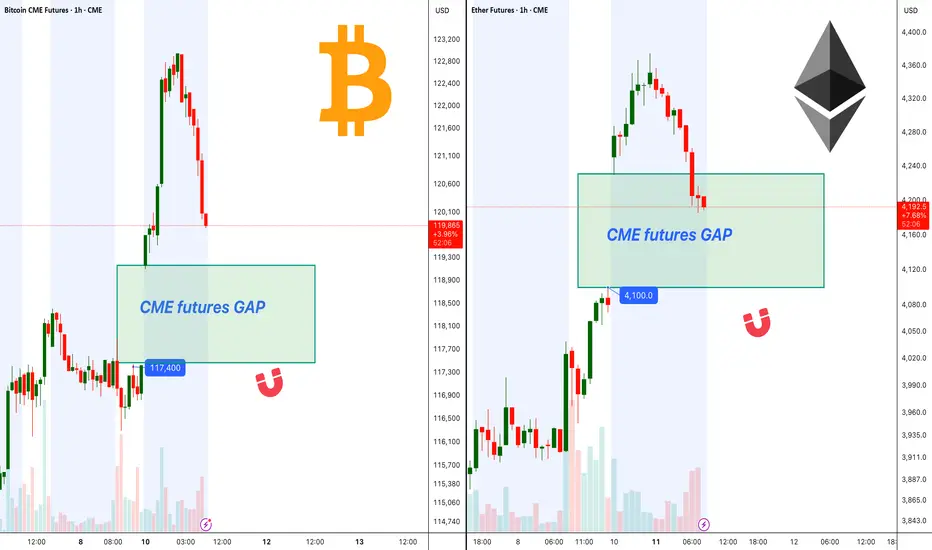
BTC, ETH CME Gaps Could Fill Before Bullish Continuation!Ethereum CME futures currently show a visible gap around $4,100 . Price is approaching this level, and based on historical behavior, CME gaps often act as magnets, drawing price in to fill them before a continuation in trend.
Bitcoin CME futures also have a gap sitting near $117,400. The recent rally has brought BTC close to this zone, increasing the probability of a short-term retracement to fill the gap before any significant breakout attempts.
Both gaps are key areas to watch, as a clean fill followed by strong buying pressure could set the stage for the next bullish wave in BTC and ETH.
Cheers
Hexa
#BTC/USDT Bitcoin & STRONG SUPPORT#BTC
The price is moving within an ascending channel on the 1-hour frame, adhering well to it, and is on track to break it strongly upwards and retest it.
We have support from the lower boundary of the ascending channel, at 114600.
We have a downtrend on the RSI indicator that is about to break and retest, supporting the upside.
There is a major support area in green at 114866, which represents a strong basis for the upside.
Don't forget a simple thing: ease and capital.
When you reach the first target, save some money and then change your stop-loss order to an entry order.
For inquiries, please leave a comment.
We have a trend to hold above the 100 Moving Average.
Entry price: 115361.
First target: 116202.
Second target: 117481.
Third target: 119106.
Don't forget a simple thing: ease and capital.
When you reach the first target, save some money and then change your stop-loss order to an entry order.
For inquiries, please leave a comment.
Thank you.

BTCUSD:The meeting will likely impact further declines.Amidst uncertain news, BTCUSD is less favored than XAUUSD. After the Asian market opened, BTCUSD experienced a significant drop, exceeding 3000p. Assuming the meeting has not concluded, uncertainty will cause BTCUSD to fall further. Short-term short selling is likely to continue.

BTC/USD) Bullish trend analysis Read The captionSMC Trading point update
Technical analysis of bullish Smart Money Concept (SMC) setup for Bitcoin (BTC/USDT) on the 4H timeframe.
---
Technical Breakdown – Bitcoin (4H)
1. Market Structure
CHoCH (Change of Character): Market shifted from bearish → bullish structure.
BOS (Break of Structure): Confirmed bullish momentum as price broke prior highs.
2. FVG (Fair Value Gap)
Price retraced into the highlighted FVG demand zone around $116,000 – $118,000.
This zone is a potential area where institutions accumulate long positions before pushing price higher.
3. Bullish Projection
From the FVG zone, the chart suggests a bullish impulse move targeting higher liquidity levels.
Target Point: $123,708.99
4. Trading Plan Idea
Entry: Inside FVG zone ($116,000 – $118,000).
Stop Loss: Below $115,500 (to protect from deeper liquidity grab).
Take Profit: $123,708.99
Mr SMC Trading point
---
Summary
Bias: Bullish
Reason: CHoCH + BOS + FVG retest confirms institutional demand.
Setup: Buy from FVG zone → Target liquidity at $123,700.
---
Please support boost 🚀 this analysis)

BTC/USD) Bullish trend analysis Read The captionSMC Trading point update
Technical analysis of (BTC/USDT) on the 4-hour timeframe, using Smart Money Concepts and a falling channel breakout approach.
---
Technical Breakdown:
1. Market Structure:
Price has been moving within a descending channel, forming lower highs and lower lows.
BTC just bounced strongly from the Fair Value Gap (FVG) zone, marked in yellow, and the lower boundary of the channel, suggesting a potential trend reversal.
2. Key Levels:
FVG (Demand Zone): Between ~112,000–114,000 — price reacted from this zone with clear bullish momentum.
200 EMA (114,799.70): Price is currently below it, but if it reclaims this level, it will strengthen the bullish setup.
Target Point: ~123,287–123,327 — aligns with the upper boundary of the channel and previous resistance.
3. Projected Price Path:
Step 1: Price is expected to retest the mid-channel resistance and potentially break above.
Step 2: If confirmed, BTC may rally toward the 123k+ target zone, continuing the trend reversal.
4. RSI (14):
RSI is currently at 42.70, moving up from oversold territory (33.05 low), which supports a bullish reversal.
No bearish divergence seen, indicating room for upside.
Mr SMC Trading point
---
Trade Idea Summary:
Bias: Bullish
Entry Confirmation: Strong bounce from FVG and bullish candle close above 114,800 (EMA)
Target Zone:
TP1: 118,000 (channel midline)
TP2: 123,327.97 (channel top / resistance zone)
Invalidation: Close below 112,000 or breakdown of channel and FVG
Indicators: RSI recovery + strong volume bounce supports bullish scenario
plesse support boost this analysis)

BTCUSD: buyBTCUSD's performance is consistent with my expectations. It has rebounded slightly from the bottom and is currently trading at 118,200, representing an overall rebound of approximately 1,000p. Based on the trend, it's still at the bottom. It's still a safe bet to buy.
There was no major news in the market over the weekend that had an impact on trading products. While the meeting news wasn't clearly positive or negative, there was some progress in increasing holdings in the world's largest gold ETF, increasing by approximately 4 tons compared to the previous day. Furthermore, the Federal Reserve's interest rate decision will be announced next week. These two factors appear to be influencing gold prices and warrant our attention.
BTCUSD traders can choose to take some long positions during the holiday. Gold traders can enjoy the holiday and revisit more trading opportunities next week.

BTCUSD: BUYBTCUSD's performance over the weekend was very weak, with fluctuations of only about 1,000p. However, it is currently in the process of bottoming out, and a rebound is possible at any time. Therefore, despite the sluggish market over the weekend, investors who want to trade can still choose to buy BTCUSD and profit.
