Next Volatility Period: Around August 24th
Hello, traders!
Follow us to get the latest updates quickly.
Have a great day!
-------------------------------------
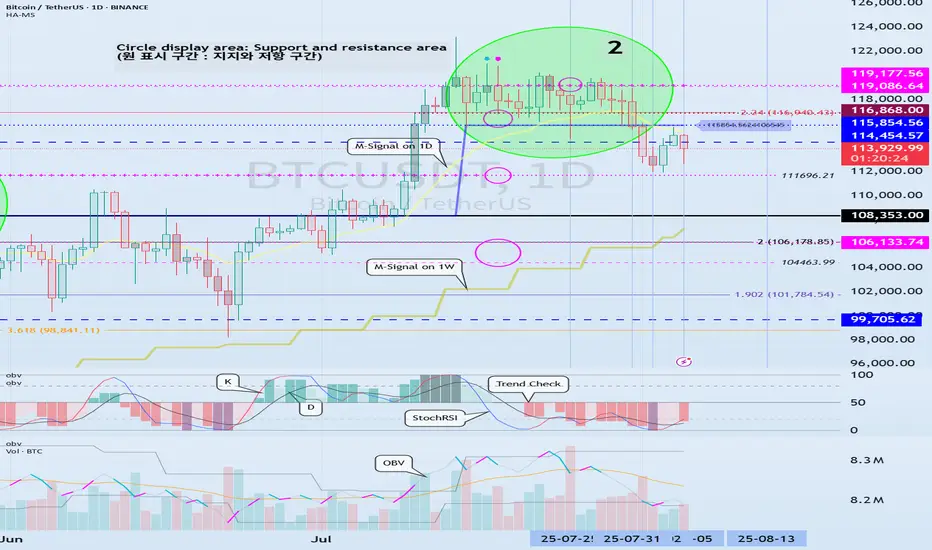
(BTCUSDT 1D Chart)
After this volatility period, the price has re-entered the 115854.56-119177.56 range.
Accordingly, the key question is whether the price can rise after finding support in the 115854.56-119177.56 range.
The next volatility period is around August 24th (August 23rd-25th).
----------------------------------------
To determine the volatility period, support and resistance points and trend lines must be drawn on each timeframe chart.
Support and resistance points are drawn using the DOM(60), HA-High, HA-Low, and DOM(-60) indicators included in the HA-MS indicator.
Trend lines are drawn by connecting the points where the K value of the StochRSI indicator forms peaks in overbought or oversold zones.
Therefore, the trend line is drawn by connecting the peaks formed in overbought zones with a high trend line and the peaks formed in oversold zones with a low trend line.
If these two trend lines form a channel, the trend is likely to continue. If the trend lines intersect, a new trend is likely to be created.
(1M Chart)
The trend lines on the 1M chart are not specifically distinguished between high and low trend lines, but are instead displayed in a single color.
This is because we determined that distinguishing between them is unnecessary, as they represent long-term trends.
When creating trend lines, you must use peaks created in overbought or oversold areas.
The 1M chart displays a dotted trend line, which connects points in overbought or oversold areas that do not have peaks.
These trend lines are not used to determine periods of volatility.
(1W Chart)
Draw support and resistance points and trend lines on the 1W chart, just like on the 1M chart.
When possible, draw trend lines only from recently created peaks and delete previously drawn trend lines.
(1D Chart)
Draw support and resistance points and trend lines on the 1D chart, just like on the 1M and 1W charts.
The points where these support and resistance points and trend lines intersect or intersect are used to identify periods of volatility.
When possible, areas where multiple support and resistance points and trend lines intersect or intersect are considered periods of high volatility.
Also, since trend lines on 1M > 1W > 1D charts differ in accuracy, it's best to select points where they intersect more frequently when utilizing trend lines drawn on 1D charts.
-
Indicators or other analysis techniques created by others require long-term observation to understand and utilize.
Therefore, rather than defining them as right or wrong, consider them as possible and consistently check real-time data to make them your own.
-
Thank you for reading to the end.
I wish you successful trading.
--------------------------------------------------
- This is an explanation of the big picture.
(3-year bull market, 1-year bear market pattern)
I will explain in more detail when the bear market begins.
------------------------------------------------------
BTCUSDTPERP

Bitcoin Market Loot Plan Activated — Watch It Climb!🔥🚨 THIEF TRADER’S ULTIMATE BTC/USD HEIST PLAN! 🚨🔥
Asset: BTC/USD "Bitcoin vs U.S. Dollar" – Crypto Market Robbery in Progress!
Plan: BULLISH HEIST – LAYERED ENTRY MASTERMINDED!
🎯 THIEF’S ENTRY STRATEGY (LAYERED LIMIT ORDERS):
"The vault is unlocked! Swipe the loot at ANY PRICE! But for elite thieves, use LAYERED LIMITS like a PRO!"
Buy Limits (Example):
🔹 122,000.00 (First Dip Grab!)
🔹 120,500.00 (Second Layer – More Stealth!)
🔹 121,500.00 (Third Strike – Smooth Criminal!)
🔸 121,000.00 (Final Trap – Max Loot!)
👉 Adjust layers based on YOUR risk appetite! More layers = More escape routes!
🛑 THIEF STOP LOSS (OG STYLE):
"SL? Yeah, we have one… but REAL THIEVES adjust on the fly!"
🔪 SL @ 117,500.00 (If Bitcoin snitches, CUT & RUN!)
⚠️ Pro Tip: Tighten SL if market flips bearish! Don’t get caught!
💰 TARGET: ESCAPE BEFORE THE COPS ARRIVE! 🚔
🎯 130,000.00 (Final Heist Zone – Police Barricade!)
🏃♂️ 129,000.00 (Early Exit? Smart Thieves Take Profit & DISAPPEAR!)
⚡ THIEF TRADER’S GOLDEN RULES:
✔ SCALPERS: Only LONG side! Quick in, Quick out!
✔ SWING THIEVES: Hold & Trailing SL for MAX LOOT!
✔ RISK? Your wallet, Your rules! Don’t blame the plan!
📢 THIEF ALERT! NEWS = VOLATILITY TRAP!
🚨 Avoid new trades during high-impact news!
🚨 Lock profits with TRAILING SL!
💥 BOOST THIS HEIST PLAN! (More boosts = More stolen money!💰)
🔥 LIKE, SHARE, & FOLLOW FOR NEXT HEIST! Stay stealthy, thieves! 🏴☠️🚀
🚀 SEE YOU AT THE NEXT CRYPTO ROBBERY! 🚀
#ThiefTrader #BitcoinHeist #LayeredEntries #CryptoGang

BTC Buy / Long SetupWait for the entry till London Session, and Hold the trade, Must use SL with proper risk management.

BTCUSDT 4H BULLISH SETUP.BTCUSDT | 4H Bullish Setup
✅ Price broke above key structure and formed a clean FVG + Bullish Order Block below current price.
✅ SSL liquidity resting just above the demand zone.
🔍 Price is pulling back; possible mitigation expected in 117,000 – 116,500 zone.
📌 Trade Idea: Wait for price to tap into demand zone & confirm bullish signals before entry.
🎯 Potential continuation to the upside after liquidity sweep.

Support and Resistance Areas: 114454.57-115854.56
Hello, traders!
Follow us to get the latest information quickly.
Have a great day!
-------------------------------------
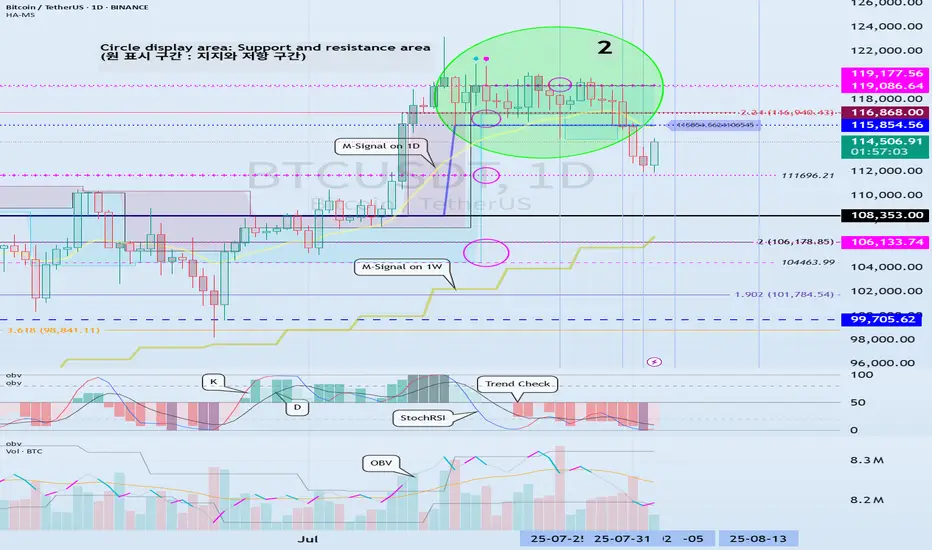
(BTCUSDT 1D Chart)
The K indicator on the StochRSI indicator appears to have entered the overbought zone, leading to a change in slope.
Therefore, the upward trend appears likely to be constrained.
-
We need to confirm whether the price falls within the range indicated by the index finger.
The key question is whether there is support around 114454.57-115854.56.
If it declines, it is likely to continue until it meets the M-Signal indicator on the 1W chart.
At this point, we need to check for support around 108353.0.
This period of volatility is expected to occur around August 13th (August 12th-14th).
The start of a stepwise uptrend is likely to occur only after it rises above 119177.56.
-
Thank you for reading to the end.
We wish you successful trading.
--------------------------------------------------
- This is an explanation of the big picture.
(3-year bull market, 1-year bear market pattern)
I will explain in more detail when the bear market begins.
------------------------------------------------------

#BTC #BTCUSD #BTCUSDT #BITCOIN #LONG #SWING #Analysis #Eddy#BTC #BTCUSD #BTCUSDT #BITCOIN #LONG #SWING #Analysis #Eddy
BTCUSDT.P Swing Long Analysis With Entry Point
This is my first possible scenario and analysis of Bitcoin's future trend.
This Analysis is based on a combination of different styles, including the volume,ict & Price Action Classic. (( Head & Shoulder Pattern ))
Based on your strategy and style, get the necessary confirmations for this Swing long to enter the trade.
Don't forget risk and capital management.
Entry point already touched : 🟢 79285.50
The responsibility for the transaction is yours and I have no responsibility for not observing your risk and capital management.
🗒 Note: The price can go much higher than the first target, and there is a possibility of a 500% pump on this currency. By observing risk and capital management, obtaining the necessary approvals, and saving profits in the targets, you can keep it for the pump.
Spot Investing : ((long 'buy' position)) :
🟢 Entry 1 : 79285.50
🟢 Entry 2 : 61845.77 (( This Entry is for secound scenario ))
First entry point calculations :
⚪️ SL : Behind the last shadow created.
⚫️ TP1 : 250000 ((215.32%))
⚫️ TP2 : 500000 ((530.63%))
⚫️ TP3 : 999000 ((1160.00%))
‼️ Futures Trading Suggested Leverages : 3-5-7
The World Let it be Remembered...
Dr. #Eddy Sunshine
4/4/2025
Be successful and profitable.
Do you remember my first Bitcoin swing long signal entry & targets?
My first swing long signal was provided on BTC, which was spot pumped by more than 150% and was profitable :

#BTC — TP2 Closed by Indicator SignalAs anticipated, Bitcoin continued its upward movement, and our indicator precisely identified the optimal entry point for a long position. The signal was triggered around the $114,000 level, allowing for a timely entry and guided trade management toward the target levels.
The first target was reached within three days, and yesterday the second Take Profit (TP2) level was successfully closed. Throughout the entire trade, the indicator consistently outlined holding zones and partial profit-taking points, ensuring a systematic approach free from emotional decision-making.
The current price is approaching the TP3 area; however, divergence and convergence analysis indicate an increased likelihood of a correction. Despite the absence of a clear reversal impulse, the risk-to-reward ratio has already reached an optimal level, making profit-taking at the current range a justified decision.
The long position opened on the indicator’s signal delivered strong results once again, confirming that precise entries and algorithm-based trade management enable traders to fully capitalize on market movements.
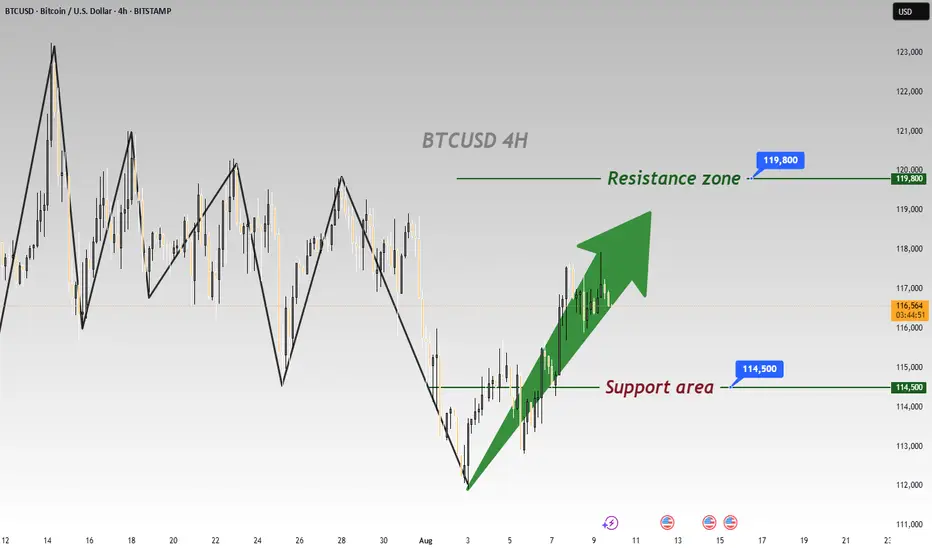
Go long again when it pulls backWhen BTC was around 112500 last week, I mentioned that it would rebound to at least 116500 📢, which was a great opportunity to go long 💰. As expected, after fluctuating in the low range for two days, it rebounded immediately🏹, peaking at 118000. It may still continue to rise, hit the 120000 threshold again🌟, and then pull back upon encountering the first resistance🌡️
⚡️⚡️⚡️ BTCUSD ⚡️⚡️⚡️
🚀 Buy@ 114000 - 114500
🚀 TP 116000 - 117000 - 118000
Daily updates bring you precise trading signals 📊 When you hit a snag in trading, these signals stand as your trustworthy compass 🧭 Don’t hesitate to take a look—sincerely hoping they’ll be a huge help to you 🌟 👇
Bitcoin Traps Bulls and Bears – Real Move Next?Bitcoin is trading in a descending channel on the 4H chart, with two recent fakeouts — one above resistance and one below support — trapping traders on both sides. After reclaiming support, BTC is pushing toward the upper boundary with rising volume, hinting at strong demand. A breakout above $119K could drive a rally toward $125K–$135K.
Cheers
Hexa
BINANCE:BTCUSDT BITSTAMP:BTCUSD

Bitcoin Bounces Back — Is $120K the Next Stop?!Bitcoin ( BINANCE:BTCUSDT ) reacted well to the 50_SMA(Daily) and the Heavy Support zone($112,000-$105,800 and started to rise again.
The question is, can Bitcoin reach $120,000 again and even create a new All-Time High(ATH)!?
In terms of Elliott Wave theory , it seems that Bitcoin has managed to complete the main wave 4 in the descending channel . To confirm the end of the main wave 4 , we must wait for the upper line of the descending channel to break. The structure of the main wave 4 is a Zigzag Correction(ABC/5-3-5) .
I expect Bitcoin to trend higher in the coming hours and attack the resistance area and the upper line of the descending channel(First Target: $117,490) .
Do you think Bitcoin's main correction has begun, or does Bitcoin still have a chance to create a new ATH?
Second target: $119,991
Cumulative Long Liquidation Leverage: $113,526-$112,591
Note: Stop Loss: $111,070
Please respect each other's ideas and express them politely if you agree or disagree.
Bitcoin Analyze (BTCUSDT), 2-hour time frame.
Be sure to follow the updated ideas.
Do not forget to put a Stop loss for your positions (For every position you want to open).
Please follow your strategy and updates; this is just my Idea, and I will gladly see your ideas in this post.
Please do not forget the ✅' like '✅ button 🙏😊 & Share it with your friends; thanks, and Trade safe.

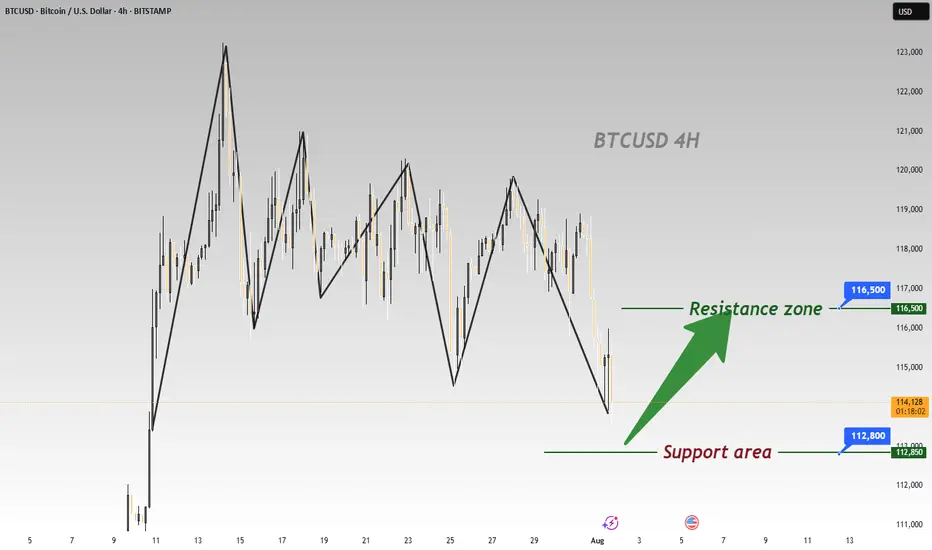
BTC Plummets Post-NFP; Go Long for Rebound to 116500BTC has plummeted significantly under the influence of the non-farm payroll data 📉, and now is an excellent opportunity to go long. Its Support level is around 112800, and according to the current trend, we can wait for a rebound to around 116500.
⚡️⚡️⚡️ BTCUSD ⚡️⚡️⚡️
🚀 Buy@ 113000 - 113800
🚀 TP 114500 - 115500 - 116500
Daily updates bring you precise trading signals 📊 When you hit a snag in trading, these signals stand as your trustworthy compass 🧭 Don’t hesitate to take a look—sincerely hoping they’ll be a huge help to you 🌟 👇
#BTC hits neckline resistance and pulls back📊#BTC hits neckline resistance and pulls back✔️
🧠From a structural perspective, we've retreated after hitting resistance at the neckline, as expected. If the current structure continues to decline rapidly, we could potentially retest support near 112,000, or perhaps break below the previous low to sweep liquidity before rebounding.
➡️The resistance zone remains clear. Only if the neckline resistance zone is broken and stabilizes for a day or so can we maintain a positive bullish stance.
Let's see 👀
🤜If you like my analysis, please like 💖 and share 💬 BITGET:BTCUSDT.P

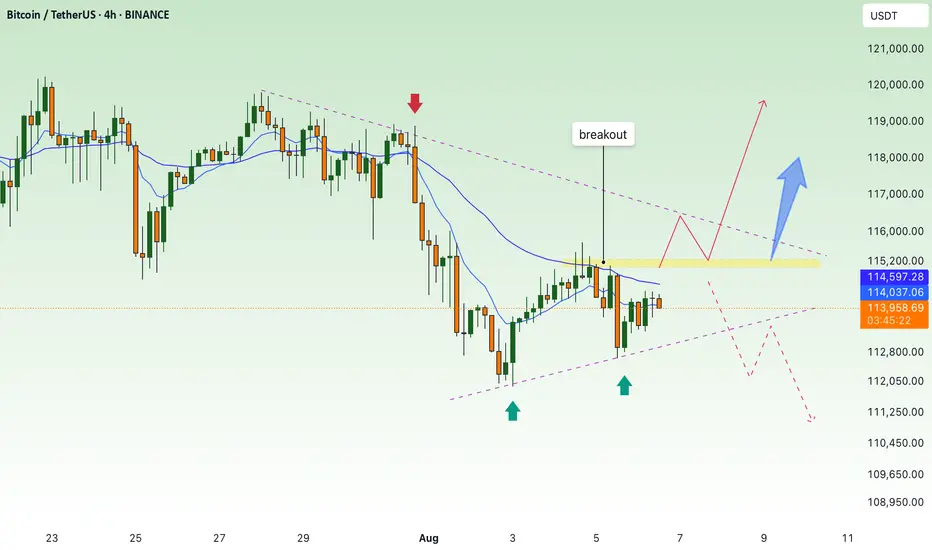
BTC continues to accumulate, waiting for breakout to go up💎 MID-WEEK BTC PLAN UPDATE (06/08)
Brief BTC Analysis – 4H Timeframe:
• Main Trend: Price is consolidating within a descending channel (green diagonal lines).
• Support: The 112,500–113,000 zone has been tested twice and bounced (green arrows).
• Resistance: The 114,800–115,200 zone (purple area) – this is the key level that will determine the next trend.
⸻
Two main scenarios:
🔺 Bullish Scenario (Preferred):
• Price breaks above the 115,200 resistance zone → confirms a breakout from the descending channel.
• Next targets: 116,500 → 119,000.
🔻 Bearish Scenario:
• Price gets rejected at around 115,000 and breaks below the 113,000 support → likely to revisit 110,000.
📌 Key Signals to Watch:
• A clear breakout above 115,200 with volume is a strong buy signal.
• If the price fails to break this zone, consider selling once there is a clear bearish reaction.
Bitcoin Ready for Takeoff - $150K Target Ahead! MARKETSCOM:BITCOIN is showing impressive strength after successfully retesting its May high and bouncing back with conviction. This level, along with the 50 EMA, is currently acting as a strong support zone. Holding above this area signals that buyers are in control, and this zone now serves as a major support for the ongoing bullish trend.
At the moment, CRYPTOCAP:BTC is facing minor resistance in the $115K–$116K range. A decisive breakout above this level is likely to trigger strong momentum, opening the doors for a new all-time high. Once this resistance is cleared, our previous projection of $150K comes into play as the next major target.
For now, it’s crucial for MARKETSCOM:BITCOIN to hold the current support zone to maintain the bullish structure. As always, traders should manage risk effectively and place stop-losses to protect their capital in case of unexpected volatility.
Follow Our Tradingview Account for More Technical Analysis Updates, | Like, Share and Comment Your thoughts

Next Volatility Period: Around August 13th (August 12th-14th)
Hello, fellow traders!
Follow us to get the latest information quickly.
Have a great day!
-------------------------------------
(USDT 12M Chart)
A lot of money has been flowing into the coin market through USDT.
A decline in USDT indicates capital outflow from the coin market.
(USDT.D 12M chart)
As USDT continues to rise, its dominance naturally rises.
However, if USDT is used to purchase coins (tokens) in the coin market, its dominance will decline.
USDT dominance peaked in 2022 and is showing a downward trend.
This indicates that a significant amount of capital flowing into the coin market was used to purchase coins (tokens).
USDT dominance is expected to fall to around 2.84 this year before beginning an upward trend, marking the end of its three-year bull market.
I believe this trend will inject new vitality into the coin market.
For the coin market to maintain an upward trend, USDT dominance must remain below 4.91 or show a downward trend.
If this fails and the price rises above 4.91, the coin market is likely already in a downward trend.
A decline occurred on May 8, 2025, creating a reverse trend.
To maintain this reverse trend, we need to see if it can fall below 4.24.
If USDT dominance declines, the coin market is likely to show an upward trend.
------------------------------------------------------
(BTCUSDT 1D chart)
As the new week begins, the HA-High indicator on the 1W chart is showing signs of forming a new level at 114454.57.
Accordingly, the key question is whether the price can rise after finding support in the 114454.57-115854.56 range.
The formation of the HA-High indicator means that the price has fallen from its high.
This also means that further declines are highly likely.
Therefore, if possible, the price should rise above the 114454.57-115854.56 range and maintain its upward momentum.
This period of volatility is expected to last until August 6th.
Therefore, the key question is whether the price can rise above the 114454.57-115854.56 range after the volatility period.
If not, we assume the price will decline until it meets the HA-Low indicator and consider countermeasures accordingly.
This is because the HA-Low and HA-High indicators are paired.
As the price declines, indicators such as the HA-Low or DOM(-60) may appear.
Therefore, if the price declines, you should monitor for the emergence of indicators such as the HA-Low or DOM(-60).
The basic trading strategy is to buy between the DOM(-60) and HA-Low ranges and sell between the HA-High and DOM(60) ranges.
-
If the price falls below the M-Signal indicator on the 1D chart, it is highly likely that the trend will be re-established upon meeting the M-Signal indicator on the 1W chart.
Therefore, if the price fails to rise to the 114454.57-115854.56 range, it is highly likely that the price will eventually meet the M-Signal indicator on the 1W chart.
At this time, a key support and resistance level is expected to be around 108353.0.
When new support and resistance levels are formed, they must remain horizontal for at least three candlesticks to function as support and resistance.
In other words, the HA-High indicator on the 1W chart is showing signs of forming, but it hasn't yet.
Therefore, if the current price holds this week, it will form next week.
Therefore, for the HA-High indicator to function properly as support and resistance, it must remain horizontal for three candlesticks, or three weeks.
This rule must be acquired through significant time and observation.
-
If you sold partially in the 115854.56-119177.56 range according to your basic trading strategy, you will find it easier to observe the current movement. If not, you will likely become anxious.
The key to trading is maintaining a stable psychological state.
If you begin to feel anxious, you should consider how to stabilize your psychological state.
Otherwise, you'll end up making the wrong trades.
-
Thank you for reading to the end.
I wish you successful trading.
--------------------------------------------------
- Here's an explanation of the big picture.
(3-year bull market, 1-year bear market pattern)
I'll explain more in detail when the bear market begins.
------------------------------------------------------
BTC intraday strategy analysis and operation layout#BTCUSD
Currently, BTC rebounded again to test the upper resistance area of 115000-116000, indicating that buyers are still defending this structure, but it is still suppressed by the upper resistance. From a derivatives perspective, open interest has fallen by 0.91% over the past 24 hours, while options trading volume has also fallen by over 13%, indicating a decrease in speculative activity. Despite a 34.28% increase in 24-hour trading volume to $61.71 billion, the long-short ratio has fallen below 1.0, reflecting cautious market sentiment.
As long as BTC maintains above 114,000-113,000, the short-term structure remains neutral. If it fails to break through the overhead resistance and stabilize above 116,500, bulls may lose control of the lower trendline of the channel, triggering a renewed bearish push.
If BTC can successfully hold above 116,500, it could potentially return to 118,000 or even challenge the macro resistance level of 120,000. On the contrary, if BTC finds it difficult to break through the short-term resistance level, it will still return to the 114,000-113,000 area.
🚀 BUY 116,500-117,000
🚀 TP 118,000-119,000
#BTC enters neckline resistance zone📊#BTC enters neckline resistance zone⚠️
🧠From a structural perspective, we hit the daily neckline support and began to rebound. Unfortunately, it's about $170 away from the overlapping support zone I'm focused on, and the rebound didn't establish a 1-hour bullish structure. This suggests a high probability of encountering resistance and a pullback after this rebound. Therefore, don't chase the rally at the neckline resistance zone! Only if we can break through the neckline resistance zone and stabilize for a day or so should we actively consider a bullish move.
➡️Support is clearly around 120,000. Even if it falls below this level, as long as the 4-hour closing price is above it, this support level will remain valid. Extreme support is still around 110,000!
🤜If you like my analysis, please like 💖 and share 💬
BITGET:BTCUSDT.P

The key is whether it can rise above 115854.56
Hello, traders!
Follow us to get the latest information quickly.
Have a great day.
-------------------------------------
(BTCUSDT 1W chart)
The key is whether it can rise above the newly created DOM (60) indicator point of 119086.64.
If this fails and the price declines, we need to check for support near the previous all-time high (ATH) of 108,353.0.
Since the M-Signal indicator on the 1W chart is rising near 108,353.0, this area is expected to serve as important support and resistance.
-
(1D chart)
This period of volatility is expected to continue until August 6th.
Therefore, the key question is whether the price can rise above 115,854.56 and maintain its upward momentum.
If not, further declines are likely.
-
To rise above 115,856.56,
- The StochRSI indicator must rise within the oversold zone and remain above K > D.
- The On-Bottom Volume indicator must continue its upward trend with OBV > OBVEMA. - The TC (Trend Check) indicator should maintain an upward trend. (If possible, it's best to rise above the 0 point.)
If the above conditions are met and the price rises above 115854.56, it is expected to attempt to rise above 119177.56.
This period of volatility is a significant period of volatility.
Therefore, if the price falls below the HA-High ~ DOM(60) range and encounters resistance during this period, you should prepare for further declines.
-
The basic trading strategy is to buy in the DOM(-60) ~ HA-Low range and sell in the HA-High ~ DOM(60) range.
However, if the price rises in the HA-High ~ DOM(60) range, a stepwise upward trend is likely, while a decline in the DOM(-60) ~ HA-Low range is likely to result in a stepwise downward trend.
Therefore, a split trading strategy is recommended as the basic trading strategy.
When executing a trade, appropriate profit taking secures the liquidity of your investment, giving you the opportunity to seize new opportunities.
To achieve this, you should consider your intended investment horizon before initiating the trade and divide the trade accordingly.
-
The HA-Low indicator on the 1D chart is currently at 89294.25.
Therefore, I believe the market believes it's in a position to take profit.
-
Thank you for reading to the end.
I wish you successful trading.
--------------------------------------------------
- This is an explanation of the big picture.
(3-year bull market, 1-year bear market pattern)
I will explain in more detail when the bear market begins.
------------------------------------------------------
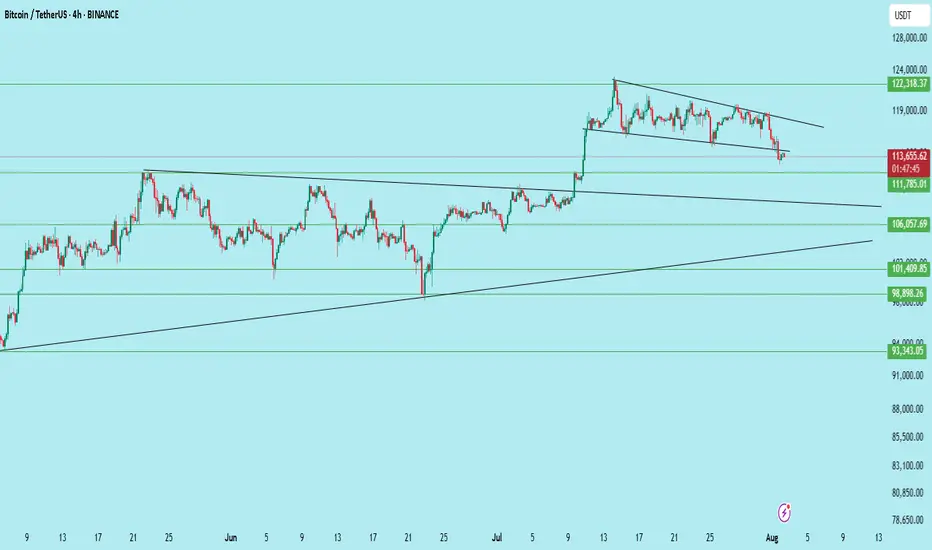
$BTC /USDT – Breakdown from Channel, Bears Gaining ControlBitcoin has broken down from its descending channel on the 4H chart after repeated rejection from the upper trendline. Price is now hovering near key support at $111,785.
Key Technicals:
Rejection from the descending trendline resistance
Breakdown of the mini-channel structure
Current price: $113,637
Support levels:
$111,785 (Immediate)
$106,057
$101,409
$98,398
Bearish continuation is likely if $111,785 breaks with volume
If the $111.7k zone fails to hold, BTC could see further downside toward $106k and even $98k in the coming sessions.
Invalidation: Bullish only on reclaim of $117K+ with strength.
DYOR | Not Financial Advice
Is the #BTC pullback over?📊 Is the #BTC pullback over?
🧠From a structural perspective, a bearish structure has formed on both the 1-hour and 4-hour charts, so we should be wary of the risk of a further pullback.
➡️Resistance is the area formed by the two necklines (114675-115729).
Support is primarily the overlap between the yellow and green areas (110000-111688). If we can establish a bullish structure on the 1-hour chart here, we still have a chance of continuing the bullish trend.
🤜If you like my analysis, please like 💖 and share 💬 BITGET:BTCUSDT.P

#BTC Potential Trading Opportunities📊#BTC Potential Trading Opportunities🔥
🧠We've been trading sideways for quite some time, and selling pressure has largely been exhausted, so we need to find support to enter a long trade.
➡️From a structural perspective, there's a chance for a bullish head-and-shoulders pattern to form. If this pattern holds, we could see a move above $120,000 or even higher.
Potential support is likely between $116,300 and $117,000.
Short-term resistance is around $120,000.
⚠️Note: A break below L1 would destabilize the structure and significantly reduce bullish expectations.
🤜If you like my analysis, please like 💖 and share 💬 BITGET:BTCUSDT.P

BTC Next Move Toward $150K?Bitcoin recently broke out above a long-standing resistance zone ($110K–$115K), supported by a clean move through the volume profile high node. After testing local highs, BTC is now pulling back to retest the breakout area, a critical level that could act as new support.
Key Points:
Breakout Retest: Price has pulled back into the breakout zone around $114K, aligning with strong previous resistance that may now flip to support.
Volume Profile: A strong high-volume node is visible below ($105K–$110K), which reinforces this area as a major demand zone.
EMA Confluence: The 50-day and 100-day EMAs are trending upward and aligning near the retest area, providing additional support.
If this level holds, BTC could resume its bullish leg toward the $150K level.
Cheers
Hexa

Bullish Flag Forming on BTCUSDT – Is the Next Big Move Coming?🧠 Complete and Insightful Technical Analysis:
The 12H BTCUSDT chart is currently showcasing a textbook Bullish Flag pattern, a powerful continuation structure that often precedes major upward moves.
---
🏗️ Pattern Breakdown: Bullish Flag
1. Flagpole:
The sharp breakout from around $107,000 to $123,000 marks the impulsive rally — this is the flagpole, created by strong bullish momentum.
Represents the "lift-off" phase where buyers dominate the market.
2. Flag (Consolidation Phase):
After the strong rally, price consolidates inside a downward-sloping parallel channel, forming the flag.
This pullback is healthy, characterized by declining volume, a key feature of the Bullish Flag.
Indicates temporary profit-taking before continuation.
3. Confirmation:
A breakout above the flag's upper boundary (around $123,000 – $124,000) with strong volume would confirm the pattern.
Breakout traders often use this as a high-probability entry.
---
📈 Bullish Scenario (High Probability):
If BTC breaks above the flag structure:
🎯 Measured Move Target (Based on Flagpole Height):
$123,000 + ($123,000 - $107,000) = $139,000
🚀 Potential for further upside if macro conditions and sentiment support the move, possibly reaching $135,000+ in the medium term.
Confirmation Required: A strong candle close above $123,500 with volume spike.
---
📉 Bearish Scenario (If Breakdown Occurs):
If BTC breaks down below the flag (~$117,000):
Retracement likely toward previous breakout zones at $112,000 – $109,000
Such a breakdown could turn the current structure into a fakeout or bear trap
However, this zone may present a strong re-entry opportunity for long-term bulls.
---
📚 Educational Insight for Traders:
Bullish Flags often appear during strong uptrends, acting as a pause before the next leg up.
A healthy pattern shows shrinking volume during the flag and rising volume at breakout.
Traders should monitor key horizontal resistance and volume behavior for confirmation.
---
🧭 Conclusion:
BTCUSDT is at a critical technical juncture. The formation of a clean Bullish Flag suggests the potential for a major continuation rally. Confirmation through a breakout is key — this is the time to prepare, not react.
#BTCUSDT #Bitcoin #BullishFlag #BTCBreakout #CryptoTechnicalAnalysis #CryptoTrading #PriceAction #BTCAnalysis #BitcoinPattern #CryptoEducation #BTCFlag #ContinuationPattern
