Precise Prediction and Forecast for BTCUSD MarketYesterday, we accurately predicted that BTC would rally to around 116,000 USD and face certain resistance. Today, after breaking through 116,000 USD as expected, the price retraced to hover around 115,000 USD.
Looking ahead, if BTC can stabilize near the 115,000 USD level, it is highly likely to continue its upward trajectory, with the potential to retest the 120,000 USD mark. For upper resistance, the focus remains on the 117,000–118,000 USD range
Buy 114000-114500
TP 115000-116000-1175000
Daily-updated accurate signals are at your disposal. If you run into any problems while trading, these signals serve as a reliable reference—don’t hesitate to use them! I truly hope they bring you significant assistance
Btcusdtrade

BTCUSD 4-Hour Chart AnalysisLooking at the BTCUSD 4-hour chart, the price has recently exhibited a dynamic trend. After a prior upward movement, it underwent a pullback. Now, it has found solid support at the 112,500 level. This support zone appears reliable, as the price has stabilized above it, indicating that buying interest has emerged here to prevent further declines.
In terms of resistance, the 116,000 level is a key hurdle to watch. If the price can successfully break through 116,000 with strong momentum, it would open the door to further upside potential. Before that, the 115,000 level could act as a near-term resistance to test the bulls' strength.
For traders, the strategy could be to monitor the price action around the 112,500 support. If the support holds and there are signs of a bullish reversal , it may be an opportunity to consider long positions with a target towards 115,000 and then 116,000. Conversely, a breakdown below 112,500 would shift the bias to the downside, with the next support level to watch at 110,640
Overall, the near-term trend hinges on the price's interaction with the 112,500 support and the subsequent attempt to challenge the 115,000 - 116,000 resistance zone.
Buy 112500 - 113500
TP 114500 - 115500 - 116000
Daily-updated accurate signals are at your disposal. If you run into any problems while trading, these signals serve as a reliable reference—don’t hesitate to use them! I truly hope they bring you significant assistance

BTCUSD 4-Hour Chart Analysis
In terms of resistance, the 116,000 level is a key hurdle to watch. If the price can successfully break through 116,000 with strong momentum, it would open the door to further upside potential. Before that, the 115,000 level could act as a near-term resistance to test the bulls' strength.
For traders, the strategy could be to monitor the price action around the 112,500 support. If the support holds and there are signs of a bullish reversal , it may be an opportunity to consider long positions with a target towards 115,000 and then 116,000. Conversely, a breakdown below 112,500 would shift the bias to the downside, with the next support level to watch at 110,640
Overall, the near-term trend hinges on the price's interaction with the 112,500 support and the subsequent attempt to challenge the 115,000 - 116,000 resistance zone.
Buy 112500 - 113500
TP 114500 - 115500 - 116000
Daily-updated accurate signals are at your disposal. If you run into any problems while trading, these signals serve as a reliable reference—don’t hesitate to use them! I truly hope they bring you significant assistance

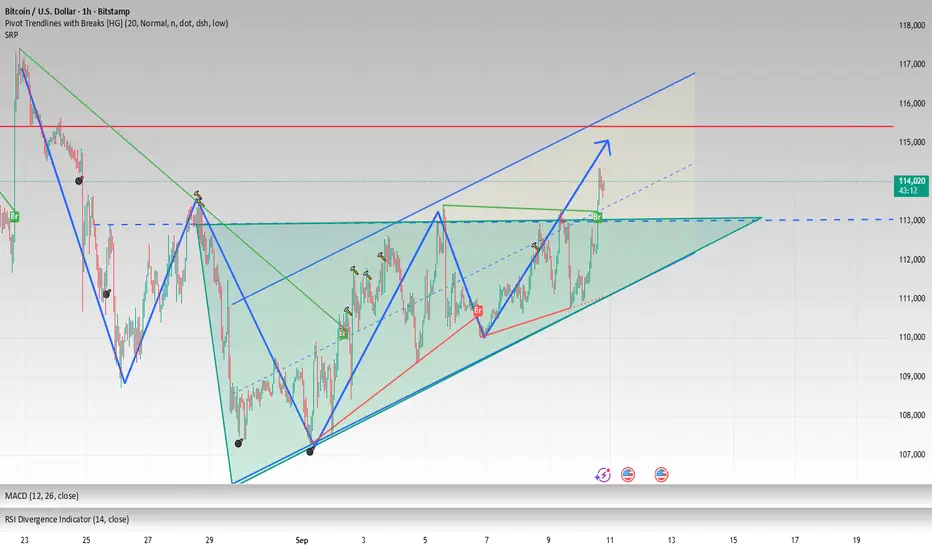
BTC forms an ascending triangle, 113000 is just the beginningBITSTAMP:BTCUSD BTC saw a slight rise during the day. From the hourly and 4H charts, the MACD technical indicator formed a golden cross and broke through the upper short-term pressure of 113000. The short-term trend formed an ascending triangle. Bold and aggressive investors can rely on 113500-112000 to go long, with the target looking at 115500-116500.

BTC Triangle Squeeze: Next Stop $116K?Bitcoin is currently consolidating inside a symmetrical triangle, a classic squeeze that often precedes a strong breakout 💥. Price is building pressure with higher lows and lower highs, waiting for confirmation.
✅ Bullish Confluences:
Price is respecting triangle support and holding the structure.
Fibonacci retracement shows potential upside continuation.
Momentum is shifting after a prolonged corrective move.
🎯 Fibonacci Upside Targets:
🌟38.2% – $112,876
🌟61.8% – $114,195
🌟100% – $116,329
⚠️ Invalidation / Stop-Loss Zone:
If price breaks below $107,000 – $105,000, the bullish setup is invalidated ❌.
As long as BTC stays inside the triangle and above key support, the squeeze favors a bullish breakout

BTCUSD BUY NOW 110650BTCUSD Long Setup
📈 Entry: 110700
🛡️ Stop Loss: 110400
🎯 Take Profit: 111600
Bullish momentum spotted near support zone. Targeting short-term breakout with tight risk control. Ideal for intraday scalpers and momentum traders.

#BTC/USDT Bullish Divergence on 1H, Low Risk Trade#BTC
The price is moving within a descending channel on the 1-hour frame, adhering well to it, and is poised to break it strongly upwards and retest it.
We have a bearish trend on the RSI indicator that is about to be broken and retested, supporting the upside.
There is a major support area in green at 108062, which represents a strong basis for the upside.
For inquiries, please leave a comment.
We are in a consolidation trend above the 100 Moving Average.
Entry price: 108450
First target: 108959
Second target: 109541
Third target: 110325
Don't forget a simple matter: capital management.
When you reach the first target, save some money and then change your stop-loss order to an entry order.
For inquiries, please leave a comment.
Thank you.

Bitcoin (BTC/USDT) Trade Setup🚀 BINANCE:BTCUSDT Trade Setup 🚀
📉 After a sustained downtrend inside a parallel channel, BTC has finally broken out with bullish momentum. Currently, price is hovering around the 111K zone.
🔑 Key Levels:
Support: Channel retest zone (110K – 109.5K)
Resistance: 113K – 114K
Next Major Target: 116K – 118K 🎯
⚡ Trading Plan:
If BTC successfully retests the channel breakout and flips the resistance into support ✅, we could see a massive upside move (potential Elliott Wave structure forming 🔄).
🔥 Confirmation of strength will come once BTC breaks & sustains above 113K with volume.
This could trigger a huge pump towards Wave 3 & Wave 5 targets 🚀💎
🛡️ Risk Management: Place SL below 109K support to protect against false breakouts.
📈 Summary:
BTC breakout + possible retest = high probability bullish setup 📉➡️📈.
Keep an eye on volume and channel validation before entering.

BTCUSD Bearish Since March 13, 2023, the BINANCE:BTCUSD has consistently traded above its weekly 50-period Simple Moving Average (SMA), demonstrating sustained bullish momentum. The price has tested the weekly 50 SMA on three occasions, each time finding support and maintaining its position above Moving Average. However, a significant bearish divergence is evident on the weekly chart, signalling potential weakening momentum despite the upward price trend. Given this divergence and historical price action, there is a high probability that BTCUSD may retest the $95,851–$100,000 support zone in the near term. Traders should monitor this critical area for potential price reaction.

BTCUSD: Bullish Reversal from Support with Breakout TargetPotential Targets:
First Target: The recent high around $116,000.
Second Target: $122,00 and a move toward the next resistance levels from the previous uptrend.
Invalidation:
This bullish view would be invalidated if the price breaks and closes decisively below the key support level at ~$106,000.

Trading Strategy in BTCUSD Price Range✏️ CRYPTO:BTCUSD trading range is being watched around 109000 and 117000. The corrective wave is heading towards the important Break zone to find some buying momentum. The trading strategy will be to wait to buy and wait to sell when there are confirmation signs from one side at the range. There are not many real-time signals for BTC and the wave structure is also relatively difficult to trade at the moment. Therefore, waiting to trade at this range is the optimal choice.
📉 Key Levels
BUY 109000 Strong support zone
SELL 117000 Strong resistance zone
Leave your comments on the idea. I am happy to read your views.

Bitcoin - The magical $1.000.000 level!🚀Bitcoin ( CRYPTO:BTCUSD ) is not done yet:
🔎Analysis summary:
Over the course of the past couple of months, we have been witnessing a bullish continuation on Bitcoin. After the all time high breakout, there is a high chance that this bullrun will continue and Bitcoin might even retest the resistance trendline at seven digits in the near future.
📝Levels to watch:
$1.000.000
SwingTraderPhil
SwingTrading.Simplified. | Investing.Simplified. | #LONGTERMVISION

Powell's Speech Sparks Turmoil: BTC Surges and Pulls BackPowell's speech triggered a sharp surge in both BTC and gold 🚀. Amid such significant volatility, many traders will likely see their accounts wiped out 💥. BTC has pulled back today and may continue to drop to around 112,000 before rebounding ↘️↗️
⚡️⚡️⚡️ BTCUSD ⚡️⚡️⚡️
🚀 Sell@ 117000 - 11600
🚀 TP 115000 - 114000 - 113000
Daily updates bring you precise trading signals 📊 When you hit a snag in trading, these signals stand as your trustworthy compass 🧭 Don’t hesitate to take a look—sincerely hoping they’ll be a huge help to you 🌟 👇

BTCUSDBTCUSD have some more upside, wait for correction and look for buys.
Disclosure: We are part of Trade Nation's Influencer program and receive a monthly fee for using their TradingView charts in our analysis.

Bitcoin: Confident Breakout of $120K — Targets of $125–$135K!• The trend remains bullish: Bitcoin is trading above $117K–118K, has updated its maximum to $124K. Steady growth is supported by growing institutional investments and a softening regulatory environment.
• Key levels:
- Support: $110K–112K — fundamental holding zone. :contentReference
- Resistance*: $120K–123K. A breakout with volume will open the way to $125–134K.
• Technical signals:
- Short-term consolidation after growth of almost 4% — natural rest before the next rebound.
- If BTC consolidates above $125K, there is potential up to $150K.
Bottom line: Bitcoin is demonstrating a consistently bullish sentiment. Holding above $110-112K is critical, a breakout of $120-123K is a signal for growth to $125-134K, and with strong dynamics - to $150K.
Recommendations:
- Buy on dip around $112-115K with targets of $125K+
- Breakout entry** when consolidating above $123K, targets $125-134K
- Stop-loss: slightly below $110K

BTC: Rebound Imminent, Go LongBTC today broke below 115000, then rebounded right away 📉→📈. The rebound will keep going and retest 120000—now’s a solid chance to go long! 🚀
⚡️⚡️⚡️ BTCUSD ⚡️⚡️⚡️
🚀 Buy@ 115000 - 115500
🚀 TP 117000 - 118000 - 119000
Daily updates bring you precise trading signals 📊 When you hit a snag in trading, these signals stand as your trustworthy compass 🧭 Don’t hesitate to take a look—sincerely hoping they’ll be a huge help to you 🌟 👇

BTCUSD:The meeting will likely impact further declines.Amidst uncertain news, BTCUSD is less favored than XAUUSD. After the Asian market opened, BTCUSD experienced a significant drop, exceeding 3000p. Assuming the meeting has not concluded, uncertainty will cause BTCUSD to fall further. Short-term short selling is likely to continue.

Bitcoin Setup: Long Entry Around $115-116K Area | 5:1 R/R Trade📊 If price drops into the white boxed area, I'm looking for a long entry.
But… there's a chance we sweep the lows near $115,555 first before moving up — so avoid blind limit buys. I'll wait for a reaction at the yellow line before entering.
🎯 I'm expecting price to hunt for liquidity around the white box area — essentially targeting stop losses from less experienced traders — before making its move higher.
This isn't necessarily based on strict technical logic, but rather from years of trading experience watching how these patterns typically unfold.
⚠️ **Setup is invalid if:**
• Move happens before this week's weekly candle closes
• Price breaks below the white box
• Price pumps without returning to the box
🚀 If we get this move early next week, I'm targeting at least the blue circled zone.
ATH is possible, but conservatively I'll take profits there.
📈 This trade setup offers a risk-to-reward ratio of 5:1. Without including fees, the breakeven win rate for this trade would be approximately 16.67%.
Knowing these figures in advance helps me avoid emotional trading.
💡 If you often find yourself trading based on emotions, I recommend doing this type of pre-planning and quantifying your setups before execution — it can be a simple yet highly effective improvement.
---
**Trading is simple.** You don't need multiple indicators or dozens of lines on your chart. A clean and simple chart often works best — it keeps your decisions consistent and reduces uncertainty.
Sure, it might not look flashy, and my analysis may seem a bit "plain" compared to others… but that's how I like it.
If you find this analysis useful, feel free to follow me for more updates.
---
*Disclaimer: This post is for general informational and educational purposes only. It does not constitute financial advice, investment recommendation, or a service targeting specific investors, and should not be considered illegal or restricted information in any jurisdiction.*

BTCUSDBTCUSD needs some more downside before we start to see upwards momentum.
Disclosure: We are part of Trade Nation's Influencer program and receive a monthly fee for using their TradingView charts in our analysis.

BTCUSD: buyBTCUSD's performance is consistent with my expectations. It has rebounded slightly from the bottom and is currently trading at 118,200, representing an overall rebound of approximately 1,000p. Based on the trend, it's still at the bottom. It's still a safe bet to buy.
There was no major news in the market over the weekend that had an impact on trading products. While the meeting news wasn't clearly positive or negative, there was some progress in increasing holdings in the world's largest gold ETF, increasing by approximately 4 tons compared to the previous day. Furthermore, the Federal Reserve's interest rate decision will be announced next week. These two factors appear to be influencing gold prices and warrant our attention.
BTCUSD traders can choose to take some long positions during the holiday. Gold traders can enjoy the holiday and revisit more trading opportunities next week.

BTCUSD: BUYBTCUSD's performance over the weekend was very weak, with fluctuations of only about 1,000p. However, it is currently in the process of bottoming out, and a rebound is possible at any time. Therefore, despite the sluggish market over the weekend, investors who want to trade can still choose to buy BTCUSD and profit.

Bitcoin Market Loot Plan Activated — Watch It Climb!🔥🚨 THIEF TRADER’S ULTIMATE BTC/USD HEIST PLAN! 🚨🔥
Asset: BTC/USD "Bitcoin vs U.S. Dollar" – Crypto Market Robbery in Progress!
Plan: BULLISH HEIST – LAYERED ENTRY MASTERMINDED!
🎯 THIEF’S ENTRY STRATEGY (LAYERED LIMIT ORDERS):
"The vault is unlocked! Swipe the loot at ANY PRICE! But for elite thieves, use LAYERED LIMITS like a PRO!"
Buy Limits (Example):
🔹 122,000.00 (First Dip Grab!)
🔹 120,500.00 (Second Layer – More Stealth!)
🔹 121,500.00 (Third Strike – Smooth Criminal!)
🔸 121,000.00 (Final Trap – Max Loot!)
👉 Adjust layers based on YOUR risk appetite! More layers = More escape routes!
🛑 THIEF STOP LOSS (OG STYLE):
"SL? Yeah, we have one… but REAL THIEVES adjust on the fly!"
🔪 SL @ 117,500.00 (If Bitcoin snitches, CUT & RUN!)
⚠️ Pro Tip: Tighten SL if market flips bearish! Don’t get caught!
💰 TARGET: ESCAPE BEFORE THE COPS ARRIVE! 🚔
🎯 130,000.00 (Final Heist Zone – Police Barricade!)
🏃♂️ 129,000.00 (Early Exit? Smart Thieves Take Profit & DISAPPEAR!)
⚡ THIEF TRADER’S GOLDEN RULES:
✔ SCALPERS: Only LONG side! Quick in, Quick out!
✔ SWING THIEVES: Hold & Trailing SL for MAX LOOT!
✔ RISK? Your wallet, Your rules! Don’t blame the plan!
📢 THIEF ALERT! NEWS = VOLATILITY TRAP!
🚨 Avoid new trades during high-impact news!
🚨 Lock profits with TRAILING SL!
💥 BOOST THIS HEIST PLAN! (More boosts = More stolen money!💰)
🔥 LIKE, SHARE, & FOLLOW FOR NEXT HEIST! Stay stealthy, thieves! 🏴☠️🚀
🚀 SEE YOU AT THE NEXT CRYPTO ROBBERY! 🚀
#ThiefTrader #BitcoinHeist #LayeredEntries #CryptoGang
