BTCUSD: Overall trend is moving downwardLooking at the candlestick chart, Bitcoin has formed a potential M-top or double top pattern, which is a typical top reversal signal. Currently, the price has broken below all short-term moving averages, indicating obvious weakness.
Yesterday, it is consistent with my analysis. BTC broke below the short-term support at 102,000, fell to around 100,000 where it found support and rebounded. However, this also showed an overall downward shift in the trend, with yesterday’s short-term support at 102,000 having turned into today’s resistance.
Overall, I predict that Bitcoin will continue its overall downward trend today. The short-term support is at 100,000, and a break below this level would target 98,000.
For resistance above, we still focus on 105,000 in the short term, with key attention on 108,000. Only a breakthrough and a firm hold above 108,000 could lead to sustained gains.
Buy 100,000 - 100,500
SL 99,000
TP 102,000 - 102,500 - 103,000
Sell 103,500 - 104,000
SL 104,500
TP 102,000 - 101,500 - 101,000
Btcusdtshort

BTCUSD: Consolidation is the main theme todayYesterday, BTC saw intense battles around the psychological threshold of 100,000. During the session, it once broke below the key support at 99,500, then rebounded to around 104,000.
Today, it pulled back to around 102,000 at the opening of the Asian session and began to consolidate again.
On the upside, the 105,000-105,500 zone forms a crucial resistance range. Only a daily close firmly above this level can confirm the reversal of the short-term downtrend. For today's short-term support, we still focus on 100,000. If it breaks below 100,000, we need to pay key attention to the supporting role of 98,000.
Buy 100,500 - 101,000
SL 100,000
TP 102,000 - 102,500 - 103,000
Sell 103,000 - 103,500
SL 104,000
TP 101,500 - 101,000 - 100,500

Today's Bitcoin Trading StrategyThe funds on the blockchain have "massive exodus", and core holdings have loosened.
Chain data reveals a fatal risk: Over the past 7 days, the "super" addresses holding more than 1,000 BTC have decreased by 12, and have transferred a total of 23,000 BTC (approximately 24.15 billion US dollars) to exchanges. Among them, 80% have completed the sale. More importantly, "long-term addresses that have been locked for over 3 years" have for the first time experienced a large-scale unlocking, with a weekly unlocking volume of 18,000 BTC. After these "dead money" turned into "live money", it directly exacerbated market selling pressure. Historically, situations where super and long-term addresses simultaneously reduced holdings have occurred 3 times, each accompanied by at least a 15% price correction.
Today's Bitcoin Trading Strategy
buy:101000-102000
tp:103000-104000
sl:100000

No Rise in Sight — the Drop’s Still RightAs I mentioned before, I expect Bitcoin to decline toward 104K, and now the signs of this move are forming.
The invalidation zone is marked on the chart (and may be shifted closer to 110,445).
After reaching 104K, a sharp but limited rebound is possible, but I don’t expect a trend reversal at this stage.
⚠️ This is not financial advice or a trade signal. Please manage your risks and follow your own money management system.

Little Short Won’t Hurt a LotI’m opening a small short on Bitcoin.
You know that I’m expecting a decline toward 104K and possibly lower.
At the moment, I’m looking for a small move down — just a part of the bigger bearish trend.
Targets and stop are marked on the chart

Today's Bitcoin Trading StrategyThe price trend has shown a "double top reversal"
When looking at the K-line chart, it is clearly visible that Bitcoin previously rose to a high of $12.6, then fell back and tried to rise again, but failed to exceed the previous high, forming an "M" shape (which is what people call a double top). This is like climbing a mountain. The first time reaching the top without stabilizing caused a fall, and the second time climbing, although close to the top, lacked the strength to go up, so it could only slide further down. Now the price has fallen below the middle low point of this "M" shape, indicating that the downward trend is very obvious.
The external environment has worsened, and Bitcoin cannot withstand it
Recently, the global market has been unstable. For example, trade policies have changed, and there are concerns that inflation will rebound. Everyone starts to buy gold, US dollars and other safe-haven assets, while they are less inclined to touch risky assets like Bitcoin. Moreover, the "expectation of interest rate cuts" that supported Bitcoin's rise has weakened. People are unsure if there will be further interest rate cuts in the future, and no one dares to buy Bitcoin boldly. The price naturally lost the momentum to rise and was more likely to be pushed down by selling pressure.
Today's Bitcoin Trading Strategy
sell:108000-109000
tp:107000-106000
sl:110000

From 107K to 104K — Bitcoin’s Next Stop Before the Big Drop?An update to my previous Bitcoin outlook — we’ve almost reached my 107K target.
Now, I’m setting a new short-term goal at 104K, though I believe we might even dip toward 100K.
Let’s see how the chart reacts as we approach the 104K zone.
On a larger scale, as I mentioned in one of my earlier posts, my global target remains around 83K.
The invalidation zone for this scenario is marked directly on the chart.
Let’s summarize 👇
📉 Nearest target: 107K (almost reached)
📉 Next target: 104K
📉 Possible drop to: 100K
🌋 Global target: 83K
👁️Follow me so you don’t miss future updates to my forecasts!

No Rise in Sight — 107K Might Be RightAt the moment, I don’t see any technical reasons for Bitcoin to continue its rally.
For now, I’d like to see Bitcoin move down toward the 107K area or even lower.
The invalidation level of this scenario is marked in red on the chart

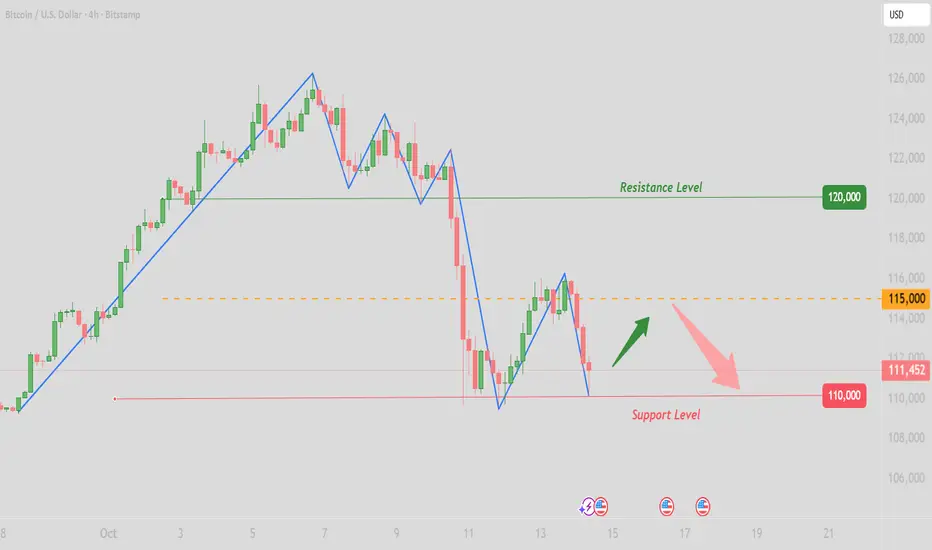
BTCUSD – 4H Bearish setup BITSTAMP:BTCUSD is reacting from confluence resistance near 114K, with fading momentum and Fibonacci alignment favoring a retracement toward 112.4K, 111.3K, and possibly 109.4K if bearish momentum extends. A sustained break above 114.9K would invalidate this short-term bearish view.
Bearish Confluences:
Price is approaching the upper boundary of the maroon resistance channel while showing rejection wicks near 113.9K–114.3K — a zone aligning with previous structure highs.
Momentum has slowed near the 38.2% Fibonacci retracement of the prior downswing (around 114.3K), signaling potential exhaustion of the current bounce.
The brown mid-band (trend mean) has flattened, suggesting loss of bullish momentum and possible reversion to mean.
Candles are testing the underside of prior liquidity zones where sellers previously entered aggressively.
Bias: Short-term bearish retracement potential while below 114.3K. A confirmed 4H close under 113.5K would strengthen the bearish case.
Fibonacci Targets (from swing high ≈ 119.2K to swing low ≈ 109.4K):
38.2% Target: 112,463
61.8% Target: 111,309
100% Extension: 109,442

Today's Bitcoin Trading StrategyThe three core contradictions of "rebound momentum exhaustion + leveraged structure fragility + reversal of capital flow" provide clear anchors for the bearish logic.
1.The rebound momentum is nearing its end: This round of rebound, which started at $110,800, has reached the key resistance level of $114,200 at the lower edge of the previous oscillation range. From the trend rhythm, the rebound has three times attempted to break through $114,000 but failed to form an effective breakthrough, and each time after the peak, the rebound speed has accelerated, indicating that the upward momentum of the bulls is continuously weakening, and the short-term correction pressure has accumulated to a certain extent.
2.Leverage positions carry hidden risks: According to Coinglass data, the unliquidated position of perpetual contracts increased by 18% to $62 billion during the rebound period, but the trading volume only increased by 7% in tandem, forming an imbalance of "volume contraction and position increase". Currently, the leverage ratio of retail investors has risen to 7.5 times, approaching the recent liquidation threshold, and although the ratio of long and short positions has dropped to 1.4:1, it is still higher than the average of the past three months at 25%. The fragility of leveraged funds has laid a hidden danger for the correction.
3.Clear signal of capital flight: Chain data shows that short-term profitable addresses holding BTC for 1-3 months sold a net of 18,000 BTC on the same day. The net inflow of Bitcoin in exchanges increased by 60% month-on-month, indicating that the profit positions are accelerating their departure. At the same time, the net outflow of funds from Bitcoin ETF reached $230 million in a single day, turning negative for the first time in the past week, and the short-term allocation demand of institutions has cooled down, further weakening the price support.
Today's Bitcoin Trading Strategy
sell:114000-114500
tp:113000-113500
sl:115000

BTC:Continuing to pull back📈Looking at the 4-hour candlestick chart, Bitcoin continued to pull back and decline today. The short-term support level remains in the 107,000-107,500 range, which has provided support multiple times during previous downward movements. If the price breaks below this range, it may further drop to around 105,000. The resistance level is in the 112,000-113,000 range; a breakthrough here is expected to open up more upward space.
📝In the long term, after Bitcoin's fourth halving in April 2024, its daily production dropped from 900 to 450 coins, with the inflation rate falling below 1% for the first time. This has further strengthened its scarcity. Combined with the surge in institutional demand, the supply-demand gap is expected to widen, supporting a long-term upward price trend.
💡However, in the short term, the contradiction between continuous institutional inflows and profit-taking by short-term holders may lead to certain price fluctuations.
💎Trading Strategy:
Buy 107,000 - 107,500
SL 106,500
TP 108,000 - 109,000 - 110,000
Sell 111,500 - 111,000
SL 112,000
TP 110,000 - 109,000 - 108,000
Daily-updated accurate signals are at your disposal. If you run into any problems while trading, these signals serve as a reliable reference—don’t hesitate to use them! I truly hope they bring you significant assistance

BTC holds firmly above 110,000Today, BTC exhibited a trend of first declining and then rising.
At the opening, Bitcoin once dipped to 107,466, but subsequently, bulls began to gain momentum, driving the price to recover gradually. It successfully broke through the 110,000 mark and continued to rise.
From the perspective of market sentiment, the Fear & Greed Index is in the "Greed" zone, with the current index standing at 70. This indicates that despite short-term price fluctuations, the market remains optimistic about the overall trend. Such sentiment helps sustain the current consolidation and may provide momentum for a subsequent rally.
In terms of capital flows, on-chain data shows that although the overall capital flow is relatively complex, whales have recorded a significant net inflow in the latest cycle. Their inflow volume reached 207 million BTC, far exceeding the outflow volume of 160 million BTC. This strong buying power is the core driving force behind Bitcoin's ability to gain support at high levels and continue its upward trajectory.
Short-term trend forecast:
In the short term, BTC is likely to consolidate around 110,000. Attention should be paid to the resistance level near 112,000–113,000 on the upside and the support level near 107,500-107,000 on the downside. If it can break through the upper resistance, the price may surge toward the 115,000–118,000 range; if it falls below the lower support, it may drop to 105,000 or even lower.
Trading Strategy:
Buy 108000 - 109000
SL 107000
TP 110000 - 111000 - 112000
Sell 112000 - 111000
SL 113000
TP 110000 - 109000 - 108000
Daily-updated accurate signals are at your disposal. If you run into any problems while trading, these signals serve as a reliable reference—don’t hesitate to use them! I truly hope they bring you significant assistance

BTCUSD – Three Drives Pattern + RSI DivergenceHi Teams!
Bitcoin has recently completed a three-drive pattern while also showing a clear bearish divergence on the RSI. This confluence has led to a strong rejection from the third drive area, confirming short-term weakness.
The three-drive trendline was broken last night, signaling that the bullish momentum has temporarily cooled down. However, as long as $97,900 remains unbroken, the bullish structure can still hold.
Here’s the current plan:
Key support zone: $108,600; this looks like a good potential long entry area if the price stabilizes and shows confirmation.
Upside target: around $118,045, which also aligns with the previous swing high.
Invalidation: if the price breaks below $97,900, the setup turns bearish, and we can expect deeper retracements toward the $86,500–$88,000 region.
In short, BTC is at a critical decision point, holding above $97,900 keeps the bullish structure intact, but a breakdown below that level could shift the market sentiment sharply bearish.
Disclaimer: As part of ThinkMarkets’ Influencer Program, I am sponsored to share and publish their charts in my analysis.

BTC: Today's predictions and operations have been verified👏Today, our predictions for BTC have been verified by the market.
✔1-Judgment on Short-Term Market Nature: After Bitcoin experienced a sudden sharp surge at the opening, we accurately judged that "this surge was a short-term fluctuation lacking sustained support". Subsequently, the price fluctuated downward rapidly and fell back to the oscillating range, which fully validated the judgment that "it was not a trend reversal".
✔2-Trend Direction Prediction: We clearly proposed the downward target level of 103,000. After Bitcoin dropped to just above 103,000 and then rebounded, this fully confirmed our judgment.
🎉Today, we have successfully concluded this week’s trading and work. Next week, we will continue to provide you with more accurate market interpretations and operation references from a professional analytical perspective. Finally, we wish you all a relaxing and pleasant weekend in advance!

From the Previous Warning to Today’s Move — Watch the Next LegThe prior BTC analysis aged well — we’ve had roughly 17% downside since that post.
This update maps the continuation: after a wave 2 correction, Bitcoin can resume a sharp selloff as wave 3. No fluff — just structure and Elliot
Previous analysis:
If this helps, save & follow for the next updates. (Not financial advice.)

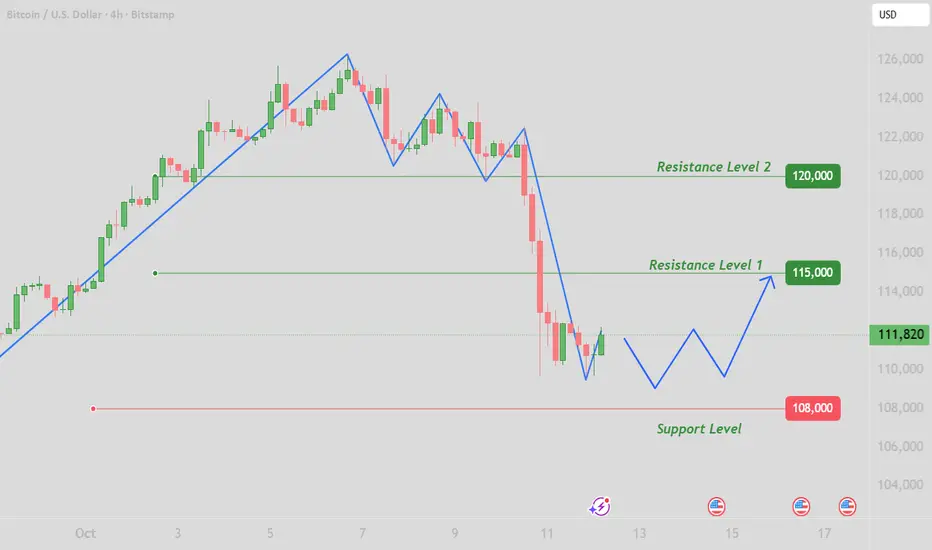
BTC: The key lies in the 110,000 supportFrom the 4-hour candlestick chart, since Bitcoin’s periodic high of approximately 126,000, a complete descending trend structure has been formed. Moving averages across all timeframes have created heavy dynamic resistance above the candlesticks, indicating that the market is currently in a phase dominated by bears.
This decline has triggered the spread of panic sentiment in the market, with a large number of investors choosing to take profits at high levels, further increasing selling pressure.
Today, the key focus is on whether the 110,000 support level holds. If this 110,000 support is broken, Bitcoin prices may fall further to 108,000 or even lower, as the market needs more time to digest the current negative sentiment and macroeconomic pressures.
💎
Buy 109000 - 109800 TP 110800 - 111800 SL 108000
Sell 112000 - 111800 TP 111000 - 109000 SL 112500
Daily-updated accurate signals are at your disposal. If you run into any problems while trading, these signals serve as a reliable reference—don’t hesitate to use them! I truly hope they bring you significant assistance

Bitcoin Eyeing $108K ZoneCRYPTOCAP:BTC Daily Chart Analysis
Bitcoin is currently trading around $110,300, showing weakness after failing to hold higher levels. The market structure still looks corrective, and we can see price slowly drifting toward the nearest support zone around $108,000–$109,000.
If this zone holds, we might see a short-term bounce or relief rally. But if the market breaks below $108,000, the next major demand area lies near $104,000–$100,000, where buyers are likely waiting.
For now, the key is to watch how price reacts at this support. A strong bounce could confirm accumulation, while a breakdown might trigger deeper correction before any new bullish leg.
DYOR, NFA

BTC aligns with my forecast📝BTC continued to decline today but encountered support above the $110,000 level and staged a slight rebound. We reminded traders to take profits in a timely manner around the $110,200 mark and urged them not to blindly chase the downward move. We also advised that if the price continued to drop to around $110,000, traders could consider entering small-position long trades, but they must set stop-losses properly.
💎Subsequently, Bitcoin’s trend fully aligned with our forecast—it rebounded and rose from around $110,200. For those traders who just established long positions following our advice, they can now also choose to take profits and avoid blindly chasing the upside to prevent losses.
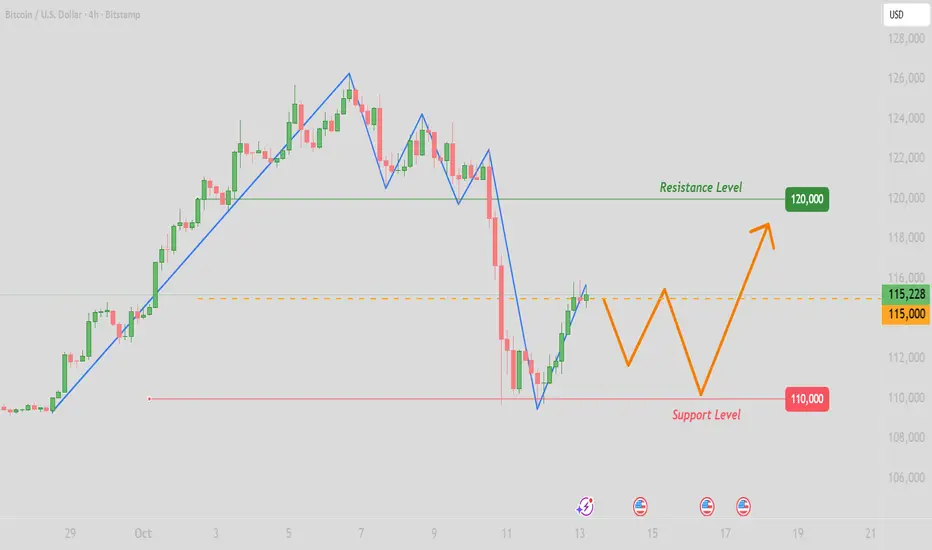
BTCUSDT — Monthly Peak Confirmed: Distribution Phase BeginsBTCUSDT — Monthly Peak Confirmed: Distribution Phase Begins
Bitcoin has just flashed a Monthly Peak Confirmation, hinting that the market may have entered its distribution zone after a two-year bull run.
1. The Origin of the Wave:
The current bullish wave began on October 1st, 2023, when BTC traded around $34,639.
From that level, price climbed relentlessly until September 1st, 2025, marking a top near $119,000.
Anyone who bought at the wave’s origin would be sitting on more than $90,000 profit per BTC after almost two years.
2. Key Pullback Opportunities:
Throughout the uptrend, BTC offered three clear pullback entries:
June 5th, 2024
August 20th, 2024
April 12th, 2025
Each of these corrections gave profitable continuation entries before the final monthly peak.
3. Current Status (October 14th, 2025):
BTC trades near $115,000, only slightly below the all-time high.
However, the chart structure shows that Monthly Peak = Confirmed, implying the start of an ATH distribution phase — the moment when large holders quietly reduce exposure.
4. Forward Outlook:
We now anticipate a SWING SHORT setup developing on the Monthly timeframe.
Target: $77,000 — a long and deep retracement expected to unfold over several months.
This is not a flash crash scenario but a slow, heavy correction marking the end of the bull cycle and transition into consolidation.
Summary:
Bitcoin has completed its two-year impulse wave from $34K to $119K.
Monthly peak confirmed → distribution started → next macro opportunity lies on the short side.

BTC: rebound on shrinking volume📈Today, BTC exhibits the characteristic of a "rebound on shrinking volume," and this trend continues yesterday’s recovery movement. After experiencing the extreme volatility of last week’s sharp decline, the market is now entering a phase of rebalancing between bullish and bearish forces.
💎If the U.S. government shutdown crisis persists or Sino-U.S. trade frictions escalate further, it may trigger another round of safe-haven capital outflows.
📝Currently, open interest remains at a historic high; if the price breaks above the key level of 116,000 or falls below 110,000, it could lead to a new wave of leveraged position liquidations.
💡Based on the bull-bear game pattern, a range trading strategy can be adopted. Since the current volatility is still at a high level, it is recommended that the leverage ratio does not exceed 2x, and heavy-position trading should be avoided before the key range breaks out.
@Buy 114000 - 114800 TP 115000 - 116000 SL 113200
@Sell 116000 - 116500 TP 115000 - 114000 SL 117000
Daily-updated accurate signals are at your disposal. If you run into any problems while trading, these signals serve as a reliable reference—don’t hesitate to use them! I truly hope they bring you significant assistance
BTC: Oscillating to build a bottomOver the weekend, after a sharp decline in the early stage, the Bitcoin price is currently in a shock - bottoming phase. In the early stage, the short - selling force was strong, pushing the price down rapidly. However, over the weekend, the price fluctuation range gradually narrowed, indicating that the strength of the long and short sides tends to be balanced in the competition, and the market is looking for a short - term direction.
Although Bitcoin rose in oscillations today, it encountered resistance near 112,500 and failed to break through after several attempts. This position has gathered a certain number of trapped orders and active sell orders, forming a short - term resistance range. If the bulls can gather enough strength to break through the 112,500 with increased volume, the upward space will be opened, and the price may further challenge the resistance levels of 115,000 or even 120,000. However, due to the sharp decline in the early stage, the market sentiment is still relatively fragile, and investors are generally cautious. From a technical point of view, Bitcoin is likely to continue to oscillate and consolidate in the range of 108,000 - 115,000 today, and the long and short sides compete around key levels.
Buy 108000 - 110000
TP 113000 - 115000
SL 106000
Daily-updated accurate signals are at your disposal. If you run into any problems while trading, these signals serve as a reliable reference—don’t hesitate to use them! I truly hope they bring you significant assistance
BTC:Flash crashToday Bitcoin suffered a "flash crash", plummeting by over 13% in the early hours and falling below the $110,000 mark, which triggered forced liquidations for more than 1.6 million traders.
The core market situation can be summarized as leverage-driven cascading liquidations led by policy negatives. While short-term volatility has intensified, long-term key factors remain unchanged. Before the crash, Bitcoin’s leverage ratio soared to 50x, and high-leverage trading was prevalent among retail investors. Price fluctuations triggered forced liquidations, amplifying the decline.
We judge that the 103,000 level and the psychological threshold of 110,000 serve as crucial short-term support levels. If the price breaks below 100,000, a deeper correction may be triggered.
The Federal Reserve’s October interest rate decision, the progress of the U.S. government shutdown, and the follow-up developments of Trump’s trade policies will become core variables in the next phase.

BTC Technicals Point to Strong Bullish Setup at $112K SupportLooking at this weekly CRYPTOCAP:BTC chart, you can see Bitcoin has been consistently holding above the 50 EMA, acting as solid support each time it retraces back to it. The key point to note here is how the price has tested this zone multiple times, forming a strong area of confluence. Each time, Bitcoin has successfully bounced, showing a solid structure to keep the uptrend intact.
At this moment, Bitcoin is facing resistance around $126,000, but the market looks strong, especially with the EMA holding as support. If the price breaks this resistance, we could be in for another leg up towards higher targets. The price action here indicates that bulls are in control, and the current setup suggests there's a good chance we might see more upside soon, especially if the zone around $112,000 holds as support.
Keep an eye on the key levels: if BTC holds above the 50 EMA and the confluence zone, the next push could be significant.
DYOR, NFA
#PEACE
