BTC/USD Daily(EOD) Trend AnalysisAccording to my analysis, BTC/USD may test the target levels of 89215 and by Feb 24th, 2026 it should trade above 75670.
This roadmap serves as a supporting reference to assess the probable upcoming trend in BTC/USD, with key turning dates identified in advance.
It should not be used as a standalone tool. Traders are advised to conduct their own technical analysis for entries and exits, along with proper risk management
Btcusdtupdate

The chart suggests a bearish bias: BTC is sitting near the suppoThe chart suggests a bearish bias: BTC is sitting near the support at 93,182 and the analyst expects a breakdown into the red target zone around 90,233.
A small‑scale idea would be to watch the 91,955 level (current price). If it breaks below the support, you could expect the price to chase the target at ~90,200. Conversely, if it bounces off 93,182, the move might stay in the range or test the seller zone again.

ElDoradoFx – BTCUSD ANALYSIS (25/12/2025, BANK HOLIDAY UPDATE)HI EVERYONE PLEASE SUBSCRIBE TO OUR YOUTUBE CHANNEL FOR FREE DAILY FORECAST.
LINK IN OUR BIO.
1. Market Overview
BTCUSD is in a higher-timeframe corrective phase inside a broader bullish macro structure.
After rejecting the HTF supply around 126k earlier in the year, price has been trending lower but is now stabilising above a major structural demand zone between 86.4k – 84.4k.
The current market state is:
• Macro: Bullish market → medium-term correction
• Structure: Range / compression after sell-off
• Liquidity: Sell-side has been partially taken, buy-side remains above 88.8k and 90.6k
• Momentum: Bearish impulse exhausted, bullish momentum building
This suggests we are transitioning from distribution → markdown → accumulation / rebalancing.
⸻
2. Technical Breakdown
🔹 Daily (D1)
• Market printed a full impulse down from ~116k → ~80.6k (clean bearish leg).
• Price is now holding above the D1 strong low (80,630) and forming higher lows.
• White 50 EMA is flattening; yellow 200 EMA still above price (bearish pressure remains).
• Daily structure is neutral → early recovery, not yet bullish.
Key read:
As long as 80.6k holds, this is a corrective leg — not a trend reversal.
⸻
🔹 H1
• Trendline break to the upside after the 80.6k low.
• BOS up toward 90.5k failed and created a lower high → rejection → pullback.
• Price now compressing between:
• Resistance: 88.0k – 88.6k
• Support: 86.4k – 87.0k
Structure: Range inside recovery channel.
⸻
🔹 30M
• Market swept below 86.4k liquidity, then reclaimed it.
• Internal BOS printed bullish, but price is now ranging under supply.
• Strong reaction every time price hits 86.4k demand.
This is accumulation behaviour.
⸻
🔹 15M
• Equal highs taken near 88.0k, but continuation failed.
• Price remains above trendline support and demand.
• CHoCH bullish → then sideways compression.
⸻
🔹 5M
• Micro structure alternating — no directional control.
• Liquidity sitting:
• Above: 88.4k – 88.8k
• Below: 86.8k – 86.4k
Market waiting for a liquidity trigger.
⸻
3. Fibonacci Analysis
Swing used:
Low → High = 80,630 → 90,588
Fib Level Price
38.2% 86,960
50.0% 85,609
61.8% 84,258
🟩 Golden Zone: 86.9k – 84.2k
(Current price is sitting at the top of the Golden Zone)
This is a classic re-accumulation zone after a sell-off.
⸻
4. High-Probability Trade Scenarios
📈 BUY Scenario (Primary Bias)
Zone: 86,900 – 84,300 (Golden Zone / HTF demand)
Confirmation:
• 5M or 15M bullish BOS from the zone
• Rejection wick + volume increase
Targets:
• 88,100
• 89,400
• 90,600
• 93,900 (if weekly breakout occurs)
Invalidation: Daily close below 84,000.
⸻
📈 BUY Breakout
Trigger: Break & hold above 88,800
Retest: 88,200–88,500 holding
Targets: 90,600 → 93,900 → 98,800
⸻
📉 SELL Scenario (Countertrend)
Only valid on rejection from 88.6k–90.6k.
Targets: 87,200 → 86,400 → 85,600
Invalidation: Break above 90.6k.
⸻
📉 SELL Breakdown
Trigger: Daily close below 84,000
Targets: 82,000 → 80,600 → 76,000
This would signal a deeper macro correction.
⸻
5. Fundamental Watch
• Bank holiday liquidity → false moves possible.
• No major crypto or macro catalysts scheduled.
• ETF flows + risk sentiment likely dominate next week.
⸻
6. Key Technical Levels
Resistance
• 88,100
• 88,800
• 90,600
• 93,900
Support
• 86,900
• 86,400
• 85,600
• 84,300
• 80,600
⸻
7. Analyst Summary
BTCUSD is not bearish — it is correcting inside a long-term bull market.
The sell-off has done its job. The market is now compressing above HTF demand and preparing for its next directional move.
This is a classic:
Sell-off → Stabilisation → Accumulation → Expansion structure.
⸻
8. Final Bias Summary
🟢 Short-term bias: Neutral → Bullish above 86.4k
🟢 Weekly bias: Bullish recovery unless 84k breaks
🔴 Bearish only if: Daily close < 84k
Primary expectation for next week:
👉 Range early → liquidity sweep → bullish continuation toward 90.6k+.
⸻
✅ Conclusion
• The downside is largely exhausted.
• Smart money is building positions in the 86k–84k zone.
• The next clean break is likely up, not down.
Patience + confirmation buys > aggressive sells.
⸻
🥇 ElDoradoFx PREMIUM 3.0 – PERFORMANCE 24/12/2025 🥇
⚡ Precision execution. Swing objectives completed.
📈 BUY +40 PIPS
⚖️ SELL – BE
❌ SELL −40 PIPS (SL)
📉 SELL +20 PIPS
📈 BUY +90 PIPS
📉 SELL +210 PIPS
📉 SELL +20 PIPS
━━━━━━━━━━━━━━━
💎 SWING TRADES – FULL TP HIT
• Entry 3959 ➤ +5,410 pips
• Entry 4000 ➤ +5,000 pips
• Entry 4124 ➤ +3,760 pips
• Entry 4275 ➤ +2,250 pips
• Entry 4293 ➤ +2,070 pips
• Entry 4325 ➤ +1,750 pips
• Entry 4406 ➤ +940 pips
📊 Swing Total: +21,180 pips
━━━━━━━━━━━━━━━
💰 DAY RESULT: +340 PIPS
(BE excluded, SL deducted)
🎯 6 Counted Signals → 5 Wins | 1 SL
🔥 Accuracy: 83%
━━━━━━━━━━━━━━━

ElDoradoFx – BTCUSD ANALYSIS (22/11/2025, WEEKEND)1. Market Overview
BTCUSD continues in a strong downtrend from the 113k top, now trading around 84,000 after a sharp selloff. Price is sitting near the lower side of the descending channel and just above the key support band 83,500–83,400, with momentum still bearish but short-term showing signs of exhaustion / potential corrective bounce.
⸻
2. Technical Breakdown
🕐 Daily (D1)
• Clear bearish structure: consecutive lower highs and lower lows from ~113k.
• Price trades well below 20/50/100/200 EMAs, confirming dominant downtrend.
• Current D1 candle sitting near the prior “Sweep” zone around 83–81k.
• RSI oversold (~22–25) and MACD deeply red → trend strong but stretched; space for corrective rally before next leg down.
🕐 H1
• Price moving inside a falling channel, last swing low near 81–82k, last swing high around 88–89k.
• EMAs (20/50) below 200 EMA, slightly flattening → trend still down, momentum slowing.
• Small BOS to the upside from the last swing low, but still capped under H1 supply 84.8–85.7k.
• MACD shows bullish divergence vs the recent low → supports idea of pullback toward Fib zone before possible continuation.
🕐 15M–5M
• Intraday price is ranging 83.7–84.3k, forming minor higher lows.
• MACD positive, RSI hovering around 50 → short-term neutral / corrective phase.
• Still trading inside H1 downtrend and below intraday supply 84.8–85.2k.
⸻
3. Fibonacci Analysis
Last clear swing on H1:
• Swing High ≈ 88,700
• Swing Low ≈ 81,300
Fibonacci retracement (bearish pullback):
• 38.2% ≈ 84,120
• 50.0% ≈ 84,990
• 61.8% ≈ 85,870
🎯 Fibonacci Golden Zone: 84,100 – 85,900
This aligns with H1 supply and descending trendline → high-interest sell zone for continuation.
⸻
4. High-Probability Trade Scenarios
📉 A. Trend SELL from Golden Zone (Main Setup)
• Sell Zone: 84,500 – 85,500 (Fib 0.5–0.618 + H1 supply / trendline)
• Initial Targets:
• TP1: 83,500
• TP2: 82,500
• TP3: 81,000
• Extended: 80,600 (prior strong low)
• Stop Loss: Above 86,200
• Confirmation:
• Rejection candle / bearish engulfing in zone
• RSI H1 staying below 55 and MACD crossing back bearish.
• Idea: Primary play is to sell the corrective rally back into the golden zone in line with the dominant downtrend.
⸻
💥 B. Breakout SELL Setup (Continuation)
• Break Sell Trigger (Breaking Price):
• Clean H1 close below 83,450
• Retest Sell Zone: 83,450 – 83,800
• Targets:
• TP1: 82,500
• TP2: 81,000
• TP3: 80,600
• Stop Loss: Above 84,300
• Note: Use if price fails to reach the golden zone and instead breaks the current base directly.
⸻
📈 C. Countertrend BUY from Support (Scalp / Secondary)
• Buy Zone: 83,500 – 83,400 (top of strong support / range low)
• Targets:
• TP1: 84,500
• TP2: 85,500
• TP3: 86,800 (toward top of golden zone / trendline)
• Stop Loss: Below 82,800
• Confirmation:
• Bullish divergence on 15M/5M
• Strong wick rejection from 83.4–83.5k.
• ⚠️ Countertrend only – use reduced risk; objective is to catch corrective leg back into the golden zone.
⸻
🚀 D. Breakout BUY Setup (Structure Shift)
• Break Buy Trigger (Breaking Price):
• H1 close above 85,800 (clear break of Fib 0.618 + channel / supply)
• Retest Buy Zone: 85,800 – 86,000
• Targets:
• TP1: 87,500
• TP2: 89,500
• TP3: 91,300
• Stop Loss: Below 85,000
• Idea: This would be an early trend-change signal; only valid if volume and momentum (RSI > 60 on H1) confirm the break.
⸻
5. Fundamental Watch
• Weekend conditions → thin liquidity & gap risk between Sunday open and Monday session.
• BTC remains highly sensitive to US macro data and risk sentiment (equities, DXY, yields). Any upcoming high-impact USD events next week (CPI, PCE, Fed speakers, etc.) can accelerate either continuation or reversal.
• For swing positions, plan size so you can hold across potential gaps, or close before the weekend if uncomfortable with risk.
⸻
6. Key Technical Levels
• Resistance:
• 84,800
• 85,500–85,900 (Golden Zone upper)
• 87,500
• 90,000
• Support:
• 83,450
• 82,500
• 81,000
• 80,600 (major prior low)
• Golden Zone (Short): 84,100 – 85,900
• Break Buy Trigger: > 85,800 (H1 close)
• Break Sell Trigger: < 83,450 (H1 close)
⸻
7. Analyst Summary
• Structure from D1 to H1 is decisively bearish.
• Current consolidation around 84k looks like a pause within the downtrend, not yet a confirmed bottom.
• The highest-probability play remains selling rallies into the Fib Golden Zone (84.5–85.5k), aiming for new lows towards 82.5–81k → 80.6k.
• Countertrend buys are possible off 83.5–83.4k, but only for quick scalps with tight risk.
⸻
8. Final Bias Summary
• Bearish Bias (Primary):
• Valid while price stays below 85.7–86k.
• Prefer Sell Golden Zone and Breakout Sell < 83,450 setups.
• Bullish Bias (Alternative / Reversal):
• Consider only if H1 closes above 85,800 and retest holds.
• Then target 87.5k → 89.5k → 91.3k with higher-timeframe confirmation.
Manage risk: fixed % per trade, no over-leveraging, and be careful holding full size over the weekend gaps. 🚨
⸻
🥇 ElDoradoFx PREMIUM 3.0 – PERFORMANCE 21/11/2025 🥇
🔥 Precision • Momentum • Profit
━━━━━━━━━━━━━━━
📊 XAU/USD – DAILY RESULTS
🟢 BUY +50 PIPS
🔻 SELL +20 PIPS
🟢 BUY +210 PIPS
🟢 BUY +210 PIPS
🟢 BUY +20 PIPS
❌ SELL -40 PIPS (SL)
🟢 BUY +220 PIPS
🔻 SELL LIMIT +210 PIPS
━━━━━━━━━━━━━━━
🔝 SWING TRADES – STILL RUNNING
📈 BUY → +2,850 PIPS
📈 BUY → +1,320 PIPS
━━━━━━━━━━━━━━━
💰 TOTAL PIPS GAIN: +900 PIPS
🎯 8 Signals → 7 Wins (1 SL)
🔥 Win Accuracy: 88%
━━━━━━━━━━━━━━━
Strong close to the week — perfect blend of scalps, intraday setups, and powerful swing continuation!
Congrats if you profited — PREMIUM 3.0 keeps delivering results! 🚀💰
— ElDoradoFx PREMIUM 3.0 Team 🚀

The logic for going long on BitcoinETF outflows ≠ bearish sentiment; OTC market is secretly maneuvering
The Bitcoin ETF has seen a cumulative outflow of $2.8 billion in the past month. This is not an indication of institutional bearishness; rather, it is a shift of funds from "off the books" to "on the books". Major banks such as JPMorgan Chase and Goldman Sachs have taken positions through the OTC market, with the volume of off-exchange transactions surging by 78% in 30 days. This was done to circumvent the restrictions of ETF subscription and redemption rules. This "openly reducing while secretly increasing" pattern occurred at the bottom of the bear market in March 2020 and led to a 170% increase in Bitcoin prices over the following 6 months. Data from Bitfinex shows that the balance of wallets holding over 10,000 Bitcoin decreased by only 1.5% in October. This was not a panic sell-off; rather, it was a gradual profit-taking in the context of weak ETF demand, resetting positions for the next rally.
Bitcoin trading strategy
buy:95500-96500
tp:98000-99000
sl:94000

ElDoradoFx – BTCUSD WEEKEND ANALYSIS (15/11/2025)1️⃣ Market Overview
BTC ends the week around 95,700, continuing its strong bearish structure after the previous breakdown below 98,000. Price remains trapped inside a clear descending channel, forming consistent lower highs and lower lows on all timeframes.
The market attempted a recovery but was rejected again at 95,900–96,200, confirming ongoing seller control. Volume remains low heading into the weekend, increasing the risk of liquidity sweeps.
Bias remains bearish while BTC trades below 96,800.
⸻
2️⃣ Technical Breakdown
🔹 Daily (D1)
• Market remains in a sustained downtrend.
• Price rejected from the daily 20EMA and 50EMA zone.
• MACD continues deep in red, no bullish crossover yet.
• RSI ≈ 32–40 → still bearish, pointing toward deeper downside liquidity.
D1 Structure:
Lower high → lower low → continuation towards 94,000 and 93,000 liquidity.
⸻
🔹 H1 (1H)
• Bearish order flow intact.
• Every bullish pullback has been rejected at the 20/50EMA cluster.
• Trendline resistance near 96,200 holds perfectly.
• BOS confirmed to the downside at 95,600.
H1 Bias:
Bearish continuation unless a 1H close above 96,200–96,600.
⸻
🔹 15M–5M (Intraday)
• Micro pullbacks forming lower highs around 95,900.
• Supply zone between 95,900–96,150 producing multiple rejections.
• MACD shows short-lived bullish pushes with no follow-through.
• RSI capped under 50.
Intraday Bias:
Sell pullbacks into supply; avoid buying unless bullish confirmation appears.
⸻
3️⃣ Fibonacci Analysis (Last Swing)
Swing High → 96,800
Swing Low → 94,000
• 38.2% = 95,450
• 50.0% = 95,400
• 61.8% = 95,950
🎯 Golden Zone (Key Rejection Area): 95,400 – 95,950
This zone has already produced strong bearish reactions → high-probability sell zone.
⸻
4️⃣ High-Probability Trade Scenarios
📉 SELL SETUP (Primary Bias – HIGH PROBABILITY)
Sell Zone: 95,400 – 95,950 (Golden Zone)
Entry: Wait for rejection candle or bearish engulfing.
🎯 Targets:
• TP1: 94,800
• TP2: 94,000
• TP3: 93,200 (liquidity zone)
• TP4: 92,500
🛑 Stop Loss: Above 96,250
Why?
Golden Zone retest + downtrend + EMA alignment + channel resistance.
⸻
📉 Breakout Sell Setup (Continuation)
Trigger: Break & close below 94,800
Retest: 94,900–95,050
🎯 Targets:
• 94,000
• 93,200
• 92,500
🛑 Stop Loss: Above 95,400
⸻
📈 BUY SETUP (Countertrend – Lower Probability)
Buy Zone: 94,000 – 93,200
🎯 Targets:
• 95,000
• 95,800
• 96,200
🛑 Stop Loss: Below 92,800
⚠️ Note: Structure remains bearish → buy setups require bullish divergence.
⸻
5️⃣ Fundamental Watch
• Weekend liquidity low → expect stop hunts and fakeouts.
• No major news until early next week (US retail, FOMC speakers).
• DXY remains strong → pressures BTC further.
• Risk markets soft overall → crypto remains vulnerable.
⸻
6️⃣ Key Technical Levels
🔺 Resistance:
• 95,950
• 96,200
• 96,800 (bullish breakout level)
• 97,500
🔻 Support:
• 94,800
• 94,000
• 93,200
• 92,500 (liquidity + structure)
🌟 Golden Zone:
95,400 – 95,950
Breakout Triggers:
• Bullish Breakout: Above 96,800
• Bearish Breakout: Below 94,800
⸻
7️⃣ Analyst Summary
BTC maintains a strong bearish structure across all timeframes. Every bounce is corrective, and sellers remain dominant below 96,800.
The market is gravitating toward 94,000 and possibly 93,200 liquidity.
Best trade:
Sell the Golden Zone 95,400–95,950
or
Sell the breakdown 94,800.
Buying only makes sense at 94,000–93,200 with strong confirmation.
⸻
8️⃣ Final Bias Summary
Overall Bias: Bearish
• Below 96,800 → Sell rallies (preferred).
• Below 94,800 → Continuation to downside.
• Above 96,800 → Bullish shift begins.
⸻
🥇 ElDoradoFx PREMIUM 3.0 – PERFORMANCE 14/11/2025 🥇
📅 High-volatility day with mixed conditions, but strong recoveries and powerful live-session results.
━━━━━━━━━━━━━━━
🪙 XAU/USD (GOLD) Trades
❌ BUY –60 PIPS (SL)
🟢 BUY +110 PIPS
🟢 BUY LIMIT +60 PIPS
🟢 SELL +110 PIPS
❌ BUY –70 PIPS (SL)
🟢 BUY +110 PIPS
---
🎥 LIVE TRADING SESSION
🟡 BUY – BE
🟢 SELL +250 PIPS
❌ BUY –40 PIPS (SL)
🟢 BUY +60 PIPS
🟡 SELL – BE
🟢 SELL +180 PIPS
---
📈 SWING POSITION (From 05/11)
🟩 Floating: +2,850 PIPS
Still running strong.
━━━━━━━━━━━━━━━
💰 TOTAL PIPS GAIN: +710 PIPS
━━━━━━━━━━━━━━━
📊 12 Signals → 7 Wins | 3 SL | 2 BE
🎯 Accuracy: 70%
━━━━━━━━━━━━━━━
🔥 Another profitable day locked in.
👏 Congratulations if you profited!
✅✅✅🚀🚀🚀
— ElDoradoFx PREMIUM 3.0 Team 💼📈

ANFIBO | BTCUSD - $94.000 or $70.000? [11.6.2025]Hi traders, Anfibo's here!
BTCUSD – Technical Outlook
Technical Structure:
Price action currently respects a descending channel, with:
- Upper boundary (resistance): around $106,000 – $107,000
- Lower boundary (support): converging with the D1 trendline and the 0.618 Fibonacci retracement zone, located between $94,000 – $95,000
This confluence area at $94,000 – $95,000 will be crucial. It not only represents technical alignment between multiple structures (Trendline + Fibonacci) but also marks the boundary where short-term sentiment could shift from corrective to impulsive.
Trading Strategy:
Our tactical approach remains straightforward and adaptive:
“Trade the trend when touched – reverse the bias if the trend breaks.”
#1 – Rejection at Upper Boundary:
Should BTC retest the 106–107k resistance and fail to break through, short-term sell opportunities may arise targeting the mid-range or lower boundary (95k region).
#2 – Reaction at Lower Boundary:
If price reaches the 94–95k support zone and holds, this area could offer high-probability long entries, particularly if accompanied by bullish divergence or strong volume confirmation.
#3 – Breakdown of Structure:
A clean break below $90,000 would signal structural weakness, exposing BTC to the next major support cluster between $80,000 and $70,000. Such a move would represent a deeper corrective leg in the broader cycle and could reset the market’s medium-term trend.
Trading Plan:
>>> SELL ZONE: (x1000)
ENTRY: 106 - 108
SL: 109
TP: 95
>>> BUY ZONE:(x1000)
ENTRY: 93 - 95
SL: 90
TP: 120
Risk Management:
- Stick to small-to-medium positions within the range; increase size only on confirmed breakouts.
- Keep stops tight, as sideways phases tend to trigger false signals.
- Maintain Risk:Reward ≥ 1:2 and avoid overtrading in choppy conditions.
- Reassess bias once the channel is clearly broken.
Conclusion:
BTC is currently in a compressed, corrective phase, moving within a defined range. The key battleground lies between $95,000 and $107,000. Traders should remain flexible, respecting both boundaries of the channel and reacting based on breakout confirmations rather than anticipation.
As long as BTC holds above the $94,000 – $95,000 confluence, the broader bullish structure on the daily timeframe remains intact. However, a decisive break below $90,000 would open the door for a larger-scale correction toward the $80,000 - $70,000 zone—where long-term accumulation could once again become attractive.
GOODLUCK GUYS!!!

ElDoradoFx – BTCUSD ANALYSIS (09/11/2025, WEEKEND EDITION) (09/11/2025, WEEKEND EDITION)
⸻
1. Market Overview
Bitcoin (BTCUSD) remains under bearish pressure around $101,500, extending its correction from the recent $103,800 recovery peak. Price action confirms a sustained rejection at the $102,600–$103,000 supply zone, with downside continuation now favored as sellers maintain control.
The broader market context shows BTC trapped between the $102,600 ceiling and $99,200 floor, forming a descending channel. Unless bulls reclaim $102,600+, momentum remains bearish heading into next week’s macro calendar (CPI & PPI releases).
⸻
2. Technical Breakdown
🔹 Daily (D1):
• BTC continues trading below the 20EMA, 50EMA, and 100EMA — confirming sustained bearish structure.
• RSI ~38, indicating weak momentum and no signs of trend reversal.
• MACD histogram continues printing red bars, showing continuous sell-side pressure.
• Price remains within a macro range between $99,000–$108,000, with downside favored until structure shifts.
🔹 H1:
• Strong rejection from descending trendline at $102,300–$102,600.
• CHoCH confirmed to the downside below $101,800.
• EMAs aligned bearish (20 < 50 < 200).
• RSI below 45; MACD momentum fading — signals bearish continuation likely.
🔹 15M–5M:
• Structure shows lower highs and weak pullbacks.
• Minor demand zone at $101,000–$100,900; break of this level could trigger a liquidity sweep toward $99,200.
• RSI near 36 with weak MACD cross — short-term bounce possible but unsustainable without strong volume.
⸻
3. Fibonacci Analysis (Last Swing: 103,896 → 99,249)
Level Price (USD) Comment
38.2% 101,037 First retracement / initial resistance
50.0% 101,570 Mid-zone equilibrium
61.8% 102,090 Key reaction level within supply zone
🎯 Golden Zone: 101,000 – 102,090 → Acting as intraday supply zone for high-probability sells.
⸻
4. High-Probability Trade Scenarios
📉 Bearish Continuation Setup (Main Bias)
• Entry Zone: 101,900 – 102,400 (Golden Zone retest)
• TPs: 101,000 → 100,000 → 99,200 → 98,800
• SL: Above 102,600
• Confirmation: Rejection candle + RSI failure to cross 50
• Rationale: Retest of former support turned resistance within descending structure; EMAs and momentum indicators favor continuation.
💥 Breakout SELL Setup
• Trigger: 1H candle close below 100,900
• Retest Zone: 101,100 – 101,300
• TPs: 100,000 → 99,200 → 98,500
• SL: Above 101,600
• Rationale: Structural break of key demand; confirms continuation of broader downtrend.
📈 Countertrend BUY Setup (Low Probability)
• Entry Zone: 99,200 – 98,900 (Liquidity Sweep Zone)
• TPs: 100,800 → 101,600 → 102,400
• SL: Below 98,700
• Confirmation: Bullish divergence on RSI or MACD + absorption wicks
• Rationale: Potential liquidity collection zone where short covering may occur; low conviction long setup.
⸻
5. Fundamental Watch
• Weekend volatility remains thin; potential for stop-hunts before Monday’s open.
• DXY holding above 105 supports bearish sentiment in BTC.
• No major macroeconomic catalysts until early next week — expect range-bound but reactive price behavior.
• CME futures gap near $102,800 could attract a brief fill before resumption lower.
⸻
6. Key Technical Levels
Type Levels (USD)
Resistance 102,400 / 102,600 / 103,000 / 105,800
Support 101,000 / 100,000 / 99,200 / 98,900
Golden Zone 101,000 – 102,090
Break Buy Trigger > 102,600
Break Sell Trigger < 100,900
⸻
7. Analyst Summary
BTC is consolidating under the 102K–103K ceiling, showing clear exhaustion from buyers and renewed strength from sellers. The Golden Zone (101,000–102,090) offers the highest-probability sell opportunities for continuation to 99K.
Momentum, EMAs, and trend alignment all support a bearish outlook unless price cleanly reclaims 102,600+ on H1 structure.
⸻
8. Final Bias Summary
✅ Primary Bias: Bearish below 102K — selling rallies within the 101–102K zone targeting 99K.
⚠️ Secondary Bias: Bullish recovery only if 102,600 breaks with volume and structure shift confirmed.
⸻
— ElDoradoFx PREMIUM 3.0 Team 🚀
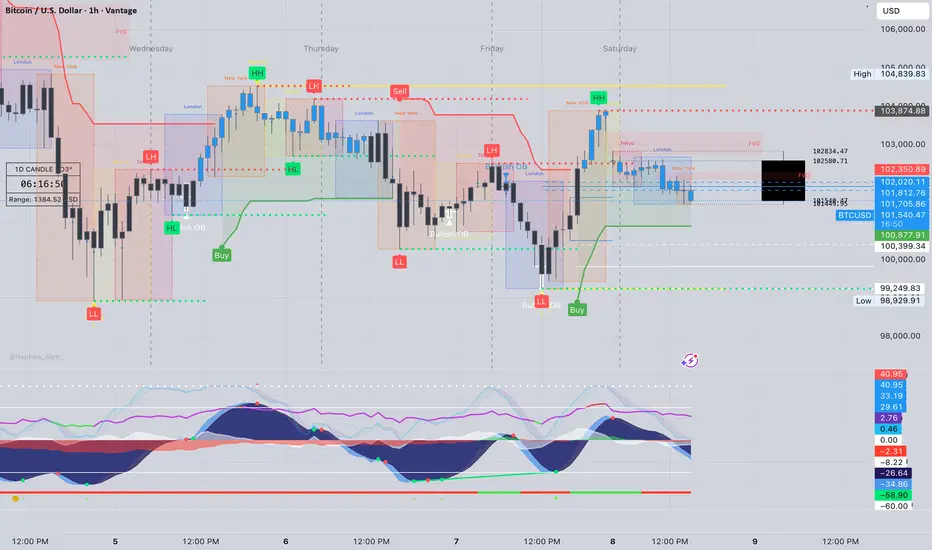
ElDoradoFx – BTCUSD ANALYSIS (08/11/2025, ASIA SESSION)1. Market Overview
BTCUSD is trading around $103,800, posting a strong rebound from the $99,200 liquidity sweep earlier in the week. The bullish momentum is driven by the reclaim of short-term structure and EMA crossovers on intraday charts. While the recovery is technically healthy, BTC now approaches critical resistance between $104,800–$105,400, where rejection or liquidity grabs could occur before continuation.
⸻
2. Technical Breakdown
🔹 Daily (D1):
• The daily structure shows a bullish CHoCH from the 99K demand sweep.
• RSI has recovered from oversold (now 41.2), signaling early trend recovery.
• MACD histogram tightening — selling momentum fading.
• Price is still below the 100EMA (~108K), so overall macro bias remains neutral until 105K–108K is cleared.
🔹 H1:
• Clear BOS confirmed with a sequence of higher highs and higher lows.
• EMAs aligned bullish (20 > 50 > 200).
• RSI near 66, showing strong intraday bullish strength.
• MACD positive, confirming momentum favoring the upside.
🔹 15M–5M:
• Strong intraday trend channel formed with consistent BOS toward 103,800.
• RSI approaching 70 — minor exhaustion likely.
• Pullback to 102,200–101,900 expected before next impulsive wave.
⸻
3. Fibonacci Analysis (Last Swing: 99,249 → 103,895)
Level Price (USD) Note
38.2% 102,200 First retracement area
50.0% 101,570 Mid-zone equilibrium
61.8% 100,940 Strong support confluence
🎯 Golden Zone: 102,200 – 100,940 → Potential re-entry area for continuation buys.
⸻
4. High-Probability Trade Scenarios
📈 Bullish Continuation Setup (Main Bias)
• Entry Zone: 102,200 – 100,940 (Fibonacci Golden Zone)
• TPs: 103,800 → 104,800 → 105,400 → 106,000
• SL: Below 100,600
• Confirmation: Bullish engulfing candle or RSI bounce from 50–55
• Rationale: Break of structure + bullish EMA alignment + increasing volume.
💥 Breakout BUY Setup
• Trigger: 1H close above 104,000
• Retest Zone: 103,800–103,600
• TPs: 104,800 → 105,400 → 106,500
• SL: Below 103,200
📉 Bearish Countertrend Setup
• Entry Zone: 104,800 – 105,400 (Major resistance)
• TPs: 103,800 → 103,000 → 102,200
• SL: Above 105,600
• Confirmation: RSI divergence or bearish engulfing candle on H1/H4
• Rationale: Liquidity trap possible at 105K; short-term overextension.
⸻
5. Fundamental Watch
• Weekend sessions = low liquidity → prone to manipulation and stop hunts.
• DXY holding above 105, limiting BTC upside in the medium term.
• No major US macro data releases until early next week (CPI & PPI).
• Expect Asian session volatility spikes between 1 AM–5 AM UTC.
⸻
6. Key Technical Levels
Type Levels (USD)
Resistance 104,000 / 104,800 / 105,400 / 106,000
Support 103,000 / 102,200 / 100,940 / 99,200
Golden Zone 102,200 – 100,940
Break Buy Trigger > 104,000
Break Sell Trigger < 101,000
⸻
7. Analyst Summary
BTC shows a clean short-term bullish reversal from the 99K base, supported by strong momentum and structure recovery. However, traders should watch closely the 104,800–105,400 zone — a key liquidity cluster where potential profit-taking or rejection could occur.
Pullbacks into 102,200–100,940 remain ideal buy-the-dip zones, targeting 105K+ extension. A confirmed H1 close below 101K would invalidate this bullish bias and reintroduce downside risk.
⸻
8. Final Bias Summary
✅ Primary Bias: Bullish above 102K (Buy dips toward 102,200–100,940)
⚠️ Secondary Bias: Bearish only if rejection forms at 105,400 or break below 101K
⸻
🥇 ElDoradoFx PREMIUM 3.0 – PERFORMANCE 07/11/2025 🥇
📅 Precision. Profit. Live Execution.
━━━━━━━━━━━━━━━
🪙 XAU/USD (GOLD)
🔻 SELL +60 PIPS
🟢 BUY +40 PIPS
🟢 BUY +90 PIPS
❌ BUY -40 PIPS (SL)
🟢 BUY +120 PIPS
---
▶ LIVE TRADING SESSION RESULTS
💥 BUY +100 PIPS
💥 BUY +125 PIPS
💥 BUY +150 PIPS
🧠 Our live sessions continue to deliver consistent profits — traders learned in real-time how to identify clean entries, scale in safely, and secure profits like pros.
━━━━━━━━━━━━━━━
💰 TOTAL PIPS GAIN: +645 PIPS
📊 8 Trades → 7 Wins | 1 SL
🎯 Accuracy: 87%
━━━━━━━━━━━━━━━
🔥 Another powerful day for ElDoradoFx Premium 3.0 — combining analysis, education, and execution all in one live environment.
📈 If you’re not joining the live sessions yet, you’re missing real-time profitable setups every day.
👏 Congratulations if you profited! ✅✅✅🚀🚀🚀
— ElDoradoFx PREMIUM 3.0 Team 💼📊
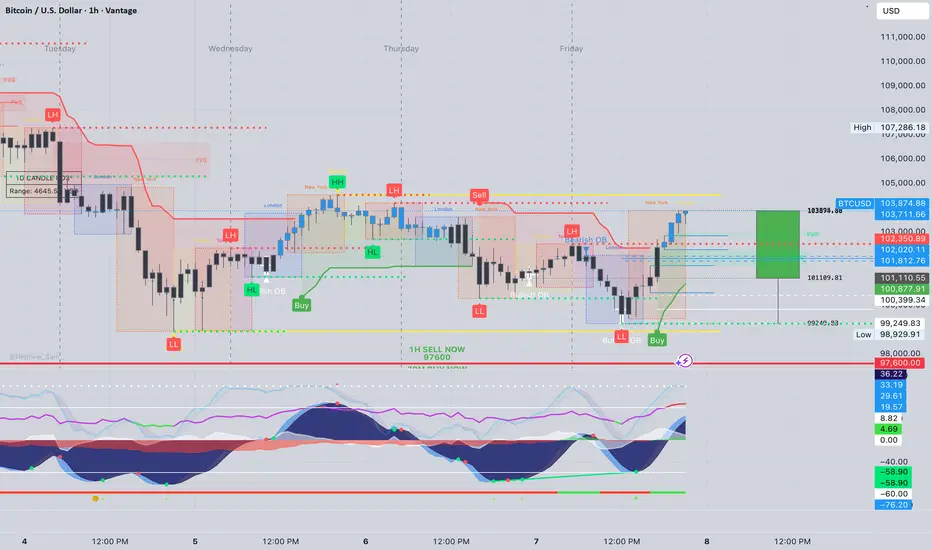
BTCUSD – DAILY PROFESSIONAL ANALYSIS (04 NOV 2025)Prepared by: ElDoradoFx PREMIUM 3.0 Analyst Desk
⸻
🧭 1️⃣ Market Overview
Bitcoin has experienced a strong bearish continuation, breaking decisively below the key structural support at 108,200, confirming a shift in market sentiment. The break of structure (BOS) at 109,600 turned the mid-term bias bearish, with price now testing the psychological level at 100,000.
RSI is at 32 on the daily chart, showing near-oversold conditions, but momentum remains heavy to the downside. Unless bulls reclaim 101,000–102,000, sellers are likely to continue dominating toward 98,600–97,000.
⸻
📊 2️⃣ Technical Breakdown
🔻 Daily (D1)
• Price broke below the long-term ascending trendline from August.
• EMAs aligned for bearish continuation (20 < 50 < 200).
• RSI 32 → weak recovery potential but still room for downside liquidity sweep.
→ Interpretation: Bears fully in control until 102,000 is reclaimed.
🔻 1-Hour (H1)
• Descending channel intact; price rejected from supply zone 101,200–101,600.
• RSI hovering around 30–40; possible minor retracement before further drop.
• MACD still printing red histogram bars → bearish momentum active.
→ Interpretation: Look for short opportunities near resistance retests.
⚠️ 15M–5M (Intraday)
• Price formed a small double bottom near 99,550, showing temporary relief bounce.
• RSI rebounding, but no confirmation of reversal.
• EMA50 (H1) around 101,000 acting as dynamic resistance.
→ Interpretation: Possible short-term correction before continuation down.
⸻
📐 3️⃣ Fibonacci Analysis
Swing Range: 104,839 → 99,559
Level Price Observation
38.2% 101,455 Minor retracement zone
50.0% 102,200 Key confluence with EMA50
61.8% 102,950 Strong resistance zone for potential short re-entry
✅ Golden Zone: 101,455 – 102,950
This is the ideal sell re-entry area if price pulls back.
⸻
🎯 4️⃣ High-Probability Trade Scenarios
🔻 SELL SETUP (PRIMARY BIAS)
Scenario A – Golden Zone Retest
• Entry: 101,455–102,950 (Fibonacci + EMA confluence)
🎯 TP1 → 100,000 TP2 → 99,000 TP3 → 97,000
🛑 SL → Above 103,300
Scenario B – Continuation Breakout
• Trigger: Break & retest below 99,550
🎯 TP1 → 98,600 TP2 → 97,000 TP3 → 95,800
🛑 SL → Above 100,300
⸻
🟢 BUY SETUP (ALTERNATIVE SCENARIO)
Scenario A – Support Reversal Zone
• Entry: 99,550–98,600 (if strong bullish reaction with engulfing candles)
🎯 TP1 → 101,000 TP2 → 102,000 TP3 → 103,000
🛑 SL → Below 98,200
⸻
🕐 5️⃣ Fundamental Watch
• US yields rising and DXY strengthening above 105.2 → bearish pressure on BTC.
• Market sentiment risk-off due to global equity weakness.
• Watch upcoming US Unemployment & CPI data — could trigger volatility reversal.
⸻
⚙️ 6️⃣ Key Technical Levels
Type Levels
Resistance 101,455 / 102,200 / 102,950
Support 99,550 / 98,600 / 97,000
Golden Zone 101,455 – 102,950
Breakout Confirmation Below 99,550 or Above 103,000
⸻
🧾 7️⃣ Analyst Summary
BTC confirmed a bearish structure, with short-term retracements expected toward the Golden Zone (101,455–102,950) before further downside continuation. Momentum indicators still favor sellers, though oversold readings could create minor pullbacks. Until 103,000 is broken to the upside, bias remains bearish.
⸻
📈 8️⃣ Final Bias Summary
🔻 Bearish below 102,000 → Targets 99,000 / 97,000 / 95,800
🟢 Bullish only above 103,000 → Targets 104,800 / 106,000
⸻
— ElDoradoFx PREMIUM 3.0 Team 🚀

BTC/USD POTENTIAL BULLISH REVERSAL SETUPAnalysis:
Bitcoin (BTC/USD) is currently consolidating near the $106,800 area after a strong bearish move that broke multiple structures. The chart shows clear Smart Money Concepts (SMC) signals such as Change of Character (CHoCH) and Break of Structure (BOS), indicating the end of the recent downtrend and the potential start of accumulation before a bullish correction.
After liquidity was collected below the Equal Lows (EQL) near $106,000, buyers have begun to show interest, forming a potential reversal pattern. Price is now reacting to a demand zone and showing early bullish signs.
Key Technical Highlights:
Market Structure: After a strong bearish break, BTC is forming a base with BOS confirmation — signaling possible trend reversal.
Equal Lows (EQL): Liquidity has been swept below $106,000, suggesting institutional accumulation.
Entry Zone: Around $106,600 – $106,800 (after minor pullback and confirmation).
Target Zone: $108,500 – $109,700, aligning with the next supply area and previous structural highs.
Stop-Loss Area: Below $105,500, under the liquidity sweep zone for safety.
Bias:
Bullish (short-term) — as long as price holds above $106,000, BTC is likely to continue toward $109,000+.
BTC/USD is showing early signs of reversal after liquidity collection below key lows. A pullback toward $106,500 could offer an ideal long entry opportunity, with upside targets around $109,700. Traders should watch for bullish confirmation before entering to validate momentum continuation.

ElDoradoFx – BTCUSD WEEKEND ANALYSIS (02/11/2025, US SESSION)
🧭 1️⃣ Market Overview
Bitcoin retraced after testing the intraday resistance near 111,238, facing rejection at the upper boundary of the descending channel. Price remains supported above 110,000, respecting both the dynamic ascending trendline and 200 EMA on intraday charts. Momentum has cooled but the market still holds a mildly bullish structure unless 109,700 breaks. Volatility is expected to remain moderate heading into early-week sessions.
⸻
📊 2️⃣ Technical Breakdown
✅ Daily (D1)
• Structure: Rangebound between 108,300 and 111,800.
• EMAs: Price hovering between 50 and 200 EMA, equilibrium zone.
• RSI (47): Neutral – no divergence.
• MACD: Histogram flattening; momentum loss after prior bullish impulse.
→ Interpretation: Consolidation phase, waiting for directional breakout.
✅ 1-Hour (H1)
• Clean BOS from 109,600 led to impulsive rise to 111,200.
• Currently retracing toward the 50 EMA and trendline support.
• Key support: 110,100–109,900.
→ Interpretation: Market retesting support after profit-taking; potential bullish re-entry if structure holds.
✅ 15M–5M (Intraday)
• Price rejecting 111,238 and forming short-term lower highs.
• RSI rebounding from 35 – possible micro bullish correction.
• MACD showing first red bars, indicating short-term retracement nearing exhaustion.
→ Interpretation: Possible liquidity sweep around 110,000 before upward continuation.
⸻
📐 3️⃣ Fibonacci Analysis
Swing Range: 109,703 → 111,238
Level Price Observation
38.2% 110,671 Minor support zone
50.0% 110,470 Golden mid-level + EMA confluence
61.8% 110,268 Trendline & structural confluence
✅ Golden Zone: 110,671 – 110,268 (high-probability buy zone)
⸻
🎯 4️⃣ High-Probability Trade Scenarios
🟢 BUY SCENARIOS (Primary Bias)
Scenario A – Golden Zone Reversal (Ideal Setup)
• Entry Zone: 110,671 – 110,268
🎯 TP1 → 111,000 TP2 → 111,238 TP3 → 111,800
🛑 SL → Below 109,900
Scenario B – Breakout Continuation
• Trigger: Break & retest above 111,238
🎯 TP1 → 111,800 TP2 → 112,200 TP3 → 112,800
🛑 SL → Below 110,800
⸻
🔻 SELL SCENARIOS (Alternative)
Scenario A – Breakdown from Structure
• Trigger: Break & retest below 109,700
🎯 TP1 → 109,200 TP2 → 108,600 TP3 → 108,000
🛑 SL → Above 110,200
Scenario B – Rejection from 111,200–111,400 Zone
• Trigger: Bearish engulfing candle rejection.
🎯 TP1 → 110,600 TP2 → 110,000
🛑 SL → Above 111,500
⸻
🕐 5️⃣ Fundamental Watch
• Weekend volatility lower than average; price reactive to liquidity sweeps.
• DXY steady near 104.8 – neutral macro tone.
• ETF accumulation flows remain supportive for mid-term trend.
• Watch US macro data midweek (PMI & NFP) for volatility spikes.
⸻
⚙️ 6️⃣ Key Technical Levels
Type Levels
Resistance 111,238 / 111,800 / 112,200
Support 110,268 / 109,900 / 109,700
Golden Zone 110,671 – 110,268
Breakout Confirmation Above 111,238 or Below 109,700
⸻
🧾 7️⃣ Analyst Summary
BTC continues consolidating within a controlled retracement phase, currently resting in the Golden Zone (110,671–110,268) that aligns with the ascending trendline. Holding above this range favors bullish continuation, while a confirmed break below 109,700 would open downside space. Short-term trades favor long positions within the zone, targeting 111,200–111,800.
⸻
📈 8️⃣ Final Bias Summary
🟢 Bullish bias above 110,200 → Targets 111,200 / 111,800
🔻 Bearish bias below 109,700 → Targets 108,800 / 108,000
⸻

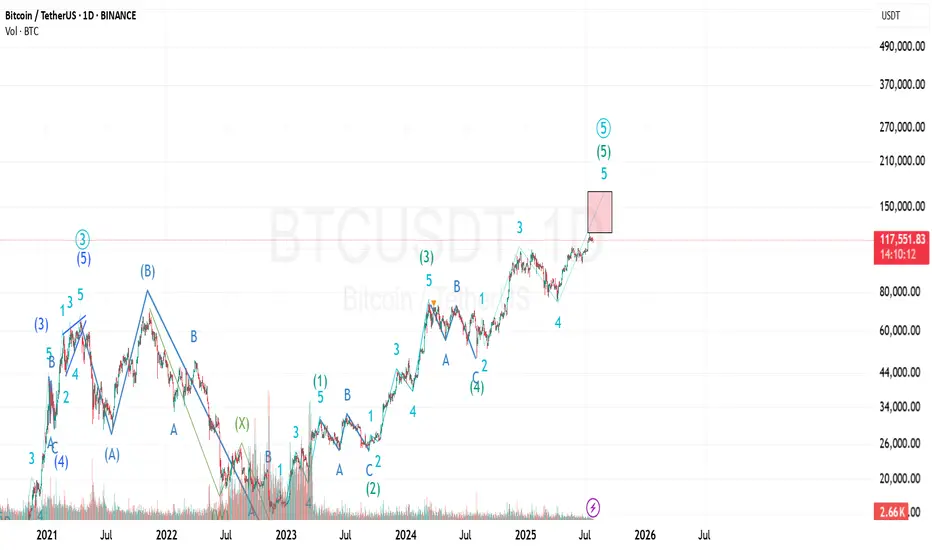
Bitcoin Prediction UpdateI've just modified the wave count and still the previous analysis is valid...
I'm not sure about the target of the last wave (the 5th of 5th wave) because it can be an extended wave...
The shown box is where I'll investigate to find any ending pattern...

BTCUSD SHORT OPPORTUTY FOR THE WEEKENDBITCOIN SUPPLY ZONE TARGETED - SELL LIMIT SET 🔥
BTC/USD has made a strong move upward but is now approaching a major supply zone, where a Sell Limit is placed at 110997. This level aligns with previous highs and signs of distribution, signaling a potential reversal ahead.
With current price action consolidating around 109034, we are watching for rejection and a possible drop towards the next demand zones at 108551 and 106178.
This setup is ideal for smart traders looking to short the top and ride the retracement. As always, risk management is key. Let’s see how the market reacts.
Precision over prediction. Strategy over emotions.
#BTCUSD #BitcoinAnalysis #CryptoTrading #SellLimit #SmartMoneyConcepts #SupplyAndDemand #TechnicalAnalysis #DayTrading #CryptoSetup #BTCTrade #BearishSetup #PriceAction #CryptoSniper #BitcoinReversal #TradingStrategy #CryptoTraders #MarketStructure #XAUkingCharts

Still bullish, it is recommended to focus on going long.Earlier, Bitcoin reached a weekly high of $106,518 before pulling back due to market liquidation, with total market liquidations exceeding $669 million. Bitcoin has closed higher for five consecutive weeks on the weekly chart, forming a "higher highs and higher lows" upward pattern, rising nearly 43.75% from its recent low. However, it encountered resistance near the all-time high of $109,588 and failed to break through. Currently, Bitcoin is trading in the $100,000-$110,000 range, with strong support at $100,000 and $90,000, and key resistance at $110,000.👉👉👉
After Bitcoin previously broke through $105,500, the moving averages showed an upward trend, and the RSI was in the overbought zone, indicating strong bullish momentum.
Overall, under the combined influence of news and technical factors, the Bitcoin market on May 19th showed a short-term volatile but long-term optimistic trend. Investors need to closely monitor changes in key support and resistance levels, as well as the impact of market news, and make investment decisions cautiously.
BTCUSD Trading Strategy
buy @ 102500-102700
sl 101000
tp 103800-104000
If you think the analysis helpful, you can give a thumbs-up to show your support. If you have different opinions, you can leave your thoughts in the comments. Thank you for reading!👉👉👉

Bitcoin remains in high-level fluctuationsThe price of Bitcoin has generally remained above $103,000 today, demonstrating strong support. In the short term, after experiencing previous fluctuations, Bitcoin is currently in a relatively stable upward trend and continues to move towards higher prices.👉👉👉
Global economic events have contributed to the rise of Bitcoin. The decision between China and the U.S. to temporarily reduce tariffs has improved investor confidence and encouraged market risk appetite, making funds more willing to flow into risky assets like Bitcoin.
From a technical perspective, Bitcoin is in a strong upward trend. The RSI is above 70, indicating that Bitcoin may be in an overbought state in the short term. This could lead to a slight pullback or sideways consolidation in the upcoming market to digest excessive buying pressure. Investors need to pay attention to potential pullback risks, while closely monitoring factors such as macroeconomic data, policy changes, and market capital flows to adjust investment strategies in a timely manner.
BTCUSD Trading Strategy
buy @ 102700-103000
sl 101000
tp 104000-104200
If you think the analysis helpful, you can give a thumbs-up to show your support. If you have different opinions, you can leave your thoughts in the comments. Thank you for reading!👉👉👉

Summary of Bitcoin Last WeekThe overall trend of the Bitcoin market shows a pattern of "first decline and then rise". The price has continuously broken through several key technical resistance levels, strongly breaking through the psychological barrier of the $100,000 mark and reaching a new stage high.👉👉👉
With the rise in price, the hash price of Bitcoin has steadily rebounded and is approaching the high range of the past month, rising for several consecutive days, indicating that the market demand for computing power resources remains robust.
Overall, after the previous fluctuations, the Bitcoin market has demonstrated strong resilience and optimistic expectations under the dominance of the bulls in the recent period. However, the cryptocurrency market is highly uncertain and risky, and investors still need to approach it with caution.
If you approve of my analysis, you can give it a thumbs-up as support. If you have different opinions, you can leave your thoughts in the comments.Thank you!👉👉👉

BTC Forming Bullish Structure — But Wait for the Higher LowAfter months of lower lows and lower highs, Bitcoin has finally broken structure by pushing above the previous lower high, officially forming a new higher high (HH). This is an early sign of a potential trend reversal back into bullish territory.
However, before momentum continues upward, a healthy retracement could occur. The key level to watch is the support zone around $91,200. If price pulls back and forms a higher low (HL) here or slightly lower around the $88,700–$87,500 zone, it would confirm the bullish structure and potentially kickstart the next leg up.
Patience is key here — let the higher low form before looking for long setups.

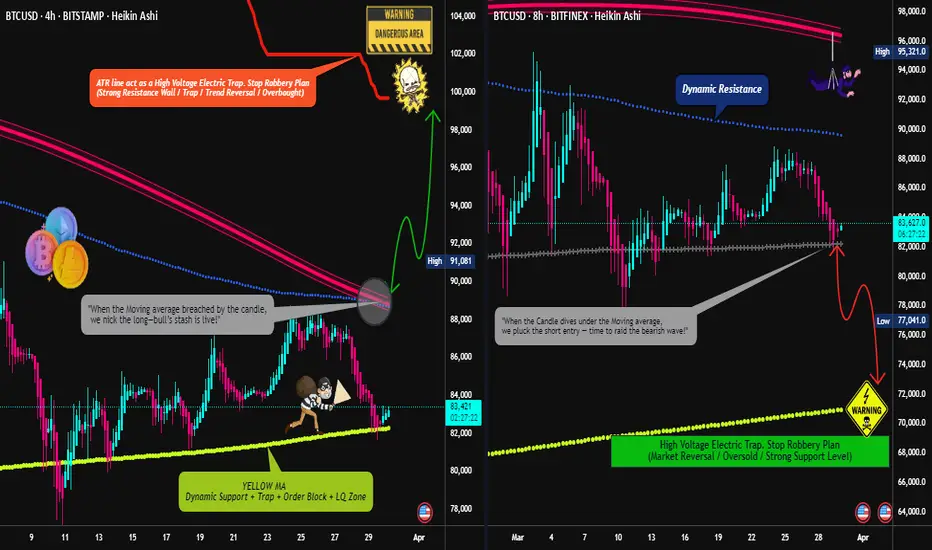
BTC/USD "Bitcoin vs U.S.Dollar" Crypto Market Heist (Swing/Day)🌟Hi! Hola! Ola! Bonjour! Hallo! Marhaba!🌟
Dear Money Makers & Robbers, 🤑💰✈️
Based on 🔥Thief Trading style technical and fundamental analysis🔥, here is our master plan to heist the BTC/USD "Bitcoin vs U.S.Dollar" Crypto Market. Please adhere to the strategy I've outlined in the chart, which emphasizes long entry and short entry. 🏆💸Be wealthy and safe trade.💪🏆🎉
Entry 📈 :
"The loot's within reach! Wait for the breakout, then grab your share - whether you're a Bullish thief or a Bearish bandit!"
🏁Buy entry above 89000
🏁Sell Entry below 81000
📌However, I recommended to place buy stop for bullish side and sell stop for bearish side.
Stop Loss 🛑:
🚩Thief SL placed at 84000 for Bullish Trade
🚩Thief SL placed at 88000 for Bearish Trade
Using the 4H period, the recent / swing low or high level.
SL is based on your risk of the trade, lot size and how many multiple orders you have to take.
Target 🎯:
🏴☠️Bullish Robbers TP 99000 (or) Escape Before the Target
🏴☠️Bearish Robbers TP 72000 (or) Escape Before the Target
BTC/USD "Bitcoin vs U.S.Dollar" Crypto Market Heist Plan is currently experiencing a neutral trend,., driven by several key factors.
📰🗞️Get & Read the Fundamental, Macro, COT Report, On Chain Analysis, Sentimental Outlook, Intermarket Analysis, Future trend targets.. go ahead to check 👉👉👉🔗
⚠️Trading Alert : News Releases and Position Management 📰 🗞️ 🚫🚏
As a reminder, news releases can have a significant impact on market prices and volatility. To minimize potential losses and protect your running positions,
we recommend the following:
Avoid taking new trades during news releases
Use trailing stop-loss orders to protect your running positions and lock in profits
💖Supporting our robbery plan 💥Hit the Boost Button💥 will enable us to effortlessly make and steal money 💰💵. Boost the strength of our robbery team. Every day in this market make money with ease by using the Thief Trading Style.🏆💪🤝❤️🎉🚀
I'll see you soon with another heist plan, so stay tuned 🤑🐱👤🤗🤩
BTCUSD Daily Trend Analysis is BullishAccording to my momentum analysis, BTCUSD confirmed Bullish trend on April 12, 2025 with entry price at 83624 and stop-loss at 74373. It is likely to continue the trend till 91980 and if breaks and closes above 91980, there is a possibility of hitting the target at 102754.

BTC/USDT Monthly Outlook📊 BTC/USDT Monthly Outlook – Smart Money Perspective
Bitcoin is currently trading around $83,565, with price consolidating after a Market Structure Shift (MSS) on the higher time frame.
🔹 Key Highlights:
A strong bullish impulse led to a break of monthly structure (MSS), creating Fair Value Gaps (FVG) both above and below.
Price is currently within a monthly FVG, showing indecision and potential for either continuation or deeper retracement.
Liquidity buy side rests near $110,000, marking a logical target if price respects current FVG support.
On the downside, a deeper retracement could aim for the lower FVG and sweep sell-side liquidity around $48,000–52,000.
📌 Scenarios:
Bullish case: Rejection from current FVG zone, followed by continuation toward the buy-side liquidity.
Bearish case: Break below current FVG, targeting the next zone and filling imbalances below.
🧠 Watch how price reacts to the current FVG. Smart money will likely seek liquidity before committing to a clear direction.
⚠️ This analysis is for educational purposes only and not financial advice.

BTC Update... What To Expect Now??Currently BTC is facing resistance of major trendline (Blue line)+ wedge resistance+ bearish OB resistance...
For bullish trend, currently Bitcoin have to break above all these resistances along with 89k level for confirmation of bullish trend....
If it fails and retraces back inside Monday high range, then we can expect price dropping below Monday lows where major support level is present+ Bat Harmonic Potential Reversal Zone+ 61.8 Golden Fib Level around 72000-70500 levels.
