4-hour Bitcoin Analysis Update
Hello Traders
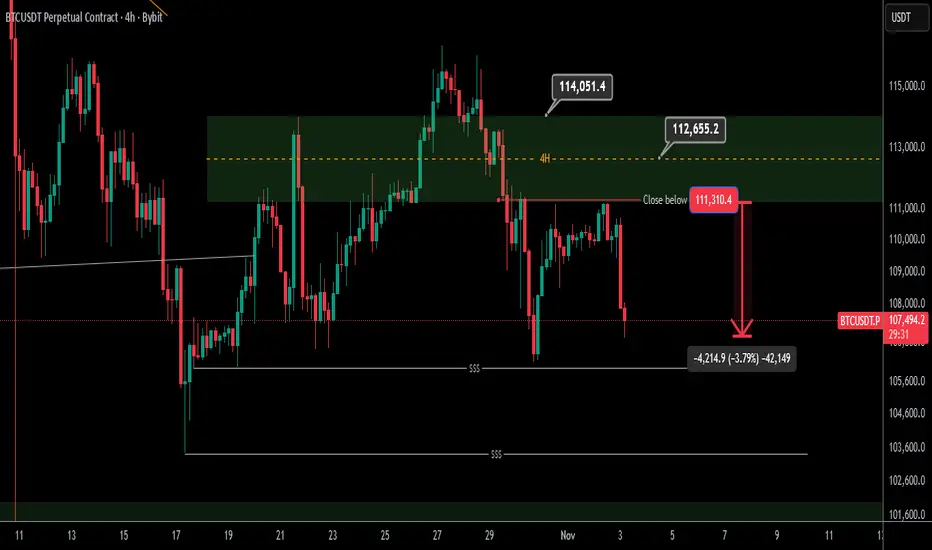
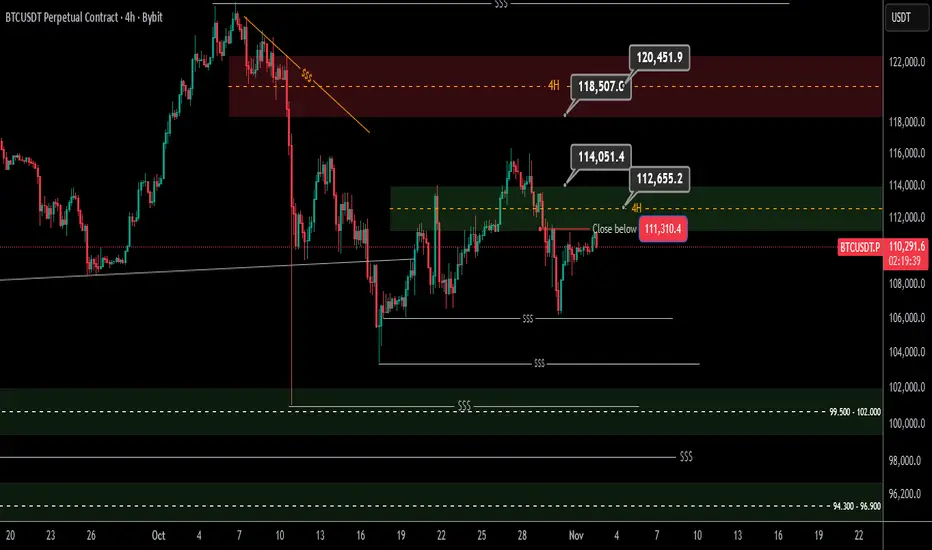
So far, the 4-hour timeframe has dropped and gained about $4,000 from the first announced resistance, and if it returns, the second resistance level of 112 is still clear on the chart, and the previous analysis remains valid
Analysis link:
Btsusd
Bitcoin Trend Analysis Time Frame 4 Hours
Hello Traders
Update of Bitcoin 4-hour analysis, which I will post below
According to the description of the relevant post, in 4 hours the price was able to stabilize below 111,000 and its first pullback reached this level and made a significant profit, and in the second time it is pulling back to the same level of 111,000, and the resistance of 112,000 is also important. I expect the correction to continue to low liquidity areas.
Link to previous post:
BTCUSDTHi everyone
nice move , yeah!
here are the levels that you can consider in your trading.
In my opinion every correction could be a good opportunity to buy.
have fun
DYOR!

BTS Heading to 74K or Is It Just a Shakeout?Not a pretty picture, is it? I hope it's just a shakeout of weak hands and not truly a breakdown.
The price has clearly closed below significant lows. Only saving grace is that the yesterday low is around 38.2% retracement of the rise from lows of August 2024 (sub 50K level).
Let's hope it reverses for good from here. If not, it's not just #BTC that will fall but majority of cryptos with it.

BTC - ITS TIME !Now the right time for explosion has come. It has taken lots of time but we will exit from this boring situation soon.

BTC projection: A Potential ScenarioHere is a potential scenario for a pull back. If we lose the 40k level, I think we will go test the targets of and the liquidity zones of the descending triangle which is a bearish chart pattern.

BTC TRADE PLANhi all
GOOD LUCK
**My trading strategy is not intended to be a signal. It's a process of learning about market structure and sharpening my trading skills**
Thanks a lot for your support


BTCUSDT DailyHi Guys Hope you well.
Today we have news about CPI and we can say that the market trend will be determined. As long as the dotted blue trend line is not broken, we can expect a return to see liquidity around 29500-29500, and then in the next return, we have to wait for the break of the trend line. Be the beginning of the sell-market .
In my opinion, this pattern that has been created is collapsing, which shows that if the price starts to fall, it can quickly reach the origin of its rise about 20000-19000, within a few weeks.
SecondChanceCrypto
⏰10/May/23
⛔️(DYOR)
always do your research.
If you have any questions, you can write them in the comments below, and I will answer them.
And please don't forget to support this idea with your likes and comment.

Next Stop! 31KWell, well, well. We have completed successfully the first block of patterns, the next block is over 30K and then 50K, the problem with the bull market is that nobody believe that exist until the end, so, stay there, and enjoy the ride.

BTSUSDT Price Prediction next market move !!!Hello Guuuys!!!
What do you think about BTS are you bullish on it ?

BTS : TA VIEWBTS TA VIEW.
Most important to follow coming time the volume If it can increase in the next hours.

BitShares (BTS) formed bullish Gartley for upto 62.50% pumpHi dear friends, hope you are well and welcome to the new trade setup of BitShares ( BTS ) coin with US Dollar pair.
Previously we caught more than 21% pump of BTS , and was very close to hit the sell target, but dropped down.
Now on a 4-hr time frame, BTS has formed a bullish Gartley pattern.
Note: Above idea is for educational purpose only. It is advised to diversify and strictly follow the stop loss, and don't get stuck with trade

BitShares (BTS) forming bullish BAT for upto 60.50Hi dear friends, hope you are well and welcome to the new trade setup of BitShares ( BTS ) coin with US Dollar pair.
Previously we had a pump of BTS:
Now on a 4-hour time frame chart, bts is completing a final leg of the bullish BAT pattern, and after a slight more drop it will be entered the potential reversal zone.
Please before opening the trade, make sure that the trade is still valid or not by clicking the play button on the chart.
In order to play and watch the current performance of the chart, you need at least a free account on tradingview. If you don't have then you can create one using the below link:
www.tradingview.com
I am posting the trades of most of the assets available on Bitget, Binance, and on KuCoin. If you don't have accounts there, then you can create using my below referral links.
Link for Bitget exchange, they are also offering nice bonuses:
partner.bitget.com
Binance:
www.binance.com
KuCoin:
www.kucoin.com
There can be a probability that sometimes up to 4 out of 10 trades can be unsuccessful, therefore, It is advised to diversify, I personally open atleast 5 to 10 or sometimes more trades at a time, and strictly follow the stop loss, and don't get stuck with a trade. Best of Luck.
Note: Above idea is for educational purpose only. It is advised to diversify and strictly follow the stop loss, and don't get stuck with trade

Long term maximum lows.As title spoils, this time posting you daily chart extreme which could possible happen. I mentioned this in previous BTC post.
However, I personally can't stick to this. Targets often not reached in full measure.
This would play out too quick, or exchanges shut down. It is for Black Swan more like.
I never rely only on TA. Always looking also to fundaments, sentiment and Stock market. Big money play its role.
Anyway, also technical and rational. I personally be fine with calm nibbling around 618 Fibo. Let's say 12-14 thousand.
Full target got me 6800 USD as 5th complete-extended wave.. I prefer buy Bitcoins first and after more downside, I am starting with altcoins because of higher risk ratio.
In brief, I am looking on bearish Wickoff, wide broken Bear flag under MA200, low demand volumes and 5 wave correction.
So take care, monitor and let's go to see if new low occur. This is main condition for this analysis.
Emvo.
*This is not any financial advice.

BitShares (BTS) forming bullish Gartley for upto 30% moveHi dear friends, hope you are well and welcome to the new trade setup of BitShares ( BTS ) coin with Bitcoin pair.
On a daily time frame, Flux has formed a bullish Gartley pattern.
Note: Above idea is for educational purpose only. It is advised to diversify and strictly follow the stop loss, and don't get stuck with trade

Bitcoin ShortBTCUSDT sell. Dont risk more than 3% of ur account. Dont forget to riskfree ur order after TP1. * High risk, High risk, High risk....

BitShares (BTS) forming bullish BAT for upto 27% pumpHi dear friends, hope you are well and welcome to the new trade setup of BitShares ( BTS ) coin with US Dollar pair.
On a 4-hr time frame chart, BTS is about to complete a bullish BAT pattern.
Note: Above idea is for educational purpose only. It is advised to diversify and strictly follow the stop loss, and don't get stuck with trade

BTCUSD Bearish PotentialBTSUSD has been trading in a triangle.
The price is consolidating while holding a support zone. The bulls need to break the falling resistance, while bears will get control only below the break of a support zone

BTCUSD Bearish Potential BTUSD has formed a Head and shoulders pattern now price break the neck line

BTS - Breaking psychological barrier of 0.01$Reasons to take long:
⭐️ BTC is bullish
⭐️ Important level 0.01
⭐️ Accumulation 1 day
⭐️ Price is squeezing to the level
⭐️ 4th touch of the level
⭐️ 35 ATR
⭐️ Over VWAP
Will enter when price squeezes to the level on 5m timeframe, the base will form and the tape will get faster.
If you don't understand the previous sentence, just use swing stop-loss 3-5%
Fix profit by parts:
1% - 1/3
2% - 1/3, stoploss to breakeven
What's left, hold to the maximum
What do you think of this idea? What is your opinion? Share it in the comments📄🖌
If you like the idea, please give it a like. This is the best "Thank you!" for the author 😊
P.S. Always do your own analysis before a trade. Put a stop loss. Fix profit in parts. Withdraw profits in fiat and reward yourself and your loved ones

BTC Death Cross 3D 50/200 MA is probably upcomingBTC Death Cross 3D 50/200 MA is probably upcoming.
...

BTS - Obvious shortReasons to take short
⭐️ BTC rose a lot without pullback
⭐️ First touch of daily level after long break
⭐️ On 5m timeframe strong trendline for short
⭐️ In the end of formation
⭐️ Slowly squeezing the trendline
⭐️ 140 ATR
Will enter when price squeezes to the trendline on 5m timeframe, the base will form and the strip will get faster.
If you don't understand the previous sentence, just use swing stop-loss 3-5%
Fix profit by parts:
1% - 1/3
2% - 1/3, stoploss to breakeven
What's left, hold to the maximum
What do you think of this idea? What is your opinion? Share it in the comments📄🖌
If you like the idea, please give it a like. This is the best "Thank you!" for the author 😊
P.S. Always do your own analysis before a trade. Put a stop loss. Fix profit in parts. Withdraw profits in fiat and reward yourself and your loved ones
