ASTER / USDT Holding Key Support — Bullish Continuation SetupAs long as ASTER / USDT holds above the $0.741–$0.726 support zone, the structure remains strong for a bullish continuation toward $0.8720. Manage risk wisely and keep a close watch on it....Any breakdown below the key zone will invalidate this setup
Bullishcontinuation

FARTCOIN / USDT Daily Close Above Key Zone— Upside Targets AheadFARTCOIN / USDT can maintain its bullish continuation if the next daily candle closes firmly above the $0.2540–$0.2725 zone. A strong hold and positive reaction from this area would open the door for a clean move toward the $0.35–$0.37 range. Wait for confirmation and manage risk carefully before entering.

Giggle at Bottom Support — Spot Buying Zone ActivatedGiggle / USDT has already tapped its bottom zone, and this level looks attractive for spot accumulation. With strong backing from CZ and a clear bottom formation, the risk-to-reward is favourable for a potential upward move. Manage risk wisely and consider buying only in spot.

ORCA Approaching Trendline Test—Watching Move Toward $1.85–$1.90ORCA / USDT is showing strength and moving toward the $1.85–$1.90 zone to test the trendline resistance. Momentum looks solid, but risk management is important. Any breakdown below the marked horizontal levels will invalidate this setup.

PENDLE / USDT preparing for next bullish leg up After FVG tapPendle / USDT is looking strong, but I’m expecting price to first tap the 4H FVG zone before continuing its trend towards $3 – $3.5…
A clean reaction from that zone can trigger the next bullish wave, so waiting for confirmation is important here. Momentum is still in favor of buyers, but entries should always be planned with patience.
Manage risk wisely and only enter after a clear confirmation.

XNY / USDT — Key Demand Zone Tested, Bullish Continuation Ahead?XNY / USDT is showing strong potential for a bullish continuation towards $0.004880.
I am watching the $0.004090 – $0.003948 zone for a possible entry.
If the price reacts positively from this demand zone, it is likely to resume its upward move towards the target.
Note: A breakdown below this zone will invalidate the setup.
Always wait for confirmation before entering.

PATH - Go in the direction of the WINDOW!PATH - CURRENT PRICE : 17.14
The Japanese Candlestick theory refer to what we call in the West a gap as a window. Whereas the Western expression is "filling in the gap," the Japanese would say, "closing the window."
A rising window is a bullish signal. There is a price vacuum between the prior session's high (that is, the top of the upper shadow) and the current session's low. It is said by Japanese technicians to "go in the direction of the window." This is because windows are continuation signals. Consequently, with the emergence of a rising window, one should look to buy on dips.
PATH has formed three rising windows (gaps upward) in just two weeks that remain unfilled. This pattern suggests strong demand and sustained bullish momentum. Each window shows that buyers overcame sellers before the prior candle closed, reinforcing confidence in the trend.
Furthermore, a Golden Cross has formed for the first time in a long period (look at blue circle), where the 50-day EMA has crossed above the 200-day EMA — a classic long-term bullish confirmation. Notably, the last occurrence of this pattern was in November 2023, making this the first reappearance in over two years, further reinforcing its significance as a potential turning point in market sentiment.
For short-term target is 20.00 and 24.00. For position trader that holds for several months may target around 30.00. Investors holding for approximately one year, the target is 50.00.
ENTRY PRICE : 16.80 - 17.20
FIRST TARGET : 20.00
SECOND TARGET : 24.00
SUPPORT : 14.77 (the low of 08 Oct 2025 candle) - cutloss if price close below support level on closing basis.

PENGU / USDT : Bullish continuation setup / Target 10-15%Pengu / USDT is showing strength to continue its bullish momentum after the recent pullback.
Price is approaching key support zones that could trigger a 10–15% short-term move if held successfully. Watch these levels closely for confirmation.
Manage risk wisely and avoid early entries.

TWLO - Downtrend line BROKEN!TWLO - CURRENT PRICE : 134.88
The chart shared here is the weekly chart, where TWLO broke above its downtrend line with strong volume — a signal of growing bullish momentum. On the daily chart, TWLO formed a rising window (gap-up) last Friday — a bullish signal that often indicates strong buying momentum and potential continuation of the uptrend.
From a pattern analysis perspective, some traders may interpret the current setup as a bullish symmetrical triangle, indicating potential continuation to the upside. Next target will be 154.00 and 174.00. Support level is 114.73 (the low of window area based on daily chart).
ENTRY PRICE : 132.00 - 135.00
FIRST TARGET : 154.00
SECOND TARGET : 174.00
SUPPORT : 114.73 (CUTLOSS below this level on closing basis)

TAO / USDT gaining momentum- Eyes on $700-$750 zoneTAO is looking strong and showing good momentum for a bullish rally towards the $700 – $750 range in the coming days.
Trend structure remains positive — watch for continuation signals and manage risk wisely.

ARDX – Double Rising Window Hints Bullish ContinuationARDX – CURRENT PRICE : 6.06
The stock has broken above its long-term downtrend line accompanied by strong volume (look at red arrow). This breakout was confirmed by the formation of a Rising Window (1), signaling the end of the previous bearish phase.
Another Rising Window (2) appeared recently, again on high trading volume, reinforcing bullish sentiment and indicating the likelihood of a continuation in the uptrend. Take note also that the RSI has climbed into bullish territory (above 50), suggesting a shift in momentum towards buyers’ control and further room for upside before reaching overbought conditions.
ENTRY PRICE : 5.80 - 6.10
FIRST TARGET : 7.00
SECOND TARGET : 8.00
SUPPORT : 5.11 (bottom of the Rising Window area)

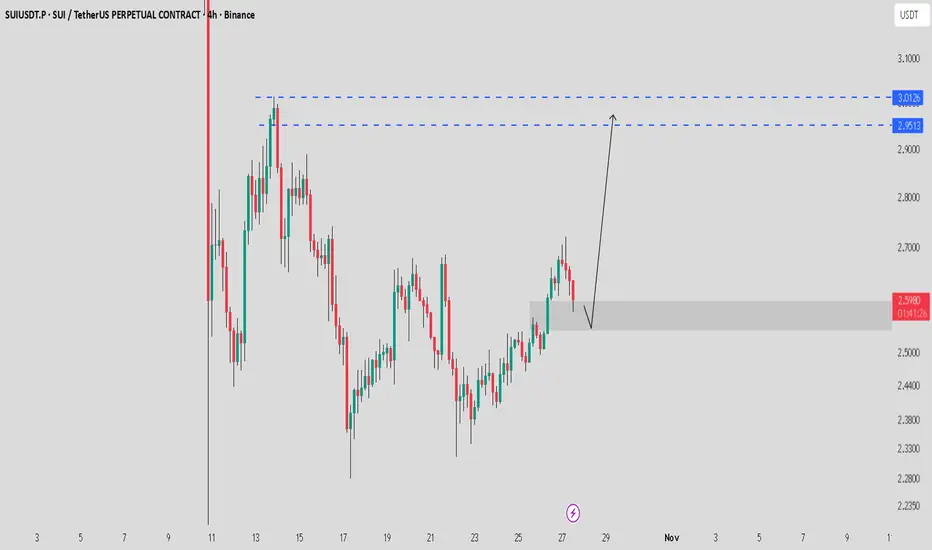
SUI / USDT Testing FVG zone_Watching for reversal towards $3SUI is showing strong momentum and currently testing the FVG zone on the 4H timeframe.
If price bounces from this support, we could see a move towards $2.95 – $3.01.
Note: Wait for a proper confirmation of reversal — a breakdown below this zone will invalidate the setup.
SPY on weekly stays the course LONGSPY on the weekly chart is up 25% in the past six months. This is beyond its historical norms
even during a presidential election year. While there has been some volatility in both directions
the climb is consistent and persistent. The indicators serve to document this. The predictive
algo predicts more of the same. A price cut when the fed gets around to it will serve to sustain
the trend. Lack of it through the summer may cause a fade of momentum. Make hay while the
sun shines.

Netflix Descending Triangle BreakoutThank you everybody for dropping in on this trade idea setup in Netflix. Bullish descending triangle continuation pattern developing here looking like it's about to burst for next week or maybe this Friday as long as the market keeps going up. I want to make sure that I'm getting into these mega cap stocks because that seems to be the only thing that's really on an uptrend and making plays that are multi day uptrends. Another stock I'm looking at is Amazon because it seems to be basing out but I want to wait a little bit until after I get into Netflix before I jump into any other trades since I have a good amount of position size already allocated in my entire portfolio.

SCUSDT | Ready for Continuation?Market Context
Is SCUSDT poised for an upside continuation? With BTC rallying on positive CPI data, the stage is set for some altcoins to follow suit.
Strategy
The stars are aligning for SCUSDT, and I'm eyeing a high-risk, high-reward trade with a 6.63 RR. This is the kind of opportunity that can move fast, so timing is crucial.
Action Plan
Entry: 1M chart—be quick!
Let's catch this wave and see where it takes us. Stay tuned for a thrilling ride!

MSFT Bullish Continuation out of a Cup and Handle LONGMSFT on the daily chart shows the price action in the bull run out of the Covid lows then a
cup and handle pattern is printed and finally bullish continuation above the level of the cup.
Since the cup has a height of $145 and the level of the lip of the cup is $345, the pattern
forecasts bullish continuation for $ 145 above the cup's lip at $ 345 and so targeting $ 480.
I will continue to add to my MSFT position while watching for pivot lows on the 120-240 minute
charts. MSFT is a major player in the AI space and could even launch its own semi-conductor
division to compete with NVDA and the others. It has a healthy balance sheet and free flowing
cash from which to grow without dependence on interest rates coming down. The RSI indicator
shows consistent strength without signs of being overbought.

CMCM could chasing a Chinese internet stock be profitable? LONGCMCM is on fire with a 90% gain since the earnings report which was not verified by any
outside forensic accounting auditors . The Ciniese economy may be recovering with it
Cheetah.
The price-volume trend is impressive in the past month as a combination of the price moving
up responding to spikes of buying volume and positive volatility. I will enter this as a small
position chasing the momentum using a trailing ATR stop loss currently $.25 per share.
Since I will risk $25 in the trade for this small position I can take 100 shares as a long position.
I will continue to watch for selected Chinese stocks responding to the economic recovery to
exploit for gain.

GOOG- now at ATH completing A Cup and Handle LONGGOOG as shown on the daily chart has completed a cup and handle and has the momentum
of moving up to its previous ATH set 2/1/24 and November '21. This could forecast bullish
continuation to add $50-70 onto current price as so 30% onto the market cap. GOOG has
been relatively stable in the current general market environment. Earnings are coming in
three weeks. Google is dependent on ad revenues primarily and so its income stream is
relatively narrow focused no matter the variety of its services. I will take a long trade
here expecting good price movement heading into earnings with a trim of the position
just before earnings and stop loss adjustments at increments to diminish.

SMCI - consolidated - ? Continuation or ? Reversal SMCI has been on an impressive trend up since the first day of the trading year. On the 15
minute chart It had a healthy 12% pull back about February 22-29 but then rallied again on
a reversal upside to nearly the ATH of $ 1075 set on Friday 2/16. I note that traders like
to trade SMCI on Fridays and likely are chasing same day expiration call options. I know this
because I have been one of them. SMCI is now in a high tight bull flag pattern. Typically
this is bullish for another leg up of equal magnitude after consolidation. I will suppose
the probability of a breakout higher is 75% and breakdown 25%. I may play this with
a set of stop orders. A buy stop at $ 1030 and a sell stop at $ 1005 with a share proportion
set equally. When SMCA breaks from the consolidation one of the two orders will trigger
while the other will be in play until cancelled or triggered. My bullish bias is that the buy stop
will trigger and I will miss only a small piece of the price action in the initial continuation.
I will assess for a call option trade upon continuation. The volatility indicator helps me pick
entries with an alert set for volatility beyond the running mean either bullish or bearish.

TSHA a medtech penny stock pumps on news and earnings LONGTSHA is a gene technology medical company which reported on its clinical trials for Rett
Syndrome which is a neurobehavioral disorder separate from others like autism or
schizophrenia. This could be a breakthrough medication for those who suffer from Rett.
TSHA102 could be heralded as a miracle treatment ( not a cure). Price had trended up
in February and then down in March and is now situated at the mean anchored VWAP.
Relative volumes are 5-10X the running mean. I am taking a sizeable position here based
also on my background as well as the forecasts of medical technology stocks as being hot right
now especially small caps. Risk is definitely on. TSHA has been selling off parts of its pipeline
to fortify its core. This tells me leadership is realistic and has a survival plan which is a big plus
in the world of young and small medical technology companies. The earnings report from
yesterday showed a big earnings beat and a transition from cash burning to positive earnings.
Part of this is from selling off part of its future. Nonetheless, that future may be very bright
with what remains. I believe that TSHA will consolidate and gain consensus as to fair value
but then resume bullish continuation. This may be a buy and hold until the next earnings while
watching for clinical trial news that will give a hint as to the growth path.

EURUSD to 1.1 per dollar??Another one for the forex traders or fiat currency traders.
EURUSD is bullish on weekly as we are currently at Entry for Long Orders,
Then based on this Timeframe, you can execute long orders at current price, i took my entries early but market might correct a bit back to entry.
We have just finished or completed correction, and about to continue going up from here, Initial target is 1.1 dollars, then lock and let the big boy run to new Highs.
NFA as always, awesome trading, Enjoy.

VINC continuation play LONGHere on the 30-minute chart is my idea for the continuation of my VINC idea posted here before
the current breakout. Price is presently in a consolidation ascending regression channel .
The choices for a play are to wait for a break above or below the channel or alternatively
play the price action inside the channel. Since price is currently at the bottom of the channel
I will go long with a stop loss under the channel. Upon reaching the top of the channel I will
close half the position and then watch for a break of resistance or a rejection down and then
trade accordingly. Overall, I believe that this is a high-tight flap pattern and VINC is
accumulating gradually and will move higher when the accumulation saturates as per
Wychoff's theory.

JAN on watch for bullish continuation LONGJAN had earnings but I cannot find the report. It is trading with heavy volume and it shows in
the price action. Price has pulled back in the after-market in a standard Fibonacci retracement.
A pullback is appropriate here as price has gained 250% in a month. I see the pullback
as healthy and JAN is now well positioned for another bullish continuation. Volatility
and volume supports the conclusion. I will set a stop loss at 10% and targets at 50%, 75% and
100% to take partial profits on an anticipated trend up. Alerts will be set onto a set of
moving averages on the 30 minute time frame to detect death cross unders. Once profit is
hits 10% I will change the stop loss to a trailing 10% stop loss and once above 75% make the
trailing loss 5% and once over 100% change it to 3% so I can let the trade run itself from
those orders.
