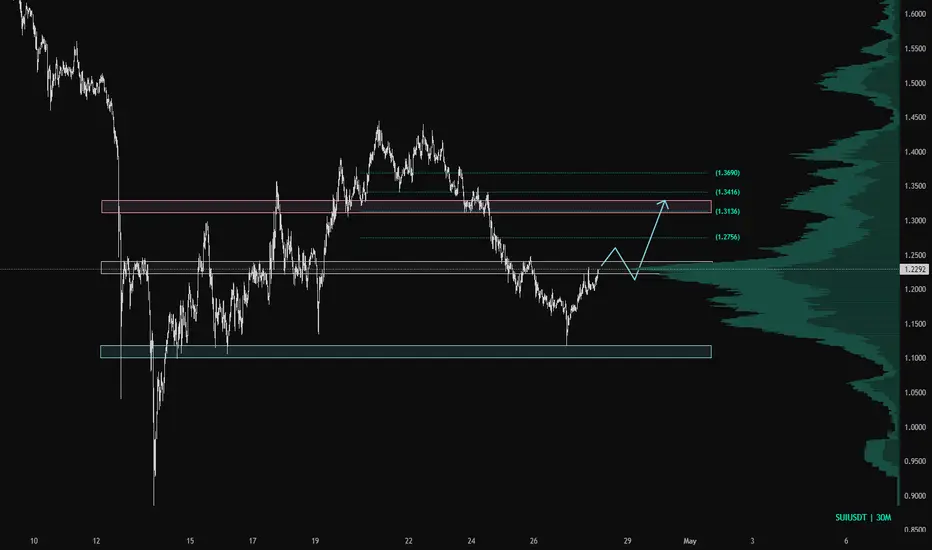
SUI Rejected At Key Resistance After Explosive RallyExplosive Breakout Into Resistance
SUI produced a powerful breakout rally this week, surging aggressively into the major $1.35 resistance region before finding sellers. Price eventually topped out around the recent $1.42 swing high.
Pullback Currently Looks Controlled
Despite the rejection, the
SUIUSDT 1D#SUI is moving inside a range and pressing against the top of the box and the descending resistance on the daily chart. In case of a confirmed breakout above these levels, the potential upside targets are:
🎯 $1.1648
🎯 $1.2749
🎯 $1.4072
🎯 $1.5394
🎯 $1.7277
🎯 $1.9675
⚠️ Always remember to use a tigh
Sui Turns Bullish, New All-Time High Possible —Go LONG!If Bitcoin can hit a new all-time high, Sui can also hit a new all-time high. Ethereum is set to hit a new all-time high, why not also SUIUSDT? Nothing on this chart says that this cannot be accomplished. Early 2027 or late 2026? Make your pick.
SUIUSDT with a simple wave count
A bullish impulse
SUI – Accumulation Around $1SUI has been trading in a prolonged accumulation phase around the psychological round number of $1 🔵
After a long markdown phase, price is now stabilizing within the green range, showing signs of base building rather than continued weakness.
For the bulls to take over and officially kickstart the
$SUI - Daily EMA200 RejectionCRYPTOCAP:SUI tapped the daily resistance around the $1.40s region, which also lines up with the daily EMA200. Initial reaction here is a rejection, which makes sense since it’s the first test of that level after the impulsive move up.
Right now, price looks likely to retest the $1.15–1.10 area, w
SUIUSDT | Bullish Continuation Setup → Pullback into Support SUIUSDT | Bullish Continuation Setup → Pullback into Support → Expansion 📈
SUIUSDT is currently showing a strong bullish structure after a sharp impulsive move upward. The market is now in a corrective phase, forming a descending structure that appears to be a healthy pullback rather than a tren
#SUI/USDT – Bullish Triangle Breakout Confirmed | Resistance#SUI
The price is moving within a descending channel on the hourly timeframe. It has reached the lower boundary and is heading towards a breakout, with a retest of the upper boundary expected.
The Relative Strength Index (RSI) is showing a downward trend, approaching the lower boundary, and an upw
SUI price analysisCRYPTOCAP:SUI — key level to watch
The most important zone OKX:SUIUSDT at the moment is $0.80–0.85.
🔹 If buyers manage to hold this range, it could become a solid accumulation area with potential for at least a 2x move in the medium term.
🔹 A confirmed break below $0.80 would likely signal a
$SUI pumps ~25% — Buy Now or Sell?Here's the full breakdown 👇
Why did BINANCE:SUIUSDT pump?
Sui experienced a ~25% price increase driven by the listing of BINANCE:SUIUSDT futures on CME Group, a significant stakeholder event by a Nasdaq-listed firm, and the upcoming launch of confidential transactions, alongside a Paga partners
See all ideas
Summarizing what the indicators are suggesting.
Oscillators
Neutral
SellBuy
Strong sellStrong buy
Strong sellSellNeutralBuyStrong buy
Oscillators
Neutral
SellBuy
Strong sellStrong buy
Strong sellSellNeutralBuyStrong buy
Summary
Neutral
SellBuy
Strong sellStrong buy
Strong sellSellNeutralBuyStrong buy
Summary
Neutral
SellBuy
Strong sellStrong buy
Strong sellSellNeutralBuyStrong buy
Summary
Neutral
SellBuy
Strong sellStrong buy
Strong sellSellNeutralBuyStrong buy
Moving Averages
Neutral
SellBuy
Strong sellStrong buy
Strong sellSellNeutralBuyStrong buy
Moving Averages
Neutral
SellBuy
Strong sellStrong buy
Strong sellSellNeutralBuyStrong buy
Displays a symbol's price movements over previous years to identify recurring trends.