Bullish divergence + Bullish Flag pattern appearing.BECO Analysis
Closed at 6.09 (13-02-2026)
Bullish divergence + Bullish Flag pattern appearing.
Crossing & Sustaining 7.55 with good volumes may lead
it towards 13+
Mid-way resistances seem to be around 6.56 & then
around 7.20 - 7.40.
However, this time it should not break 5.30
Bullish Divergence

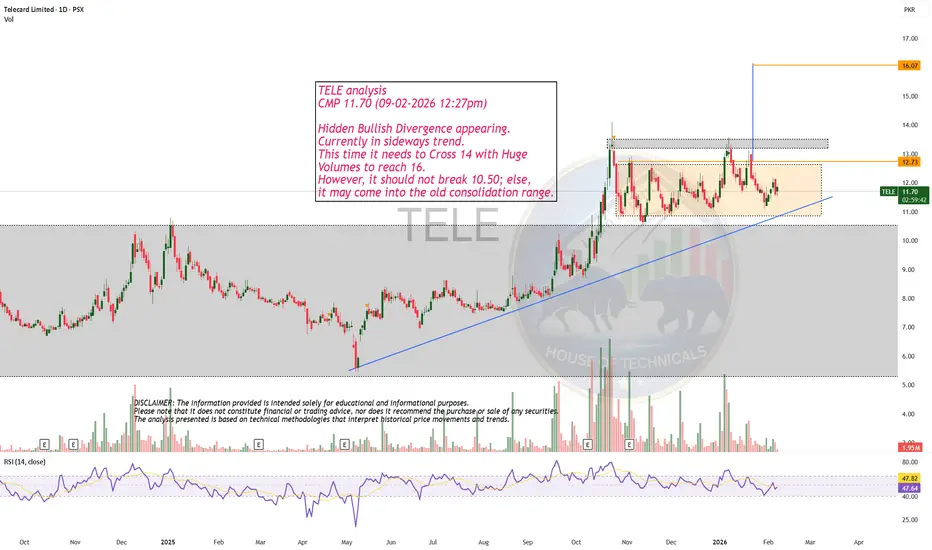
Hidden Bullish Divergence appearing but...TELE analysis
CMP 11.70 (09-02-2026 12:27pm)
Hidden Bullish Divergence appearing.
Currently in sideways trend.
This time it needs to Cross 14 with Huge
Volumes to reach 16.
However, it should not break 10.50; else,
it may come into the old consolidation range.
USDJPY – 4H | Bullish Divergence | Japan Fundamental OutlookUSDJPY has undergone a clear structural shift on the 4H timeframe, transitioning from a corrective downtrend into a bullish market structure. Price is now forming higher highs (HH) and higher lows (HL), confirming a change in trend according to Dow Theory.
The recent impulse higher followed by a shallow pullback has allowed price to establish a new higher low, keeping structure intact. At the same time, a clean bullish divergence is visible, signaling strengthening momentum and supporting the idea that the current price zone represents a valid continuation area rather than exhaustion.
From a technical perspective:
Market structure has flipped bullish with HH–HL formation.
Bullish divergence confirms underlying strength after the pullback.
Price is holding above key structure support, keeping the continuation scenario valid.
Key Scenarios
As long as price holds above the current higher-low structure, the bias favors continuation toward 156.500, followed by 157.300.
A decisive 4H close back below the Lower-low support would weaken the bullish case and signal a deeper corrective move.
Fundamental Confluence (Japan-Side Analysis)
Fundamentals add clear directional confluence to the bullish USDJPY setup, driven primarily by persistent JPY weakness.
Monetary Policy – Bank of Japan:
The BoJ has kept rates unchanged, pausing to assess the impact of its previous hike rather than signaling a shift toward easing. While guidance remains cautiously worded, the bank has upgraded growth and inflation projections and continues to signal that further rate hikes are likely over time. However, concerns that inflation may dip below 2% in early 2026, along with political and fiscal uncertainty, argue for gradual normalization rather than aggressive tightening. This keeps real yields suppressed and limits near-term JPY strength.
Global Risk Environment:
Rising uncertainty around U.S. Federal Reserve leadership has triggered broader risk-averse sentiment across markets. Safe-haven flows have favored currencies such as the Swiss franc, while the yen has failed to attract sustained demand. Additional concerns around U.S. dollar dominance flagged by European regulators have contributed to volatility, but overall price action continues to favor JPY underperformance rather than sustained strength.
Positioning & Flow (CFTC):
CFTC data shows net positioning improving, supported by COT RSI readings, signaling sustained bullish momentum in current positioning trends. This suggests that flows remain aligned with upside continuation rather than exhaustion.
Upcoming Data Risks:
Final manufacturing PMI and monetary base data will be closely monitored. Any signs of further softness in manufacturing or accommodative monetary conditions would reinforce JPY weakness, while unexpected strength could temporarily slow upside momentum.
Domestic (Endogenous) Japanese Indicators
Japan’s internal economic data remains mixed to weak, reinforcing the broader fundamental bias:
Services activity, building permits, and employment trends show softening momentum.
Inflation indicators remain mixed, limiting urgency for tighter policy.
Rising interest rates have yet to translate into sustained currency strength.
Fiscal and balance-sheet metrics continue to weigh on longer-term confidence.
Overall, domestic conditions do not support a strong or sustained JPY recovery at this stage.
USDJPY has confirmed a bullish structural shift on the 4H timeframe, supported by momentum divergence and higher-low formation. Fundamentally, persistent JPY weakness and cautious BoJ policy continue to favor upside continuation.
Watching price action for confirmation.
Bias remains bullish while Lower-low structure holds.

Kraft Heinz Signs Point to Bearish Trend Flipping BullishHi,
So this is a 3 Day analysis on Kraft Heinz.
Notice our Downtrending Bearish Channel that we've been bound to since September 2024.
Current Candle is in a clear breakout above the Upper border of Channel.
It still not set in stone exactly where we go from here and chances of fakeouts exist early into moves. Look for the next couple candle prints for more clues.
We are also currently above the 21 EMA, looking at past data, it has indicated further upside in many cases
With that the most attention grabbing feature in my opinion is the following:
Potential for a Bullish Divergence to play out. This sign where Price action prints lower lows but Indicators print HIgher lows is a Bullish Reversal sign, where if played out can bring in Bullish Momentum, flipping bearishness to Bullishness.
With that we have Momentum Indicators Signaling Bullishness
Both MACD and STOCH RSI are flashing BUllish Crosses. Which supports Bullish Momentum coming in. Looking at previous data everytime we've crossed Bullish, we've had Price move Up
Overlapping also seen with 1 Week timeframe.
Signs overlap between 3 Day timeframe and 1 Week timeframe. With 1 Week starting to show some life & Bullishness with crosses if we continue this direction till end of day today.
With all these Higher timeframe findings, it merits attention on Kraft Heinz. I will continue to observe.
Expect more updates.

S&P 500 Trade Analysis Feb. 5th- Expecting Touch at top of the Pennant Line
- A Reversal Out of Pattern to the downside (typically a bearish continuation pattern following a downtrend)
- Create 3rd touch on RSI for Bullish Divergence . Price is creating lower lows and on RSI higher lows which creates bullish divergence.
- Return up for Bullish Day . Final conclusion the Day finishes Bullish

Bullish Divergence on bigger time frames.
Bullish Divergence on bigger time frames.
Currently in a Consolidation box.
Those who cant wait for long, should wait
for the breakout around 9.
Upside targets can be around 11 - 11.50
initially.
Strong Support seems to be around 6.
On the flip side, if this Support is broken,
the next levels would be around 3.

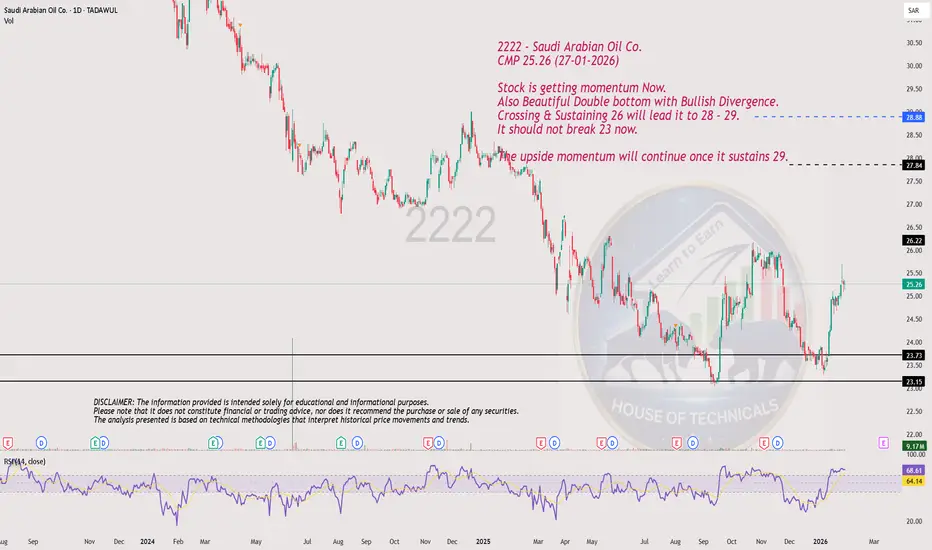
Stock is getting momentum Now.2222 - Saudi Arabian Oil Co.
CMP 25.26 (27-01-2026)
Stock is getting momentum Now.
Also Beautiful Double bottom with Bullish Divergence.
Crossing & Sustaining 26 will lead it to 28 - 29.
It should not break 23 now.
The upside momentum will continue once it sustains 29.
Bullish Divergence appearing on bigger tf.MASK Analysis
CMP 0.2395 (27-01-2026)
Bullish Divergence appearing on bigger tf.
It seems safe as long as it stays above 0.1750
Crossing 0.5148 wiht Good Volumes & Sustaining
this level may initiate aggressive move towards 2.

ELSA - Clear bullish divergenceLONG – ELSA
On the 15-minute timeframe, a high-probability preferred pattern has been identified. RSI is deeply oversold and showing clear bullish divergence on M15, signaling momentum exhaustion on the sell side. This condition is confirmed across higher timeframes (H1 and H4), where selling pressure is visibly weakening, indicating seller exhaustion.
Previously, price repeatedly broke the descending trendline, confirming a deterioration of the bearish structure. However, strong buying pressure has not yet emerged. For this reason, the plan is to wait for a volume expansion as confirmation, in line with classical price–volume analysis. Given the historical behavior of this pattern and momentum setup, a buying surge is expected in the near term.
🎯 TP: 0.21439
🛡️ SL: 0.010687
📊 RR: 1 : 9.21
Trade thesis: multi-timeframe RSI divergence + seller exhaustion + repeated bearish trend breaks, with volume confirmation as the final trigger, forming a high RR long opportunity.

Inverse H&S2020 Analysis
Closed at 120 (15-01-2026)
Inverse H&S pattern appearing along with Bullish Divergence.
Immediate Resistance seems to be around 125 - 126.
Crossing & Sustaining this level may lead it towards 150+
However, it should not break the right shoulder now.

Bullish DivergenceSMCI Analysis
Closed at 30.16 (09-01-2026)
No clear Trend but there is a Bullish Divergence on daily tf.
A slight upside is expected if 28 is not broken;
35 - 36 should be touched once if 28 - 29 is sustained.
The Upside may continue if 35 - 36 is crossed with Good Volumes.

1st HL after MSR Bullish div on Daily IMCD #000191st HL after bullish missing right shoulder divergence on daily, also bullish div on weekly which acknowledges a possible upmove which can be seen on the daily.
V2 trigger on daily as well, forming the low.
Up after 1st HL, expectation is first target on 2 ATR when 1st higher high forms , then I take 33% out, remainder remains to be seen, I expect to exit another 33% on 3 ATR and remainder on 1 ATR 1W.
1st TP: 80,89
2st TP: 82,99
3st TP: 92,48
E: 77,36
SL: 75,48
R/R: 1:1.88
This is trade #00019
Closed 13 trades now.
Hitrate 13 out 18 trades = 72.22%

Bullish Divergence Weekly TTD Trade #00020Bullsh div, V1 trigger, sR coming from oversold, both EFI's coming from < -3 ATR extremes
Montly flipping from red impulse to blue, but factor 3 is already blue.
TP 1: 44,49
TP 2: 49,86
E: 38,4
35,41
R/R: 1:2,2
I plan to enter around 38,4 with 80%, possibly more entries when it goes below
70% exit on TP1, 30% exit on TP2
Trade #00020

CTAS Bullish divergence on Daily #00017Bullish div on 6 indicators,
E: 184,33
TP: 191,22
SL: 179,55
R/R: 1:1.44
Trade #00017

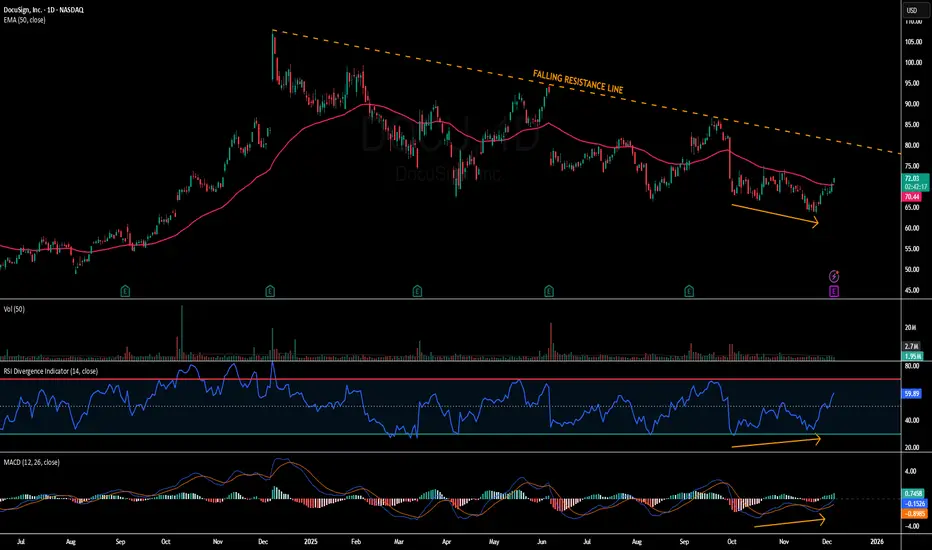
DOCU - Trendline Resistance in FocusDOCU - CURRENT PRICE : 71.87
Short-term outlook for DOCU is bullish as price moves above the EMA50, supported by RSI holding above 50 and bullish divergence in both RSI and MACD (look at orange arrows). Momentum continues to improve with a MACD bullish crossover, positioning DOCU for a move toward the long-term downtrend line. First target is $79 near trendline resistance, with a potential extension to $85, while $65 remains the key support and invalidation level.
ENTRY PRICE : 70.00 - 71.87
FIRST TARGET : 79.00
SECOND TARGET : 85.00
SUPPORT : 65.00
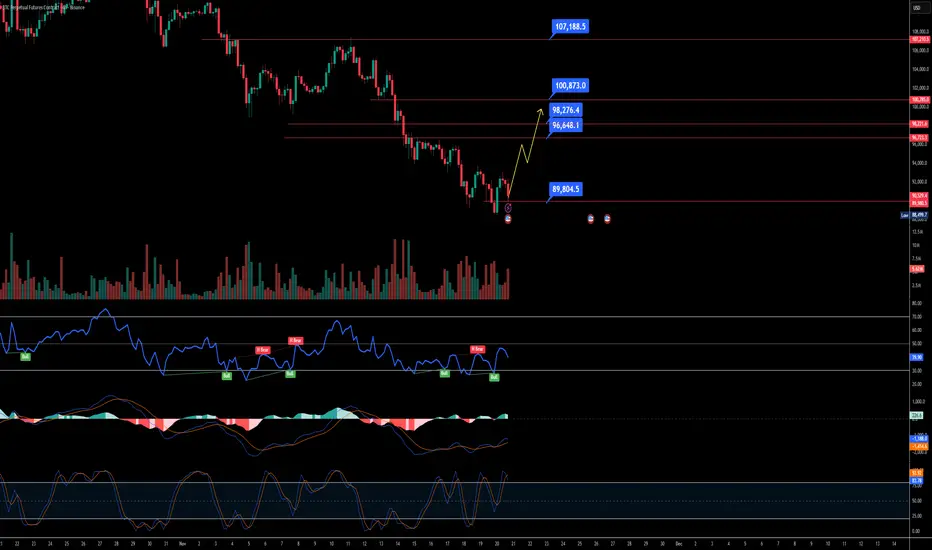
$BTC 4H Analysis – Clear Bullish Structure FormingRight now on the 4-hour chart, BTC is clearly building a strong bullish pattern.
🔹 Price action is forming a clean Inverse Head & Shoulders structure.
🔹 RSI is showing a bullish divergence, meaning momentum is strengthening while price is stabilising.
🔹 This setup usually indicates a breakout move once the neckline is breached.
If BTC starts rising from the current zone, the market is likely to grab liquidity near the $97,000 level, which is the next major area where stop-loss clusters and pending orders are sitting.
In simple terms:
BTC looks ready for a bullish expansion — liquidity target: ~$97,000.
$BTC VERY Close to Forming a BOTTOMReceiving the end of cycle calls / texts from normie friends - one of my best indicators.
Bullish Divergence on the Daily.
Need some closes above the EMA9 ~$103k to confirm.
Then $107,5 next up.

TGT Bullish Divergence Weekly MACD-H and EFIBullish divergence on MACD-H, MACD lines, EFI, ATR channel divergence, even divergence on Stochastic RSI.
TP
100.51
E
90.8
SL
84.46
Trade #00015

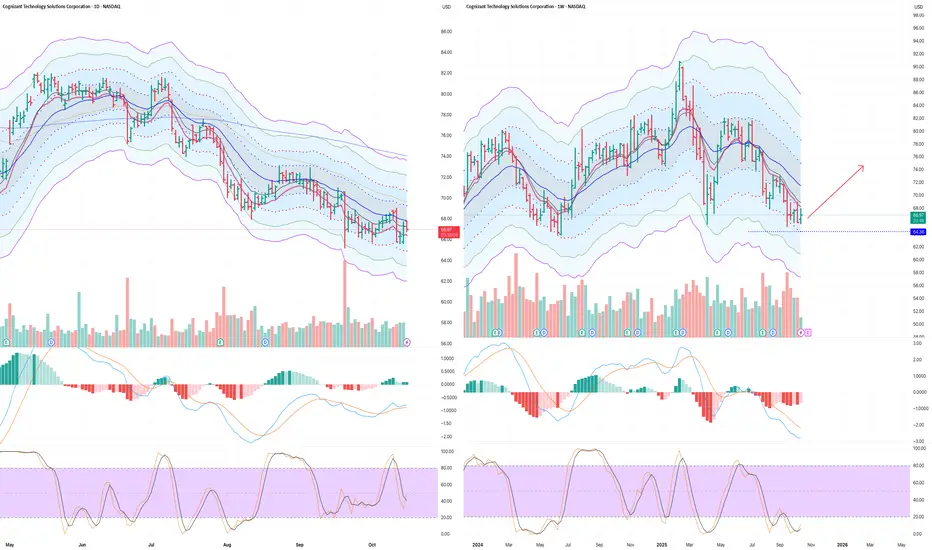
Bullish divergence weekly CTSH (Cognizant) and bounce on supportbullish div, ATR channel div, bounced on support.
Stochastic RSI is turning up
Bullish divergence on MACD-H and also on the EFI indicator
TP
74,48
E
66,97
SL
64,48
Trade #00016
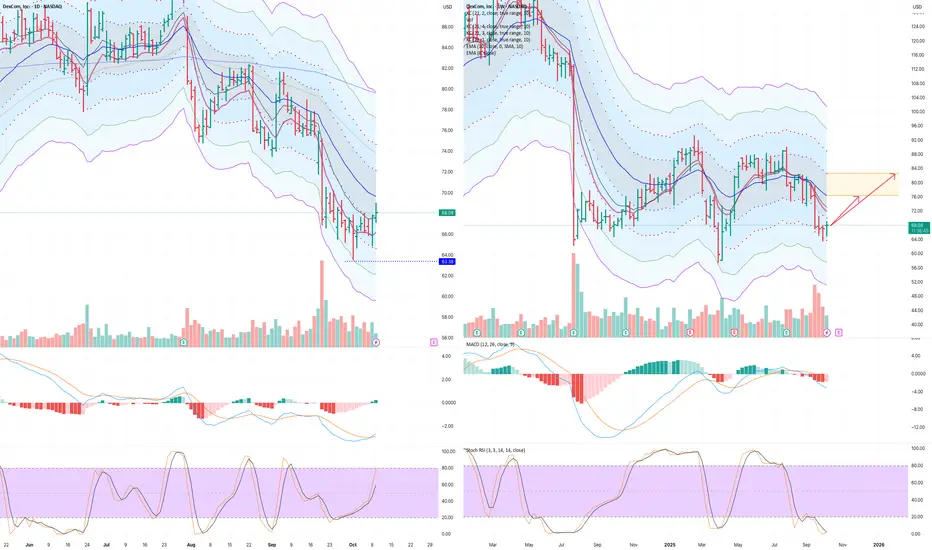
Bullish divergence + finger pattern Weekly DXCM (Dexcom)Bullish divergence incl finger pattern on weekly.
Also support has been tested and stochastic RSI maximally oversold. I expect this to turn up
TP1
76,8
TP2
82,62
Entry
68,08
SL
63,49
R/R TP1
1.9
Trade #00013
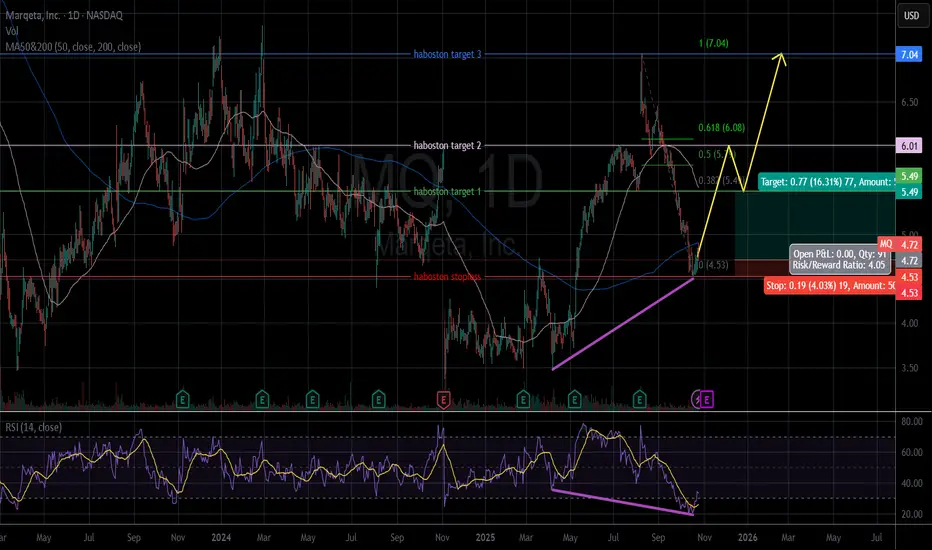
MQ - Bullish divergenceAfter MQ oversold, its price is recovering with very clear Bullish divergence sign.
The price closed 10.24.2025: $4.72.
Price target: $5.49/ $6.01/ $7.04
Stop loss: $4.53.
IMO, amateur trader.
Good luck!
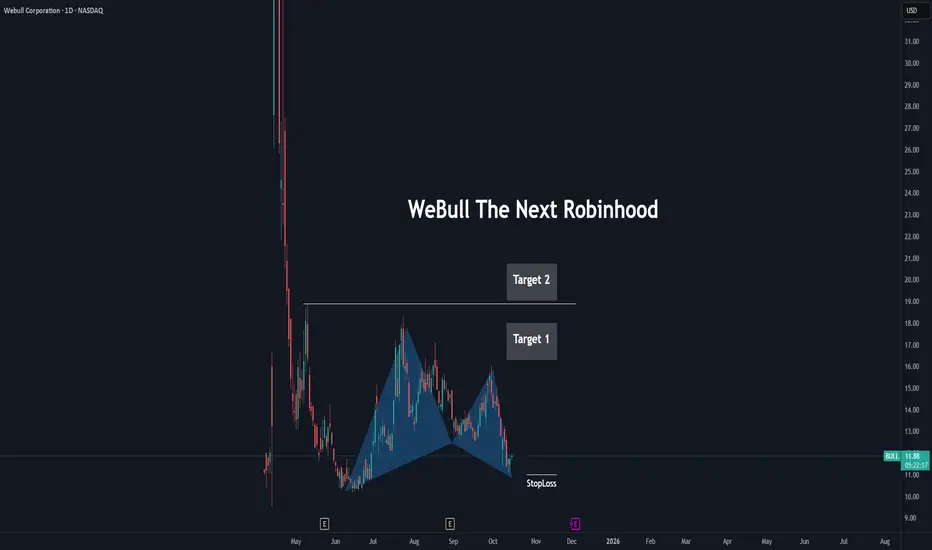
Beautiful Bullish Harmonic Bat PatternMassive Bullish Divergence (using RSI),
Bullish Bat Harmonic Pattern,
Overall WeBull seems bullish to me.
This idea is for educational purposes only and being published as a specualtion.
Do your own Research.
Thumbs up if you like my idea.
IMCD Daily Bullish Divergence + 1st Higher lowBullish div on ME and mLines, also 1st HL that ticks above -1 ATR now, but bar only 50%
low forming takes a while, bullish div on X5, price above -1 ATR now on 1D, looks good. Low vol stock tho
I scale out 2/3 at 1 ATR, at TP1, then let the 1/3 remainder run into a possible uptrend
TP1
92,42
TP2
evaluate
E
88,96
SL
87,04
Trade #00017
