MY BEST TRADE - CRCLCRCL. A beautiful retest on liquidity zone. The stock retraced to exact marked levels and grabbed all the liquidity two times near 102 to 104.
UP 31% till now.
Bullishpattern

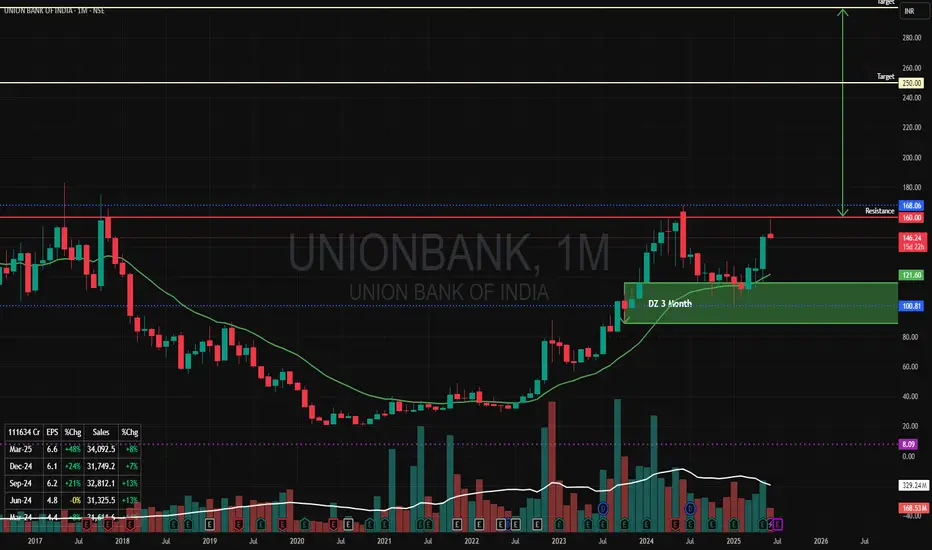
"Union Bank of India" Cup & Handle PatternI can see a Cup & Handle Pattern in Union Bank of India in Monthly Time Frame. Price is also coming from Monthly Demand Zone.
Rs 160 is a a Resistance line to break this Pattern.
Once we see a breakout of this level of Rs 160 Upside with a Good Volume (Increased from Previous Months) the Price can double from here to Rs 300 in next 12 months time.
first Target Rs 250/-
Second Target RS 300/-
Lets Hope for the Best!
ETH ANALYSIS📊 #ETH Analysis : Update
✅As we said earlier, #ETH performed same. Now we can see that #ETH is trading in a bullish flag pattern and its a bullish pattern. We could expect around 10% bullish move if it sustain above its major support.
👀Current Price: $2555
🚀 Target Price: $2815
⚡️What to do ?
👀Keep an eye on #ETH price action and volume. We can trade according to the chart and make some profits⚡️⚡️
#ETH #Cryptocurrency #TechnicalAnalysis #DYOR

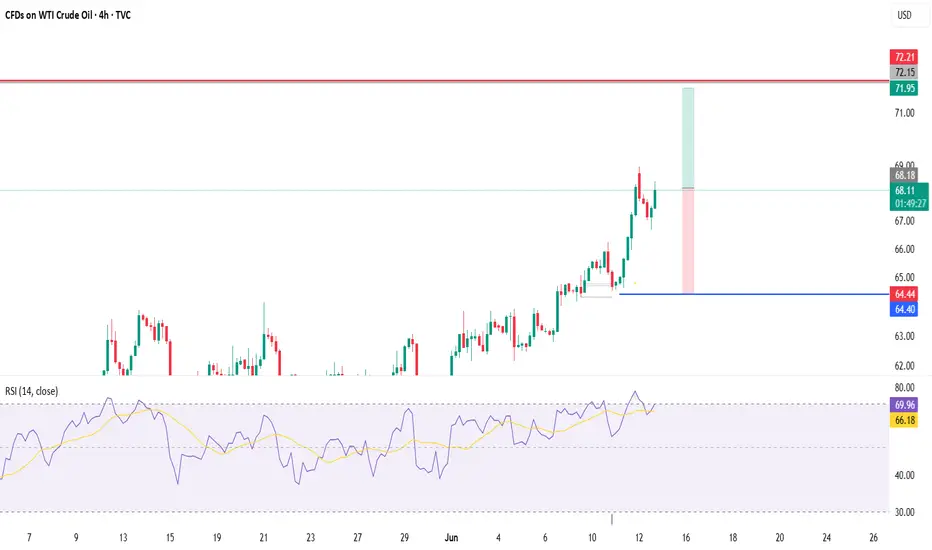
US OIL 🛢️ USOIL Trade Plan – Based on Dow Theory (4H TF)
📌 Bias: Buy / Long
Dow Theory shows Higher Highs (HH) and Higher Lows (HL) structure on the 4H — indicating an uptrend
SL TP marked in Chart / Entry Instant or buy near CMP
OKLO Daily Cup and HandleStrong pattern formed off a key level that could breakout in August or September. Upper price target of 90 as long as the gap is filled but not too far under

BUY POSITIONToday im looking at buy positions to the highlighted target continue to make higher highs

Ethereum (ETH/USDT) – Ascending Triangle Breakout Incoming?ETH is pressing against the upper resistance of a long-forming ascending triangle on the 4H chart — historically a bullish continuation pattern.
Previous Move:
Last breakout saw a +49.7% move, and the structure suggests we could see a similar surge again!
Key Levels:
Support: $2,242.98
Breakout Zone: $2,850
Resistance/Target 1: $3,419
Major Target 2: $4,282 (+49.7%)
RSI: 70.5 — strong momentum, near overbought but in breakout territory.
Volume seems to be increasing near resistance, a breakout could be imminent.
Potential Upside: +49.7% if triangle breaks cleanly.
Bias: Bullish
Timeframe: 4H
Watch for: Rejection at $2,850 or breakout retest for entry confirmation.
This is not financial advice, please do your research before investing, as we are not responsible for any of your losses or profits.
Please like, share, and comment on this idea if you liked it.
#ETH #Ethereum #ETHUSDT

AMZN: Watch for a Break Above 218.00If NASDAQ:AMZN manages to push above 217.85 , there's a strong chance we’ll see a move toward 219.96 . However, caution is advised around the 218.00 level – both premarket and postmarket sessions showed hesitation and failed to hold above that resistance.
A more conservative approach would be to wait for a clean break above 218.00 before entering.
🔍 Context:
We’re currently in a solid uptrend. On the daily chart, we’ve seen a rejection of the downside, marked by an inside bullish candle with a notable wick – suggesting upward pressure that the market may try to release. Given recent premarket activity, the 218.00 area remains a key battleground for bulls and bears alike.

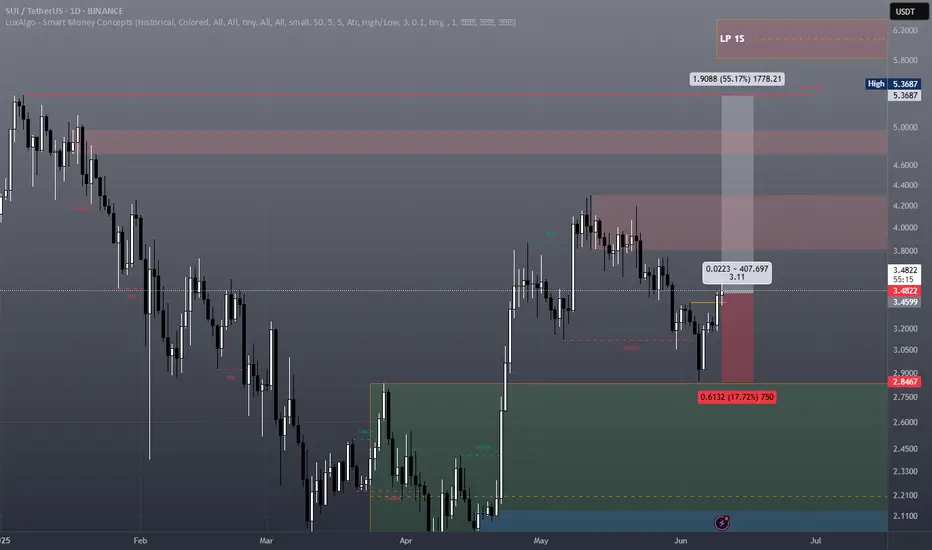
SUI is building momentum!📈 CRYPTO:SUIUSD After a three-swing corrective pullback into the $3.3 - $2.7 buying zone, price is bouncing and setting up for the next upside move.
The structure is in place—let’s see if the breakout confirms!

KAJARIA CERAMICS - Bullish Flag & Pole Breakout (Daily T/F)Trade Setup
📌 Stock: KAJARIA CERAMICS( NSE:KAJARIACER )
📌 Trend: Strong Bullish Momentum
📌 Risk-Reward Ratio: 1:3 (Favorable)
🎯 Entry Zone: ₹1065.00 (Breakout Confirmation)
🛑 Stop Loss: ₹965.00 (Daily Closing Basis) (-9 % Risk)
🎯 Target Levels:
₹1103.40
₹1143.15
₹1184.35
₹1227.05
₹1271.25
₹1317.10
₹1359.50 (Final Target)
Technical Rationale
✅ Bullish Flag & Pole Breakout - Classic bullish pattern confirming uptrend continuation
✅ Strong Momentum - Daily, Weekly RSI >60 (Bullish zone)
✅ Volume Confirmation - Breakout volume 608.73K vs previous day's 302.91K (Nearly 2x surge)
✅ Multi-Timeframe Alignment - Daily and weekly charts showing strength
Key Observations
• The breakout comes with significantly higher volume, validating strength
• Well-defined pattern with clear price & volume breakout
• Conservative stop loss at recent swing low
Trade Management Strategy
• Consider partial profit booking at each target level
• Move stop loss to breakeven after Target 1 is achieved
• Trail stop loss to protect profits as price progresses
Disclaimer ⚠️
This analysis is strictly for educational purposes and should not be construed as financial advice. Trading in equities involves substantial risk of capital loss. Past performance is not indicative of future results. Always conduct your own research, consider your risk appetite, and consult a financial advisor before making any investment decisions. The author assumes no responsibility for any trading outcomes based on this information.
What do you think? Are you watching NSE:KAJARIACER for this breakout opportunity? Share your views in the comments!

ENGINEERS INDIA LTD - Bullish Flag & Pole Breakout (Daily T/F)Trade Setup
📌 Stock: ENGINEERS INDIA LTD ( NSE:ENGINERSIN )
📌 Trend: Strong Bullish Momentum
📌 Risk-Reward Ratio: 1:3 (Favorable)
🎯 Entry Zone: ₹242.00 (Breakout Confirmation)
🛑 Stop Loss: ₹211.00 (Daily Closing Basis) (-12.6 % Risk)
🎯 Target Levels:
₹253.95
₹266.50
₹279.50
₹293.45
₹307.90
₹327.00 (Final Target)
Technical Rationale
✅ Bullish Flag & Pole Breakout - Classic bullish pattern confirming uptrend continuation
✅ Strong Momentum - Daily, Weekly & Monthly RSI >60 (Bullish zone)
✅ Volume Confirmation - Breakout volume 20.96M vs previous day's 3.64M (Nearly 7x surge)
✅ Multi-Timeframe Alignment - Daily and weekly charts showing strength
Key Observations
• The breakout comes with significantly higher volume, validating strength
• Well-defined pattern with clear price & volume breakout
• Conservative stop loss at recent swing low
Trade Management Strategy
• Consider partial profit booking at each target level
• Move stop loss to breakeven after Target 1 is achieved
• Trail stop loss to protect profits as price progresses
Disclaimer ⚠️
This analysis is strictly for educational purposes and should not be construed as financial advice. Trading in equities involves substantial risk of capital loss. Past performance is not indicative of future results. Always conduct your own research, consider your risk appetite, and consult a financial advisor before making any investment decisions. The author assumes no responsibility for any trading outcomes based on this information.
What do you think? Are you watching NSE:ENGINERSIN for this breakout opportunity? Share your views in the comments!

SUI - SWING TRADESUI – Swing towards the ATH and aiming to create a new one, reacting within a weekly Liquidity Pool between 5.83 and 6.35.
LFG!
FLOKI Correction Complete & Ready to Rally!📊 CRYPTO:FLOKIUSD found strong buying interest in the blue box area at $0.000083 - $0.000074, setting the stage for a trend continuation to the upside.
🚀 Will momentum push it toward new highs?

ChainLink LINK gearing up for a move back toward $20CRYPTO:LINKUSD found strong buyers in the $14 - $12 equal legs zone after a three #elliottwave pullback, setting the stage for the next upside push.
Momentum is shifting—are you ready for the breakout?

DOGE | BULLISH Pattern | +100%DOGE is seemingly ready for more upside as we start to see a pattern resembling an inverse head and shoulders pattern:
✅Usually, the Inverse H&S plays out something like this:
📢But the pattern is not quite confirmed just yet. We'd need to see a close ABOVE the current resistance zone to validate the pattern:
If we can see that, it's likely that there can be BIG gains on DOGE. It will especially help if ETH makes more increases, showing that the general alt market is heading in the right direction.
____________________
BINANCE:DOGEUSDT

IRB INFRA: Cup & Consolidation Breakout🔍 Chart Analysis
The stock formed a textbook cup pattern, indicating accumulation after a long downtrend and also given 200 EMA breakout.
After forming the rounded base, it entered a tight consolidation range (highlighted in blue).
Today, the stock broke out of this range with strong bullish momentum and rising volume.
Immediate support lies at ₹49.25, the base of the consolidation box.
Next major hurdle: Strong resistance at ₹60.52, which aligns with a previous swing top.
📈 Why This Setup Looks Promising
Cup and handle patterns often precede major upward moves, especially when breakouts happen with volume.
Breakout from consolidation confirms bullish interest near ₹53 zone.
The stock has already corrected about 47% from its all-time high, offering a potential value opportunity if trend reversal sustains.
🎯 Levels to Watch
Support: ₹49.25
Resistance: ₹60.52
Breakout Confirmation Zone: ₹53.00–₹54.00
⚠️ Disclaimer
This is not investment advice. Please do your own research or consult your financial advisor before taking any position. The market is subject to risk and uncertainty.

XAUUSD Is XAUUSD getting ready for new ATHs? Gold has formed a clear bullish flag pattern and retested it clearly. One Thing I am looking for the retest of 50 DEMA . If the Price holds above the 50 DEMA, there are much chances that gold may target the new ATHs very soon.
What you guys think about it?

Pudgy Penguins PENGU Gearing Up for a +100% Move! 🐧 BINANCE:PENGUUSDT has completed its 5-wave advance from the April low (wave 1) and corrected with a 3-wave Zigzag structure in wave (2), reaching the buying area at equal legs $0.009 - $0.008.
🚀 Now, it's setting up for wave (3) higher, with an initial target at $0.022.
🌊 Are you positioned to catch the next wave higher?

Exploring Bullish Targets for Hyperliquid HYPE🚀 BINANCEUS:HYPEUSD has surged into a new ATH and the most bullish scenario suggests a nest structure forming.
🎯 This setup could lead to an extension beyond the 1.618 Fib level at $66, opening the door for +$100 range in the coming months.
Are you positioned for this breakout? What’s your personal target for this cycle?

LTCUSD💡 LTC/USDT – 4H Chart Setup
Bullish Divergence spotted on the 4H timeframe.
📌 Trade Plan
Entry (Buy Stop): 91.08 (Break of Lower High)
Stop Loss (SL): 81.95
Take Profit 1 (TP1): 98.89
Take Profit 2 (TP2): 106.86
📈 Risk Management
Open 2 positions
Once TP1 is hit, trail SL to Entry (EP) to secure risk-free run toward TP2
🧠 Reasoning:
Bullish divergence indicates potential reversal. Entry planned above the LH to confirm momentum shift.

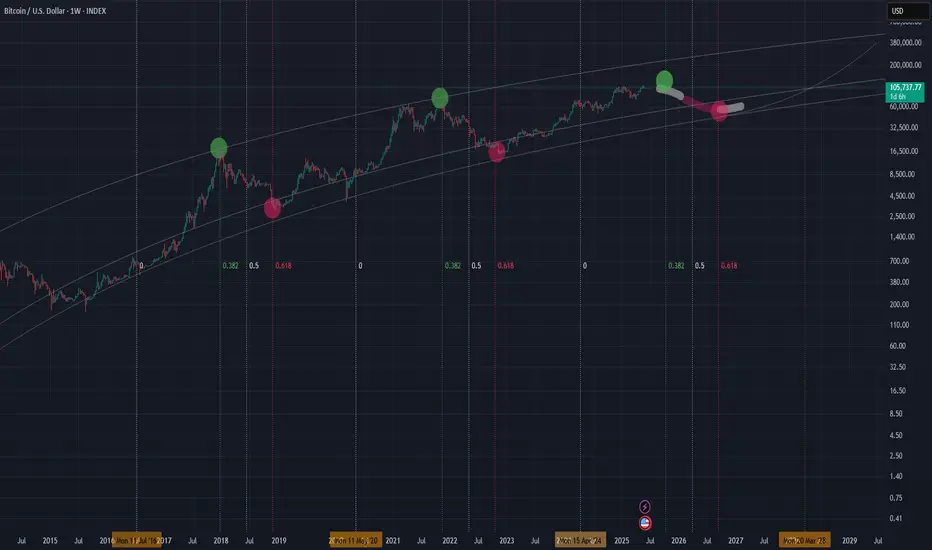
Last 133 days of the bull market!This idea gives more details about the pint in the cycle we are at right now. When measuring the duration between halving and tops we usually see the best in ~500 days after the halving. Following my previous idea about topping in October you can find the same pattern translating in 546 days after last halving. If this proves right , we are about 133 days before top. At this point we should see fireworks till October. In blue is price action in those 133 in 2017 and in yellow 2021, according to the btc nature of diminishing returns we should see peaks bellow those years.Cheers

Trend Base Fib Time suggesting getting out before October 2025!I have been warning you that time is running and a few months left before things start cooling off. This tool is trend base fib time , measured from one halving till the next one. I assumed halving in 2028 at some point in march so this result in a target of October to be the month matching with the 0.382 when peaks use to be found. The 0.618 would be the one for catching the bottoms around Sep 2026. Secure some gains and buy back at next bear market lows close to 40k. Cheers
RSI suggesting a bear market comingThis is BTC and it's RSI. Bellow you can see LMACD applied on the RSI indicator to see the trend more clearly. We might be on the stage that we can see higher prices like in 2021, but the bear trend is already printed. Sell some now and buy back at 40k next year. Cheers
