SEI ANALYSIS (1D)SEI is currently moving into a channel which is providing a very specific outlook.
At the moment, it is hard to determine if the outlook is bullish or bearish in the mid term.
If we ignore BTC and the possible altcoin bull run to cut out the noise, I believe this asset is either getting ready to pu
SEI / TetherUS PERPETUAL CONTRACT
0.3052USDTR
+0.0004+0.13%
As of today at 00:08 GMT
USDT
No trades
Key data points
No news here
Looks like there's nothing to report right now


SEI | Full AnalysisHere is the top-down analysis for Sei as requested 🫡
Weekly Timeframe:
We have a potential large structure forming on the weekly chart that will be activated once we break the ATH. Its target zone lies between $1.8 and $2.2.
My sell targets for SEI this cycle are:
TP1: $0.73
TP2: $1.14
TP3: $

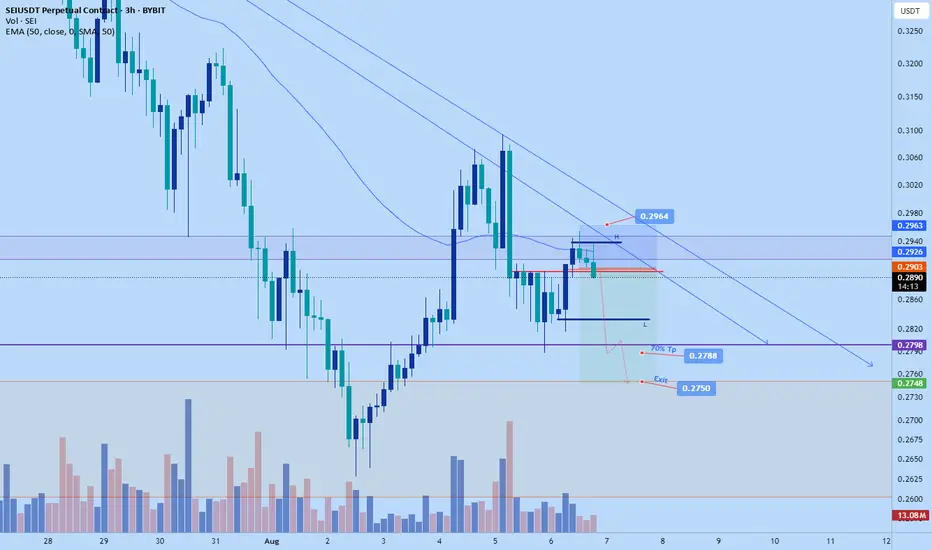
SEI/USDT at a Critical Level Golden Pocket Reaction Will Define?🔍 Technical Analysis:
1. Market Structure:
SEI/USDT is in a recovery phase after a significant downtrend.
Price is currently testing a crucial area between the Fibonacci retracement levels of 0.5 (0.2778) and 0.618 (0.2515) — known as the Golden Pocket Zone.
2. Key Support & Resistance Levels:

#SEI/USDT The best future belongs to this coin.#SEI
The price is moving within an ascending channel on the 1-hour frame, adhering well to it, and is on track to break it strongly upwards and retest it.
We have support from the lower boundary of the ascending channel, at 0.2967.
We have a downtrend on the RSI indicator that is about to break a

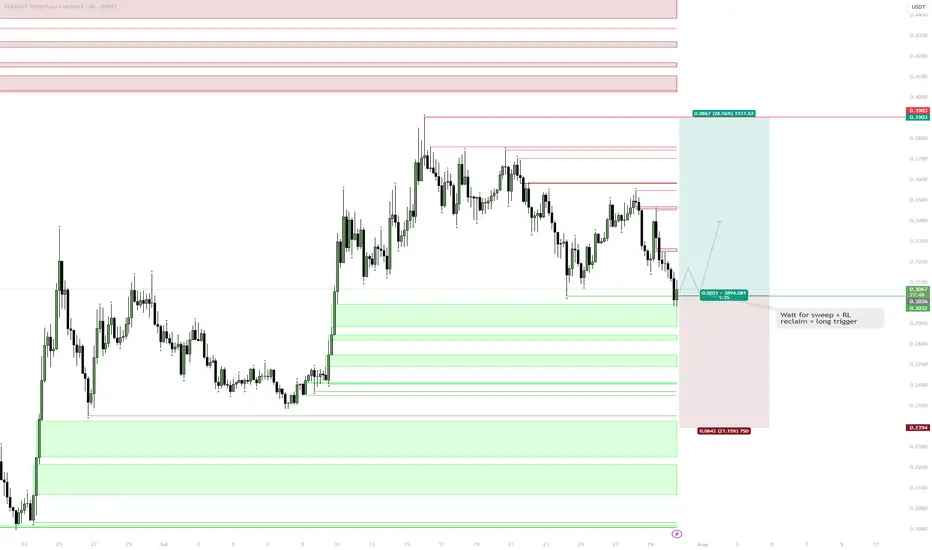
SEI | Setup: Sweep & Reclaim Scenario:Wait for a sweep of the range low (RL) into the Daily FVG (gray box).
Look for a reclaim of RL as the trigger for a long.
Reasoning:
Sweep into FVG traps late sellers and sets up liquidity for a reversal.
Reclaiming RL after the sweep signals strength and confirms a local bottom.
No need to cha
SEI : The best future belongs to this coin.Hello friends🙌
Given the rapid growth that this coin has had and I think it will continue, now that the price is correcting, there is a good opportunity to buy in stages with risk and capital management and move with it to the specified goals.
🔥Follow us for more signals🔥
*Trade safely with us*

SEI $0.33 back to ath?SEI since December bearish momentum to June.
Around June the bullish momentum started.
We´re looking for NYSE:SEI to continue and break through support at $0.34.
Macd = Avg Bullish
Rsi = Avg Bullish
Stoch Rsi = Bullish
If this zone holds, the risk/reward setup favors bulls with clear upside tar

See all ideas
Summarizing what the indicators are suggesting.
Oscillators
Neutral
SellBuy
Strong sellStrong buy
Strong sellSellNeutralBuyStrong buy
Oscillators
Neutral
SellBuy
Strong sellStrong buy
Strong sellSellNeutralBuyStrong buy
Summary
Neutral
SellBuy
Strong sellStrong buy
Strong sellSellNeutralBuyStrong buy
Summary
Neutral
SellBuy
Strong sellStrong buy
Strong sellSellNeutralBuyStrong buy
Summary
Neutral
SellBuy
Strong sellStrong buy
Strong sellSellNeutralBuyStrong buy
Moving Averages
Neutral
SellBuy
Strong sellStrong buy
Strong sellSellNeutralBuyStrong buy
Moving Averages
Neutral
SellBuy
Strong sellStrong buy
Strong sellSellNeutralBuyStrong buy
Displays a symbol's price movements over previous years to identify recurring trends.