US100 M15 FVG Reaction and Bullish Continuation Setup📝 Description
US100 on M15 is trading inside a corrective phase after a clear impulse. Price has dipped into a 15M FVG and is showing early signs of support and absorption, suggesting this move is a liquidity-driven pullback rather than a trend reversal.
________________________________________
📈 Signal / Analysis
Primary Bias: Short-term bullish continuation while holding above 25,540–25,560
Long Setup (Preferred):
• Entry (Buy): 25,560
• Stop Loss: Below 25,530
• TP1: 25,597
• TP2: 25,620 (15M FVG)
• TP3: 25,657 (BSL / range high)
________________________________________
🎯 ICT & SMC Notes
• Clean pullback into 15M FVG
• Signs of absorption, not acceptance lower
• Market structure still bullish on LTF
• BSL resting above recent highs
________________________________________
🧩 Summary
This looks like a classic pullback-to-continue setup. As long as US100 holds the current FVG, odds favor a push higher to collect buy-side liquidity near the highs. Acceptance below the FVG invalidates the long idea.
________________________________________
🌍 Fundamental Notes / Sentiment
With US indices still sensitive to macro headlines and rate expectations, shallow pullbacks into liquidity zones often resolve with continuation. Trade reactions, keep risk tight, and scale out into targets.
________________________________________
⚠️ Risk Disclosure
Trading involves substantial risk and may result in capital loss. This analysis is for educational purposes only and does not constitute financial advice. Always apply proper risk management, predefined stop-loss levels, and disciplined position sizing aligned with your trading plan.
Bullishsetup

IonQ (NASDAQ: IONQ) – Strong Reversal Structure Forming Within WIonQ is showing strong signs of recovery, holding firmly within the Fib golden zone and an overlapping weekly FVG that aligns with an OTE retracement, which previously broke market structure to the upside.
This confluence zone has proven to be a solid base of support, and as long as price continues to respect this level, the bias remains bullish.
From a swing perspective, our primary target zone sits around $136, completing a full bullish swing structure. Notably, recent fundamental analysis supports this outlook — with sources such as Yahoo Finance projecting long-term growth potential and even forecasting possible $1,000 price targets in extended market cycles.
Technical View:
- Weekly structure: bullish BOS confirmed
- Price holding key FVG/OTE confluence
- Next major liquidity targets: $84 → $136
Disclaimer: This breakdown is for educational purposes only and does not constitute financial advice. Always DYOR (Do Your Own Research) before making investment or trading decisions.

Birlasoft Holds Strong Momentum at Key SupportBirlasoft – Daily Timeframe Analysis
On the daily timeframe, Birlasoft is trading in a strong higher high–higher low (HH–HL) structure and is consistently respecting the Supertrend indicator.
As per Supertrend, the stock has a key support zone around ₹410–₹420.
If this support zone sustains, we may witness further upside based on price action.
The next potential upside target is placed near ₹500–₹510.
As long as the support remains valid, the overall trend in Birlasoft is expected to remain positive.
Thank you..

ETH M30 Bullish Continuation and Liquidity Expansion Setup📝 Description
ETH on M30 is holding a bullish structure after a controlled pullback into discount. Price respected the 0.618 OTE area and reacted cleanly, suggesting this move is corrective. With downside pressure absorbed, odds favor a bullish continuation toward higher liquidity.
________________________________________
📈 Signal / Analysis
Primary Bias: Bullish continuation while above 3,200
Long Setup (Preferred):
• Entry (Buy): 3,220 (OTE / reaction zone)
• Stop Loss: Below 3,195
• TP1: 3,242
• TP2: 3,282 (H4/H1 FVG)
• TP3: 3,309 (BSL / range high)
________________________________________
🎯 ICT & SMC Notes
• Clean reaction from OTE 0.618
• Structure still bullish on LTF
• FVG H4/H1 overhead acting as liquidity magnet
________________________________________
🧩 Summary
This looks like a pullback-for-continuation setup. As long as ETH holds above the OTE support, the higher-probability path is upside expansion toward stacked liquidity near 3.28k–3.31k.
________________________________________
🌍 Fundamental Notes / Sentiment
With crypto sentiment stabilizing and no immediate risk-off catalyst, technical structure and liquidity support a bullish continuation. Manage risk and scale out into upside targets.
________________________________________
⚠️ Risk Disclosure
Trading involves substantial risk and may result in capital loss. This analysis is for educational purposes only and does not constitute financial advice. Always apply proper risk management, predefined stop-loss levels, and disciplined position sizing aligned with your trading plan.

FARTCOIN - SWING SETUP Bullish breakout daily confirmed on #Fartcoin ✅ 🚀
All my lines looks good for more📈
Levels i'm watching for a SWING play:
0.5500 - 0.5900 - 0.6150 - - 0.6400 - 0.75500

AGIIL price action1 Trend Bullish
2 set up breakout
3. Consolidation before breakout
4 Breakout with good volume
5 wait for a pull back or change chart to smaller timeframe to make entry with small SL


EUR/CAD: Bullish Continuation After ConsolidationThe EURCAD pair had been accumulating within a horizontal range on the 4-hour timeframe for over a week.
Today, its resistance was breached with a strong bullish movement.
The price may experience further growth. The nearest resistance level is at 1.6174.

UNI / USDT Waiting for Liquidity Grab — Safer Entry at $5.46UNI / USDT is looking strong at current levels, but for a safer entry we are watching the $5.46 zone to allow liquidity below the higher lows and a fill of the 4H FVG. A clear reaction from this area would offer a much better risk-to-reward setup. Manage risk wisely, as buying at current price does not offer a favorable R:R.

ASTER / USDT Holding Key Support — Bullish Continuation SetupAs long as ASTER / USDT holds above the $0.741–$0.726 support zone, the structure remains strong for a bullish continuation toward $0.8720. Manage risk wisely and keep a close watch on it....Any breakdown below the key zone will invalidate this setup

ORDI / USDT : Short term setupORDI is trading near a key demand zone with potential for a 10–15% upside.
Using a two-entry plan to manage risk, with a possible secondary entry around $3.86–$3.75 if price dips.
Target remains near $4.52 as long as structure holds.
Patience and confirmation are key.
Not financial advice.

EURUSD H1 FVG Support and Bullish Recovery Setup📝 Description
EURUSD on H1 has pushed into the H1 FVG and is now showing signs of support and stabilization rather than acceptance below. The rejection from lower prices suggests this move is corrective, and price looks positioned for a bullish rotation back toward higher liquidity.
________________________________________
📈 Signal / Analysis
Primary Bias: Bullish recovery while above 1.1710
Long Setup (Preferred):
• Entry (Buy): 1.1718 (H1 FVG support)
• Stop Loss: Below 1.1707
• TP1: 1.1737
• TP2: 1.1754
• TP3: 1.1778 (H1 liquidity)
________________________________________
🎯 ICT & SMC Notes
• Price reacting positively from H1 FVG
• No bearish acceptance below imbalance
• BSL resting above recent highs
• Structure favors mean reversion higher
________________________________________
🧩 Summary
This looks like a sell-off into imbalance followed by absorption. As long as EURUSD holds above the FVG, odds favor a bullish move toward upper liquidity. Breakdown below support invalidates the long idea.
________________________________________
🌍 Fundamental Notes / Sentiment
With USD momentum fading and markets sensitive to incoming data, short-covering flows can easily support a EURUSD bounce. Let price confirm strength, then manage risk into targets.
________________________________________
⚠️ Risk Disclosure
Trading involves substantial risk and may result in capital loss. This analysis is for educational purposes only and does not constitute financial advice. Always apply proper risk management, predefined stop-loss levels, and disciplined position sizing aligned with your trading plan.

BTCUSDT: Range Compression Signals Potential Break Above $90,100Hello everyone, here is my breakdown of the current BTCUSDT setup.
Market Analysis
BTCUSDT is trading within a broader consolidation after a strong bearish impulse earlier in the chart. Following the sell-off, price found a key support base around the 87,300 Support Zone, from which buyers stepped in and stabilized the market. Since then, Bitcoin has been moving inside a series of well-defined ranges, indicating compression and balance between buyers and sellers. Structurally, price is capped by a descending triangle resistance line, while at the same time respecting a rising trend line from below. This creates a tightening structure, suggesting a potential directional move ahead.
Currently, BTC is consolidating above the support zone and just below the 90,100 Resistance Zone, which has repeatedly rejected price in recent attempts. The latest pullbacks remain shallow and corrective, showing that sellers are struggling to push price back below support.
My Scenario & Strategy
My primary scenario as long as BTCUSDT holds above the 87,300 Support Zone, the structure remains constructive and biased toward a bullish resolution. A sustained hold above support could allow price to build momentum for another push toward the 90,100 Resistance Zone. A clean breakout and acceptance above this resistance would confirm bullish continuation and open the door for further upside.
However, a decisive breakdown below the support zone would invalidate the bullish scenario and shift focus toward lower levels. For now, BTC remains compressed between support and resistance, with buyers defending structure and pressure building for a potential breakout.
That's the setup I'm tracking. Thank you for your attention, and always manage your risk.

Graphite: Major Pattern Formation | Breakout or Still BuildingGraphite India – Daily Timeframe Technical View
This is the daily timeframe chart of Graphite India.
The stock has formed a Right-Angled Ascending Broadening Formation, with a strong support zone near 500–520. The broadening structure appears to have completed a five-wave formation, while the key resistance zone is placed near 690–700.
A decisive breakout above the resistance zone, preferably with volume confirmation, could trigger a strong upside move. Based on Fibonacci projections, the final pattern target is placed near 940.
As long as the stock continues to hold above its key support zones, the ongoing rally is likely to continue, keeping the broader trend positive.
Thank you.

EURUSD: Bullish Structure Holds - Market Eyes 1.1810 ResistanceHello everyone, here is my breakdown of the current EURUSD setup.
Market Analysis
EURUSD is trading within a well-defined bullish structure after breaking out of a descending triangle formation, signaling a clear shift in control from sellers to buyers. The initial breakout was followed by a brief consolidation phase, where price formed a tight range, suggesting accumulation rather than distribution. After this pause, the pair continued higher and successfully broke above the triangle resistance line, confirming bullish continuation.
Currently, EURUSD is trading above a rising trend line, which continues to act as dynamic support. The market recently tested the Resistance Zone around 1.1810, where selling pressure appeared, leading to a short-term pullback. This retracement is now developing toward the Support Zone near 1.1760, which aligns with the previous breakout area and the ascending structure. As long as price holds above this support, the broader bullish trend remains intact and the pullback appears corrective.
My Scenario & Strategy
My primary scenario remains bullish while EURUSD holds above the 1.1760 Support Zone. I expect buyers to defend this area and push price higher for another attempt toward the 1.1810 Resistance Zone.
Therefore, a clean breakout and acceptance above resistance would confirm bullish continuation and open the way for further upside expansion. However, a decisive breakdown below support would weaken the structure and signal a deeper correction. For now, price action continues to favor buyers as long as the ascending structure holds.
That's the setup I'm tracking. Thank you for your attention, and always manage your risk.

no caption #4 usdjpy going up compressing above the last support zone. might have a little liquidity sweep on the downside but HTF looks bullish in my opinion.
Happy trading and happy new year

NIFTY Holding Key Support — Reversal in FocusNIFTY 50 – Daily Timeframe Support & Outlook
On the daily timeframe, NIFTY 50 is currently placed near an important short-term support zone.
Short-Term Support Zone: 25,740 – 25,770
If this support zone breaks decisively, NIFTY may extend its decline toward the major support area at 25,200 – 25,300
Reversal & Upside Scenario
If NIFTY sustains above the short-term support range of 25,550 – 25,700, a technical reversal is possible.
In such a case, the index may witness an upside move toward 26,300 followed by 26,600.
Thank You...

Bullish – SQD🐂 LONG – SQD
Price is accelerating on the 15m timeframe, accompanied by a clear expansion in trading volume—confirming strong short-term buying pressure. On the 1h timeframe, this move still appears to be a healthy pullback within a broader structure rather than a distribution phase. As long as price holds this level, the probability of a momentum continuation to the upside remains high.
This setup reflects a classic pullback + volume expansion scenario, where buyers are stepping in early ahead of the next impulsive leg.
🎯 TP: 0.0934
🛡️ SL: 0.05463
📊 RR: 1 : 7.58
A high-RR momentum long: intraday strength + higher-timeframe structure support → asymmetric upside potential.


BTCUSD DROP OR FLY (READ CAPTION)Hi trade's what do you think about btcusd
BTCUSD is currently maintaining a bullish market structure, with price holding above key support levels and showing strong buyer interest on pullbacks. The overall price action suggests a potential continuation toward higher levels.
🔹 Support: 87,600
This is the primary support level where buyers have previously stepped in.
As long as BTC holds above 87,600, the bullish bias remains valid.
🔹 Support: 86,300
This level acts as a strong secondary support and deeper retracement zone.
If price pulls back toward 86,300, it may offer a high-probability buying opportunity within the bullish trend.
🔹 Resistance: 90,400
This is the key resistance level where price may face temporary rejection or consolidation.
A confirmed breakout and close above 90,400 will strengthen bullish momentum.
🔹 Supply Zone: 92,400
This is the major upside target and supply area.
If BTC breaks above 90,400, price is likely to move toward the 92,400 supply zone, where sellers may attempt to slow the move.
A strong breakout above this zone could signal further upside continuation.
📈 Market Outlook
Holding above 87,600 / 86,300 → Bullish continuation expected
Break above 90,400 → Opens path toward 92,400 supply zone
Supply zone reaction will determine the next major move
Overall, the structure supports a bullish pullback followed by continuation scenario.
please dpon't forget to like comment and follow

CMCT Squeeze Indicator AnalysisUsed the EMA 9, EMA 21, Squeeze Indicator, and ATR indicator to map out squeeze zones and price movement in the last month plus. The bulls over at CMCT have brass balls and diamond hands and have locked the float. Despite massive manipulation this thing is about to go to the moon. Last week they washed 60% SI down to 4% on Monday with no covering and just last Thursday accrued another 56% Live Short Interest just to suppress the momentum. The pressure cooker is boiling and the shorts keep trying to put the fire out with gasoline by continuing to short with 400% CTB. I am no chart guru, this is my first time posting a chart and my first time using any of these indicators. Regardless, Ive been hodling and accumulating for 2 weeks and can sense the shift. Now would be a great time to get in and HODL for 20+ Lets finish 2025 with a bang! BULLS UNITE!
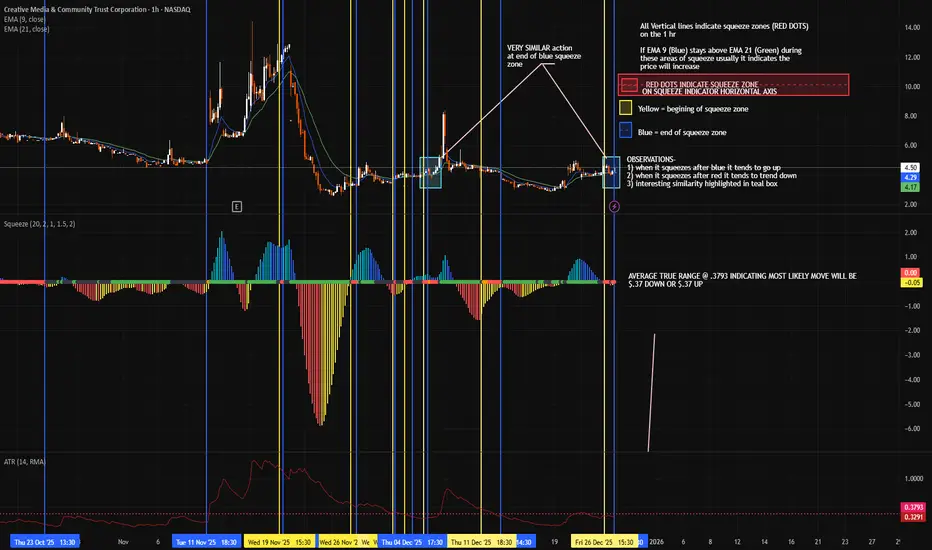
CMCT SQUEEZE IMMINENTUsed the EMA 9, EMA 21, Squeeze Indicator, and ATR indicator to map out squeeze zones and price movement in the last month plus. The bulls over at CMCT have brass balls and diamond hands and have locked the float. Despite massive manipulation this thing is about to go to the moon. Last week they washed 60% SI down to 4% on Monday with no covering and just last Thursday accrued another 56% Live Short Interest just to suppress the momentum. The pressure cooker is boiling and the shorts keep trying to put the fire out with gasoline by continuing to short with 400% CTB. I am no chart guru, this is my first time posting a chart and my first time using any of these indicators. Regardless, Ive been hodling and accumulating for 2 weeks and can sense the shift. Now would be a great time to get in and HODL for 20+ Lets finish 2025 with a bang! BULLS UNITE!
