GBPUSD - 30min | OutlookGBPUSD looks like there's still some bullish momentum heading up to 1.323xx where new opportunities could present themselves, if GBPUSD manages to successfully break the diagonal resistance and close above 1.325xx we could expect to see more bullish momentum leading up to 1.35xxx and based on the current Outlook on the $-index we could see a weakening USD thus fueling the current bullish narrative, else if GBPUSD fails to break 1.324xx we could expect to see new short term bearish opportunities.
Bullishsetup

Adani Enterprises: The Bull Is Roaring Loud!This is the daily timeframe chart of Adani Enterprises.
The stock is moving within a well-defined parallel channel, with a strong support zone around the 2250–2300 range. After the recent decline, the stock respected this zone and started a fresh bullish rally from the support.
Earlier, the stock formed a negative pattern, which led to a decline, and its target has already been achieved near the support area. From there, the price has shown a strong rebound.
Currently, the stock is trading near the Middle of the channel, where resistance lies between 2520–2540 on the shorter timeframe.
Once this resistance zone is broken, the stock will have no immediate boundary, and the next upward move could extend toward 2800–2850.
If this rally continues and the support zone holds, we may witness higher levels ahead in Adani Enterprises.
Thank you.

XAUUSD IDEA FOR 10TH OCT, 2025. (2H)Here we go again, I'm back at trading the XAU against the USD. It's been a hell of a ride this year, but it is what it is. The Pair is bullish due to sentiment and because Gold is known as a safe-haven asset, and currently, investors are long on the pair because of the weak USD
As we can see, the pair is resuming back on its overall trend from a previous retracement, so what's next?
Note: This is a very volatile pair and often filled with manipulations ensure to risk what you can afford to lose.
As usual, my calls or analysis are based on what I see, the current Bias, and from a probability standpoint, meaning that this projection may be or may not be validated, so tread carefully. This is not financial advice; trade responsibly.

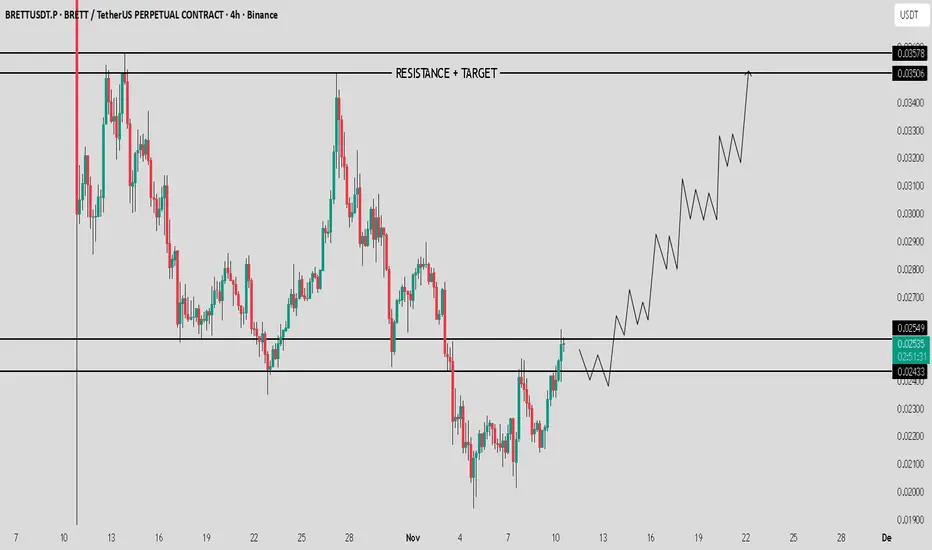
BRETT / USDT : 30-40% move ahead if breakout confirmsBrett / USDT is showing strong momentum and currently testing key zones.
A confirmed breakout from this level could trigger a 30-40% bullish move.
Wait for confirmation and manage risk wisely.
USDJPY IDEA FOR 10TH OCT, 2025. (2H)A New Trading week is here again, expecting fresh information, volumes, and data to flood the markets this week, plus we expect high-impact news releases as well
However, currently the USD against the JPY is still overall bullish and trending because the pair is still breaking higher highs and forming new swings and structure patterns from my frame work below. I expect a short move downwards during LND sessions and, hopefully, a continuation later during the NY session. meanwhile, we wait for possible confirmations of trade ideas.
As usual, my calls or analysis are based on what I see, the current Bias, and from a probability standpoint, meaning that this projection may be or may not be validated, so tread carefully. This is not financial advice; trade responsibly.

BTC UpdateBTC has tested 50% rejection block on weekly time frame, forming a lower wick. This is clear indication that a trend shift from bearish to bullish market is on the way. As per normal market structure mapping, BTC has formed a LL, as you can see in the image below. Since BTC has swipped the RB liquidity, there's a high chance that CHOCH might soon occur and BTC might go bullish.

EURUSD Bullish IdeaI've been following EU and DXY since last week, I find it bullish as Dxy has purged BSL now it's going to go down for few weeks and EU will be bullish for few weeks.

Zomdf bull thesis Zomdf is in a good spot to catch a bounce to .47. Then .82 ,gap at .99. Once this is over $1.00 it will squeeze to 2.08 which is my profit target.
If you use MA's. This broke the reclaimed and just held the retest of the 200 day SMA.
This capitulated in March with over 282 million is sale vol. Since then you have a rounded bottom. And recently the tech company that uses AI for you furry friends had great earnings.
I believe that this is a $2 stock by mid next year. But DYOR.

AIA VS BLESS - MOONSHOT SESSION INCOMING ??? OMG IS THAT REAL? 👀👀👀
NASDAQ:AIA made a 2300% + pump in few days.. 🔥
Guess what,
SET:BLESS Chart structure looks similar 💣
Price manipulation, or real moonshot session incoming for #BLESS ?? 🟩🚀

Tempus AI — Is This Where Time Turns Bullish Again?Fundamental View
Tempus AI (NASDAQ: TEMP) continues to attract attention with major partnerships in the AI and biotech space — including collaborations with AstraZeneca, Illumina, and Boehringer Ingelheim.
These deals strengthen its role in using AI for diagnostics and drug development, giving it strong long-term growth potential.
However, as a newly listed and high-growth company, short-term volatility remains likely.
Technical View
Price has made a sharp retracement into the golden OTE zone ($72–$63), overlapping a high-probability Fair Value Gap (FVG) and the weekly bullish Order Block (OB).
This zone represents a key area of interest where smart money could accumulate.
Safer traders will wait for confirmation signals within this zone, while aggressive entries could scale in early with managed risk.
Upside targets are $103 for partial profit and $155 for a full swing continuation.
Outlook
Tempus sits at a critical turning point — strong fundamentals meet a high-probability technical setup.
If the golden zone holds, a bullish reversal could unfold toward major liquidity levels.
Patience and confirmation remain key before full commitment.
⚠️ Disclaimer: This breakdown is for educational and entertainment purposes only. It is not financial advice — always DYOR and trade responsibly.

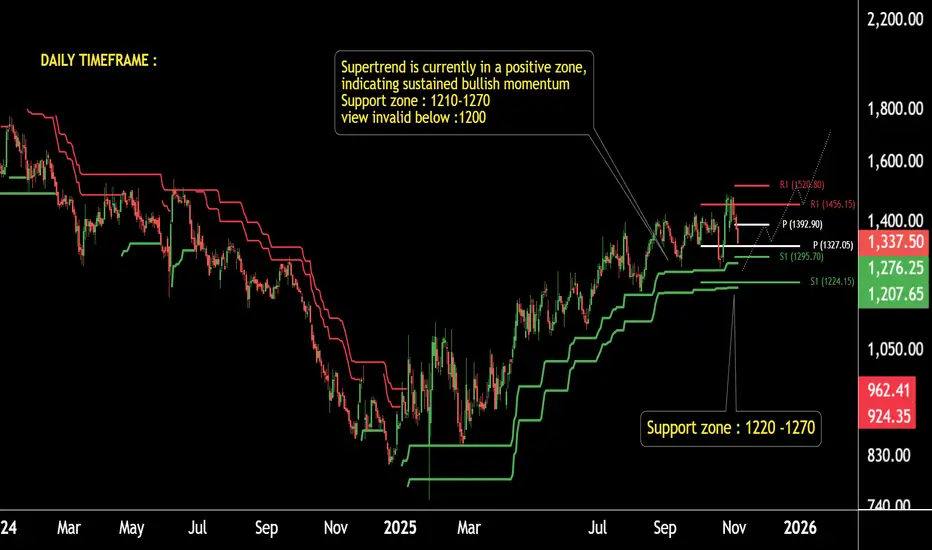
CREDITACC Heating Up… Key Levels Triggering the Next Bull Move!This is the daily timeframe chart of CREDITACC.
The stock is moving within a well-defined structure and consistently respecting the Supertrend support on every decline.
Each time it touches the Supertrend zone, the price forms a fresh higher high, maintaining a strong upward rhythm.
The current Supertrend support zones are placed near 1270 and 1220. The stock also holds a firm pivot support around 1224.
If this momentum continues and the stock keeps respecting these support levels, we may see higher prices in the coming sessions.
THANK YOU !!
ZKUSDT - A long upward journey is about to beginWe literally caught the bottom in the previous analysis — no doubt about it.
The chart looks extremely bullish and is showing massive upward momentum.
There’s a huge falling wedge pattern that has broken out and been successfully retested on the daily timeframe, with a potential target of 5x from here.
Best Regards:
Ceciliones🎯

DigitalOcean: Quiet Cloud Stock with Big PotentialIntroduction
While everyone is focused on AI giants like NVIDIA and the big cloud players, there’s a quieter cloud company quietly gaining momentum.
DigitalOcean (DOCN) may not grab headlines, but its fundamentals and technical setup make it an interesting stock for investors seeking growth in the cloud infrastructure space.
Fundamentals
DigitalOcean’s financials show strong growth:
Revenue: +12–13% year-over-year
EPS: +~80% year-over-year
The company currently has no buyback program, and there’s a slight share dilution, but the growth trajectory more than offsets this.
Key valuation metrics:
Forward P/E: 19
P/S: 4
This places the stock at roughly four times revenue, which is attractive considering its rapid earnings growth.
Overall, from a fundamental perspective, DigitalOcean is healthy — cash flows are improving, profits are up, and the business is in a solid growth phase.
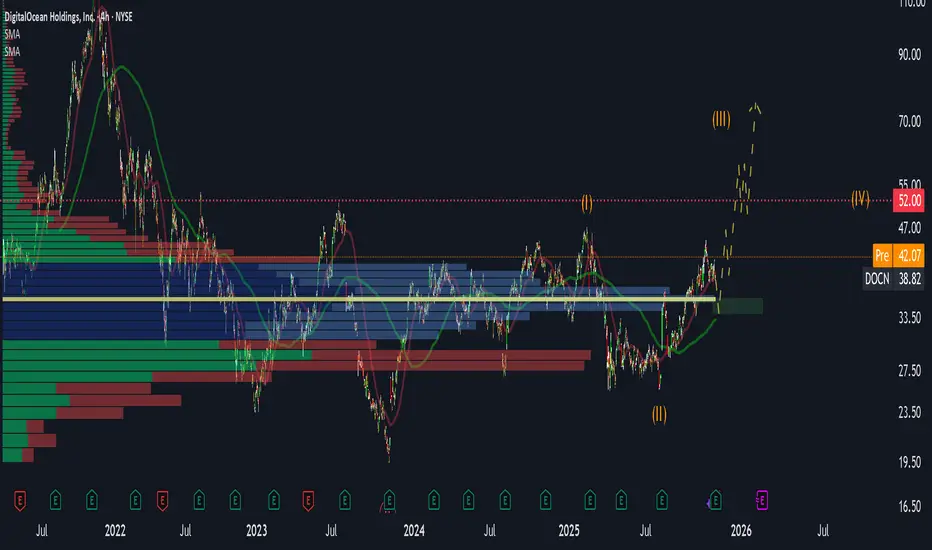
Technical Analysis
On the chart, using a Fixed Range Volume Profile, the largest volume cluster sits around $30–40, suggesting smart money accumulation.
Price has been compressing toward $52, forming a classic wave structure:
First wave, Second wave
Another first, second sequence
This coiling pattern indicates a potential breakout.
Upside target: ~$130 if the $52 resistance is broken
Possible short-term dip: ~$35 to fill an unclosed gap
The technicals suggest a bullish setup for traders looking at momentum and accumulation zones.
Conclusion
DigitalOcean is currently a long-term holding in my portfolio.
The combination of solid fundamentals and bullish technical setup makes it a stock to watch.
If growth continues at the current pace, triple-digit prices are realistic.
Traders can use this setup to watch key levels: $52 for breakout confirmation and $30–40 as a base accumulation zone.
HTZ:From Breakdown to Breakout,Bullish Reversal Gaining TractionHertz Global Holdings, Inc. (NASDAQ: HTZ)
Technical Outlook: Potential Reversal Following Structural Breakout
Date : 5 November 2025
Summary
Hertz Global Holdings (HTZ) has exhibited signs of a potential medium-term trend reversal following a prolonged downtrend since mid-2023. Multiple bullish technical signals — including a breakout from key continuation patterns, RSI divergence, and sustained support retests — point toward a possible shift in market sentiment.
Price Action and Technical Developments
1. Downtrend continuation : Since July 2023, HTZ has been in a persistent downtrend, reinforced by a breakdown below major horizontal support.
2. Symmetrical triangle breakdown (Feb 2024) : The stock failed to hold within a consolidation structure, confirming bearish momentum at that stage.
3. Bullish divergence (Sept 2024) : Despite registering new price lows, the RSI formed higher highs, suggesting weakening downside momentum and potential for reversal.
4. Falling wedge breakout (Nov 2024) : Price action reversed from a classic bullish pattern, followed by a strong rally through the end of November.
5. Symmetrical triangle breakout (Apr 2025) : HTZ broke out of consolidation on elevated volume, coinciding with a break above the long-term descending trendline — a key technical inflection point.
6. Current setup (Nov 2025) : The share price is consolidating within a falling channel. On 4 November 2025, it rebounded from a confluence of supports — including the uptrend line from September 2024 and prior resistance turned support — reinforcing near-term bullish bias.
Trading Idea
Entry Zone: 4.71 - 5.50
Target: 10.50 and 15.00
Support: 4.71
Conclusion
After a long downtrend, HTZ is showing a clear shift in momentum. With multiple bullish patterns confirmed and strong support holding, the stock may be entering a new uptrend phase toward USD 10.50 and USD 15.00.

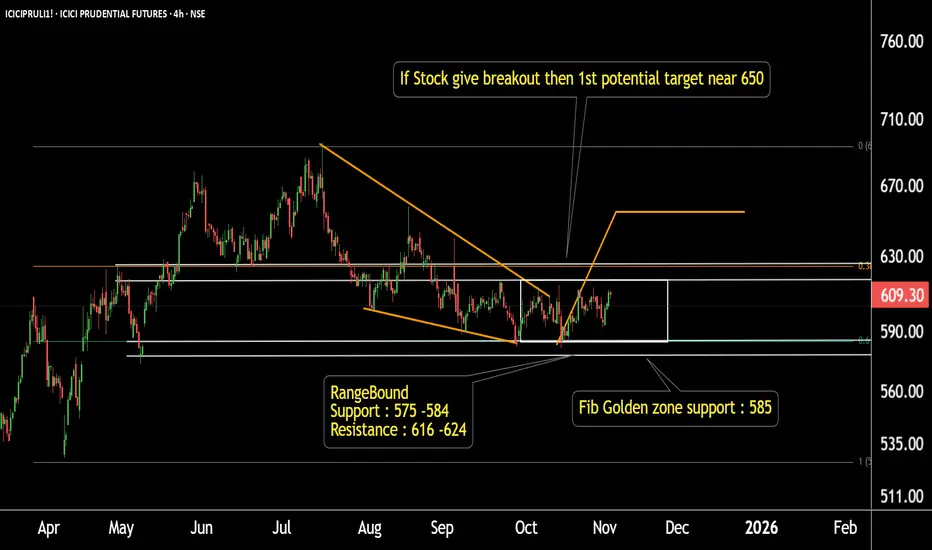
ICICI Prudential: Range-Bound Phase, Eyeing a Potential BreakoutICICI Prudential FUTURES (4-Hour Timeframe Analysis)
ICICI Prudential is currently holding a strong support zone based on Fibonacci and range-bound structure near ₹575–585.
On the upside, the stock may face resistance around ₹615–618.
If the price manages to break above this resistance zone, the next potential target could be around ₹640–650.
Thank you !!
NVIDIA currently at resistance.NVIDIA found resistance at the horizontal level and could be stuck for a while. If it may break then we will se a HUGGEE rise to the next arc.
Both are fine by me

Grab (GRAB) – Riding the Trend WaveGrab is looking grabbingly strong 😎 — making higher highs and higher lows since 7 April 2025, up almost 95% until 23 September 2025!
The stock broke out of its downtrend line from 21 Nov 2024 with big volume on 11 Sep 2025 — strong confirmation that bulls are taking charge. After the breakout, price retested the trendline (now support) twice and also bounced right from the Fibonacci 38.2% zone. Beautiful confluence! 🎯
The uptrend line from April is still holding well — as long as this stays intact, the party’s not over yet 🕺
📈 Trade Idea:
Entry zone: 5.65 – 5.37
Targets:
TP1 👉 6.60
TP2 👉 7.10
Support / Invalidation: 5.37 zone, uptrend line, or old downtrend line turned support
Summary:
Grab is acting like a true comeback kid 💪 — breakout ✔️, retest ✔️, uptrend intact ✔️.
If momentum keeps building, we might be seeing the next leg up soon! 🚀

100% Win Rate Trade For SHIB Coming Soon!I'm currently observing a potential trading setup in SHIB/USD that mirrors historical patterns we've analyzed. A review of six similar past movements provides us with a data-driven framework for what we might expect.
Historical Performance Snapshot:
• Back testing Win Rate: 100% (6 out of 6 historical setups resulted in upward moves)
• Average Gain: 66.50%
• Average Duration: 46 days
Key Statistical Insights:
• Duration Consistency: The duration of these movements has been moderately consistent, with a standard deviation of just 9.5 days. This suggests a typical timeframe of 36-56 days for a move to play out.
• Gain Variability: It is crucial to note that the gains have been highly variable, with a standard deviation of 30.82%. Past movements have ranged from a 42% gain to as high as 125%.
Back testing Results: It's worth noting that our back testing of this setup shows a 100% win rate across all six historical instances. Every time this pattern has appeared, it has resulted in an upward move. However, while the direction has been consistent, the magnitude of gains has varied significantly.
Interpretation: While the timing of these upward trends has been relatively predictable, the magnitude of the final gain is not. This means that while a move could last approximately a month and a half, the profit potential has a wide range of outcomes.
My Approach: Given the high variability in gains, I'll be watching this setup with a focus on risk management. Setting flexible profit targets and a clear invalidation level is key. This is not financial advice, but an observation based on statistical analysis. Please conduct your own research and manage your risk accordingly.
I will update once the buy signal is in and then once the closing signal appears.
Unfortunately I can not use the other RSI I normally use as its been updated and I am not allowed to upload it due to Trading View rules. The Stochastic RSI is the closest thing I could find to it for now or that allows me to give a visual representation of the trade.
Have a blessed week ahead!
COINBASE:SHIBUSD BINANCE:SHIBUSDT

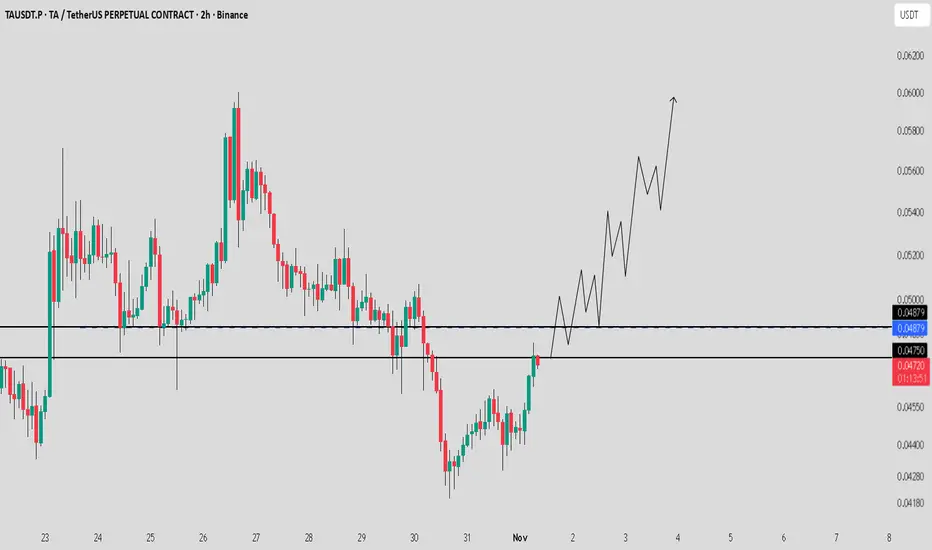
TA / USDT : Breakout setup loading / Target $0.55 - $0.60TA / USDT is showing strength and currently testing a key resistance zone.
If price breaks out with strong momentum, we may see a bullish move toward $0.55 – $0.60.
Manage risk wisely and always wait for clear breakout confirmation before entering.
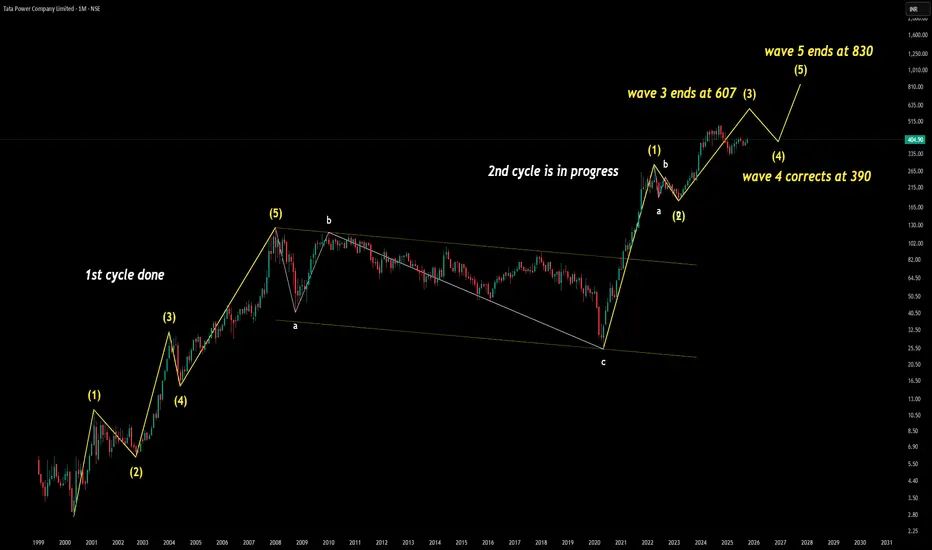
2 Elliot Wave Cycle candidate 1st Cycle – Completed
Impulse Waves: (1) → (5)
Corrective Waves: A → B → C
Classic wave symmetry with post-correction breakout
2nd Cycle – In Progress
Wave (1) and (2) formed strong base
Wave (3) extended sharply, ends at 607
Wave (4) correction expected near 390
Wave (5) projected target: 830+
Analyst Learning Takeaways
Wave 3 typically shows strongest momentum—confirmed here with a sharp rally to 607
Wave 4 often retraces 38–50% of Wave 3, making 390 a logical support zone
Wave 5 tends to mirror Wave 1 or exceed it if sentiment and volume align
Analyst View The current wave structure suggests a healthy impulsive cycle with textbook symmetry. Wave 3 has shown strong directional conviction, and the expected Wave 4 correction toward 390 aligns with Fibonacci retracement norms. If price stabilizes above 390, it confirms buyer strength and sets the stage for Wave 5. The projected target of 830+ is based on proportional extension logic and prior cycle behavior. This setup resembles the 2014 rally, where a similar Wave 4 held and led to a breakout. Traders should monitor volume and sentiment near 390—any breakdown below this level would invalidate the bullish continuation and call for reassessment.
TCS 60 MINS TIME FRAME MY VIEW The Structure looks good to us, waiting for this instrument to correct and then give us these opportunities as shown on this instrument (Price Chart).
Note: Its my view only and its for educational purpose only. Only who has got knowledge about this strategy, will understand what to be done on this setup. its purely based on my technical analysis only (strategies). we don't focus on the short term moves, we look for only for Bullish or Bearish Impulsive moves on the setups after a good price action is formed as per the strategy. we never get into corrective moves. because it will test our patience and also it will be a bullish or a bearish trap. and try trade the big moves.
We do not get into bullish or bearish traps. We anticipate and get into only big bullish or bearish moves (Impulsive Moves). Just ride the Bullish or Bearish Impulsive Move. Learn & Know the Complete Market Cycle.
Buy Low and Sell High Concept. Buy at Cheaper Price and Sell at Expensive Price.
Please keep your comments useful & respectful.
Keep it simple, keep it Unique.
Thanks for your support
Tradelikemee Academy
Saanjayy K G

Opendoor Technologies (OPEN) – Bulls Still Holding the Door OpenWhat a ride it’s been for OPEN!
Back in early July 2025, the stock finally broke above its 50-day MA, and that was the spark that started an incredible rally — all the way to a major resistance zone from June 2022.
Then, as always, the market had to test everyone’s patience — a shooting star reversal formed, price pulled back into the 0.382–0.5 Fibonacci zone, and built a solid double bottom.
Once that double bottom broke out around 13–14 August, it was rocket fuel — a massive +247% run until 11 September 2025! 🚀
Since that peak, OPEN has been cooling off — retracing with low volume and shaping a falling wedge, which usually hints at bullish continuation. The price even bounced at EMA-50 and printed a hammer candle, showing that buyers are still defending the trend.
As long as the price holds above $6.23 (hammer support), bulls are still in charge.
Break that level? Then the bears might finally get a turn.
Until then — the door’s still open for another breakout! 😉
Trade Idea 💡
Bullish scenario: Wait for a breakout above the falling wedge with volume — that’s your green light.
Support to watch: $6.23 (hammer low).
Stop loss: Just below that support.
Take profit: Trail as long as price stays above the MA-50 or aim for the $13.70 zone .

NHPCi Observed these Levels based on Price Action and Demand & Supply which is my own Concept "PENDAM CONCEPTS"... Please don't take any trades based on this chart/post... Because this chart is for educational purpose only not for Buy or Sell Recommendation... Thank Q
