TradeCityPro | Bitcoin Daily Analysis #183👋 Welcome to TradeCity Pro!
Let's dive into today's Bitcoin analysis. The market has had an upward movement. Let's see what's ahead in the market.
⏳ 1-Hour Timeframe
Yesterday, I mentioned that there was a high probability of movement and that it would be a good idea to keep an eye on the chart during the New York session as the market could move.
📊 With the start of the New York session, good buying volume entered the market, and after breaking 109890, Bitcoin started an upward wave.
🔑 The first area where the price could have faced resistance was 111605, which was broken on the first attempt. After a pullback, the next leg started.
🚀 The break of 109890, along with RSI entering Overbuy and the entry of buying volume, was a good trigger for a long position, and we could have opened a position with it.
⭐ Now, the price has reached a very important resistance zone, and the probability of a correction starting is high. For taking profit, I suggest you lock in profits whenever RSI exits the Overbuy zone, as this will reduce the upward momentum and increase the chances of a correction.
📈 For new positions, no triggers are available yet, and it's better to wait until the market gives us a clearer structure. However, if the price reacts several times to the level, we can open a long position in subsequent attempts if it breaks.
❌ Disclaimer ❌
Trading futures is highly risky and dangerous. If you're not an expert, these triggers may not be suitable for you. You should first learn risk and capital management. You can also use the educational content from this channel.
Finally, these triggers reflect my personal opinions on price action, and the market may move completely against this analysis. So, do your own research before opening any position.
Bulrun

TradeCityPro | Bitcoin Daily Analysis #182👋 Welcome to TradeCity Pro!
Let’s move on to Bitcoin analysis. Today the weekly candle closes, and from tomorrow the market can start moving again.
⌛️ 4-Hour Timeframe
On the 4-hour chart, Bitcoin has started a downward move from the 117,570 high, dropping in two bearish legs down to the 108,750 zone.
✨ After reaching this area, volume began to decrease—both because the market is ranging and because it’s the weekend.
✔️ Yesterday, in my analysis, I highlighted a range box on the 1-hour chart. This same box is still visible now on the 1-hour timeframe, spanning 108,750 to 109,890.
🧩 Today’s New York session is very important, since this session often drives weekend market moves. So watch the market carefully,our triggers might get activated.
🔑 If strong volume enters today and 108,750 breaks, we can look to open a short position. However, keep in mind there’s an important support area just below this level that could prompt a reaction and halt further decline.
⭐ For a long position, the first trigger we have is a breakout of 109,890. But note that the short-term trend is still bearish, so it’s better to wait for bullish confirmation first. A clean break of 109,890, followed by a higher high and higher low above this level, would be a solid confirmation for a potential upward move.
❌ Disclaimer ❌
Trading futures is highly risky and dangerous. If you're not an expert, these triggers may not be suitable for you. You should first learn risk and capital management. You can also use the educational content from this channel.
Finally, these triggers reflect my personal opinions on price action, and the market may move completely against this analysis. So, do your own research before opening any position.

TradeCityPro | Bitcoin Daily Analysis #181👋 Welcome to TradeCity Pro!
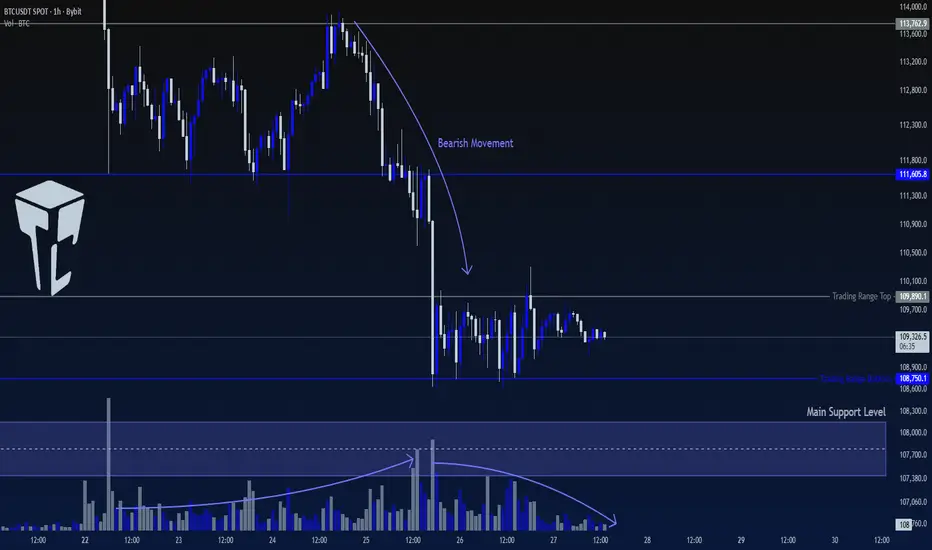
Let's dive into Bitcoin analysis, today is Saturday, and it's part of the weekend, so the market is relatively quiet. Bitcoin has shown some bearish movement, and now is a critical moment for decision-making.
⏳ 1-Hour Timeframe
After breaking 111,605, Bitcoin dropped and reached 108,750.
✔️ During the downward move, volume increased, indicating strong selling pressure. However, as the price reached the 108,750 support and formed a range box, volume decreased, and with the start of the Saturday candle, the volume has dropped to its lowest level.
🎲 This box is formed above a very important support level, so breaking this box is crucial.
🔔 If the price breaks the box to the downside, the likelihood of breaking the support increases. However, one important thing to note is that shorting after breaking 108,750 is not an ideal trigger because the price might bounce from the support, causing a stop-loss.
📊 On the other hand, if the box breaks to the upside, we can assume that the price is correcting the downward move and could potentially retrace back to 111,605.
💥 If the price stabilizes above 111,605 or forms a higher high and low above 109,890, we can take this as the first sign of a bullish reversal.
🧩 Overall, neither shorting nor longing seems ideal at the moment, so I believe the best choice is to wait and see if the price either stabilizes below the support and moves downward or moves upward again, in which case we can consider entering a long position.
❌ Disclaimer ❌
Trading futures is highly risky and dangerous. If you're not an expert, these triggers may not be suitable for you. You should first learn risk and capital management. You can also use the educational content from this channel.
Finally, these triggers reflect my personal opinions on price action, and the market may move completely against this analysis. So, do your own research before opening any position.
TradeCityPro | Bitcoin Daily Analysis #180👋 Welcome to TradeCity Pro!
Let’s move on to Bitcoin analysis. Yesterday Bitcoin continued its drop and made another downward move. Let’s check the market together.
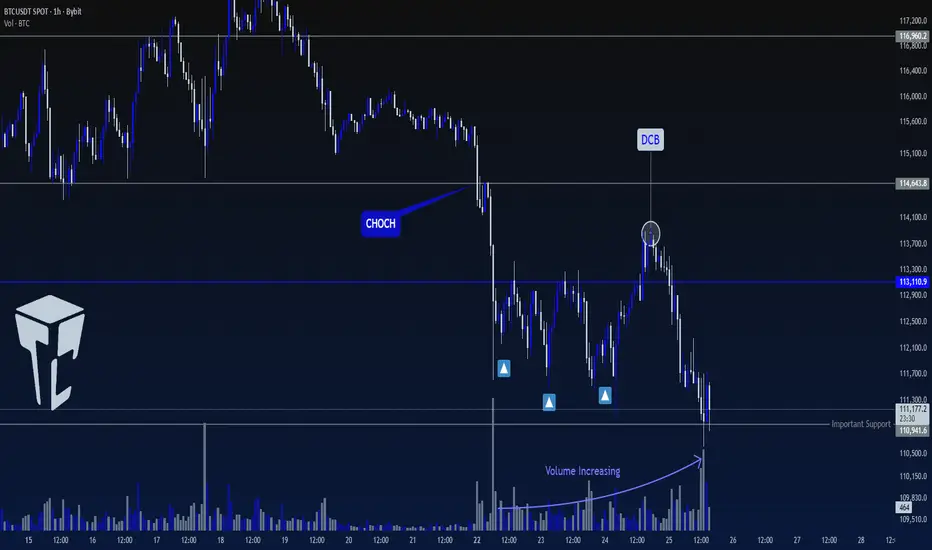
⏳ 1-Hour Timeframe
Bitcoin in the 1-hour timeframe started a downward move and, with consolidation below the 114643 area, turned bearish in lower cycles.
⭐ After finishing the first bearish leg, the price formed a top around the 113110 area and made a deep correction up to above this area, which can be called a DBC, because after that a new downward move started.
✔️ At the moment the price is on the 110941 support, and during this downward move that happened after the break of 114643, the volume has completely increased and the volume of bearish candles has been much higher than bullish candles.
🔑 Breaking the 110941 area can start the next bearish leg. In this case the next move can be much longer and the price can move down with more bearish momentum.
✨ On the other hand, if this area holds as support, we can get the first sign of a trend change, but for now I don’t think the market is giving us any specific position because there is not a proper structure for a long and at the same time there isn’t enough bearish momentum for a short position either.
❌ Disclaimer ❌
Trading futures is highly risky and dangerous. If you're not an expert, these triggers may not be suitable for you. You should first learn risk and capital management. You can also use the educational content from this channel.
Finally, these triggers reflect my personal opinions on price action, and the market may move completely against this analysis. So, do your own research before opening any position.
TradeCityPro | Bitcoin Daily Analysis #179👋 Welcome to TradeCity Pro!
Let’s move on to Bitcoin analysis. After a few days, it’s time to resume our updates.
⌛️ 4-Hour Timeframe
After breaking the 116,960 zone, Bitcoin failed to hold above it and the upward move turned out to be a fake breakout.
⚡️ Following that, a corrective move began. After consolidating below 114,819, the price continued its correction down to 111,524.
✔️ So far, the reaction to this level has been positive, with several green candles forming off this support.
🔑 However, the key point is that volume hasn’t increased, which is not a good sign for buyers.
🔍 If 111,524 breaks, the downtrend could extend toward the main support floor below.
💥 On the other hand, if price manages to create higher highs and higher lows above 111,524 and volume starts to pick up, a confirmed close above 114,819 could offer a long entry setup.
📈 A breakout of 116,960 will remain the primary long trigger. A clean break above that level will confirm the start of a new bullish leg.
❌ Disclaimer ❌
Trading futures is highly risky and dangerous. If you're not an expert, these triggers may not be suitable for you. You should first learn risk and capital management. You can also use the educational content from this channel.
Finally, these triggers reflect my personal opinions on price action, and the market may move completely against this analysis. So, do your own research before opening any position.

TradeCityPro | Bitcoin Daily Analysis #178👋 Welcome to TradeCity Pro!
Let’s move on to Bitcoin analysis. Yesterday the interest rate decision was released and Powell gave a speech. Let’s see how this affected the market.
⌛️ 4-Hour Timeframe
After breaking the 113,222 zone on the 4-hour chart, Bitcoin started a new upward trend and rallied up to 116,960.
✔️ Yesterday’s interest rate announcement was dovish (a cut) and supportive for Bitcoin, helping it break above the 116,960 high.
📊 Currently, the price has pulled back to this zone and is preparing to start its next main move. If that plays out, the next targets will be around 121,881 and 124,494.
📈 The market has built strong bullish momentum, and the trend can continue. This means we can look for long setups on lower timeframes as soon as triggers activate.
⚡️ As long as price holds above 113,222, I continue to view Bitcoin as being in an uptrend. Therefore, while the price remains above this zone, I won’t be opening any short positions.
❌ Disclaimer ❌
Trading futures is highly risky and dangerous. If you're not an expert, these triggers may not be suitable for you. You should first learn risk and capital management. You can also use the educational content from this channel.
Finally, these triggers reflect my personal opinions on price action, and the market may move completely against this analysis. So, do your own research before opening any position.

TradersCity Pro | LINK Eyes Fresh Rally From Critical Support👋 Welcome to TradeCity Pro!
In this analysis, I’m going to review LINK, one of the RWA coins with a market cap of $16.41 billion, currently ranked 12th.
📅 Daily Timeframe
On the daily chart, after getting support around 11.55, LINK started an upward move and in its first wave rallied up to 26.73.
✔️ After reaching this zone, volume began to decline and a short correction formed down to the 0.236 Fibonacci level.
⭐ This area is also an important support zone that overlaps with a PRZ (Potential Reversal Zone) at the Fibonacci level, meaning the price could start its next bullish wave if it holds this floor.
🔍 If a deeper correction occurs, price could extend down to the 0.382 or 0.5 Fibonacci levels. Naturally, the deeper the correction, the weaker buyers’ strength becomes.
🎲 For long positions, if the price holds these key zones or breaks above 26.73, we can look for entries. The main confirmation of a bullish continuation will be a clean breakout of 26.73.
📝 Final Thoughts
Stay calm, trade wisely, and let's capture the market's best opportunities!
This analysis reflects our opinions and is not financial advice.
Share your thoughts in the comments, and don’t forget to share this analysis with your friends! ❤️

TradeCityPro | Bitcoin Daily Analysis #177👋 Welcome to TradeCity Pro!
Let's dive into Bitcoin analysis, today’s analysis will be on the 1-hour timeframe since Bitcoin is in a corrective phase, and we’ll look at what triggers we can have for trading today.
⏳ 1-Hour Timeframe
After reaching the 116,619 level, the market entered a ranging phase and spent Saturday and Sunday consolidating below this level.
📊 Earlier today, before the London session, Bitcoin was rejected from 116,619, starting a bearish move with strong momentum and high volume, pushing price down to the 0.382 Fibonacci level for a correction.
⭐ If price finds support here, we can say the uptrend is still strong since it bounced from the first available support zone and started moving upward. In this case, a breakout above 116,619 would be a good long position entry.
🔍 But if the correction continues, the next support levels to watch are 0.5, 0.618, and 0.786 Fibonacci retracement levels.
✔️ The area between the 0.5 and 0.618 Fibonacci retracements forms a critical PRZ, and if price moves lower, this is one of the areas with a high probability of seeing a reaction.
❌ Disclaimer ❌
Trading futures is highly risky and dangerous. If you're not an expert, these triggers may not be suitable for you. You should first learn risk and capital management. You can also use the educational content from this channel.
Finally, these triggers reflect my personal opinions on price action, and the market may move completely against this analysis. So, do your own research before opening any position.

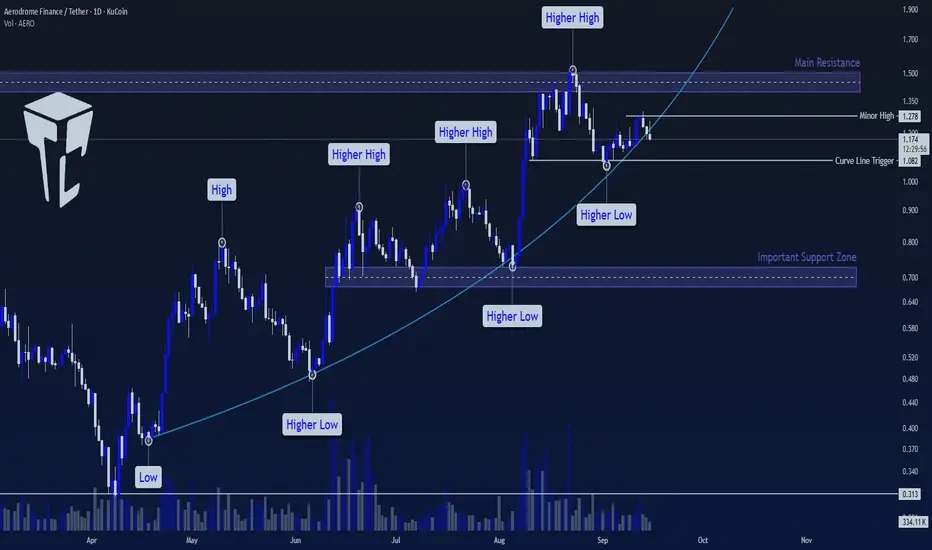
TradeCity Pro | AERO Testing Key Support on Curved Uptrend👋 Welcome to TradeCity Pro!
In this analysis, I want to review the AERO coin for you. It is one of the largest crypto DEX platforms that mainly operates in China Base and currently ranks 77th on CoinMarketCap with a market cap of $1.05 billion.
📅 Daily Timeframe
In the daily timeframe, we see an uptrend that has been moving sharply upward along a curved trendline.
⚡️ The main resistance for AERO is the 1.5 zone, which I have marked on the chart.
✔️ Price has touched this area once and has now returned to its trendline, forming a minor top at 1.278. If it gets rejected from this level and triggers 1.082, this level will turn into a major top.
🔍 Currently, the 1.082 level is a very good trigger for a short position. Breaking this level confirms the trendline break and could start a large corrective wave toward the next support zone.
✨ However, if the price forms a range box between 1.082 and 1.278, we can open an early long position after the breakout of 1.278. The main trigger for a long position or even a spot buy will be the breakout of the 1.5 zone.
📊 A positive sign for the uptrend is that volume has increased well during bullish waves and decreased during corrections. This indicates strong buyer momentum and is a bullish signal for the trend.
📝 Final Thoughts
Stay calm, trade wisely, and let's capture the market's best opportunities!
This analysis reflects our opinions and is not financial advice.
Share your thoughts in the comments, and don’t forget to share this analysis with your friends! ❤️
TradeCityPro | Bitcoin Daily Analysis #176👋 Welcome to TradeCity Pro!
Let’s go for a different kind of Bitcoin analysis today. I’ve used a new color theme on the chart—let me know in the comments whether you like this theme or prefer the previous one.
⌛️ 4-Hour Timeframe
In the 4-hour timeframe, Bitcoin had formed a descending channel, moving lower with a bearish structure of lower highs and lower lows toward the 107,000 support zone.
✔️ After reacting to this support, price climbed toward the channel’s top. Following one false breakout, it managed to break the channel on the next attempt and moved toward the channel trigger at 113,222.
💥 This move came with rising volume, which boosted bullish momentum and increased the likelihood of breaking 113,222.
✨ With the breakout of 113,222, Bitcoin’s main upward wave began, and price is now heading toward the next resistance at 116,960, which it is already approaching.
🧩 Over the last few candles, volume has dropped significantly, mainly because it’s the weekend. If volume starts to pick up with the new week, the probability of breaking 116,960 will increase.
🔑 A breakout above 116,960 could serve as the next long trigger, while Bitcoin’s key major resistance remains at 121,188.
❌ Disclaimer ❌
Trading futures is highly risky and dangerous. If you're not an expert, these triggers may not be suitable for you. You should first learn risk and capital management. You can also use the educational content from this channel.
Finally, these triggers reflect my personal opinions on price action, and the market may move completely against this analysis. So, do your own research before opening any position.

TradeCityPro | Bitcoin Daily Analysis #175👋 Welcome to TradeCity Pro!
Let’s move on to Bitcoin analysis. I haven’t posted an update for the past two days, but starting today, let’s get back to the market and see what’s ahead.
⌛️ 4-Hour Timeframe
The U.S. CPI and PPI data, two key inflation indicators, were released and came in favorably for the market. As a result, Bitcoin has moved toward 117,048.
💥 At the moment, most of the positions we’ve opened are in profit. Because of this, taking some profit could be a smart option, since Bitcoin might enter a corrective phase once it reaches the 117,048 level.
📈 For new entries, a clean breakout above 117,048 would be a valid trigger. However, the chance of breaking this zone on the first attempt is low, and there’s a strong possibility that price will wait for Powell’s upcoming speech before making its next decisive move.
📊 We can also use RSI’s move into the overbought zone as a momentum confirmation. If that happens, it could set off a powerful bullish leg to the upside.
❌ Disclaimer ❌
Trading futures is highly risky and dangerous. If you're not an expert, these triggers may not be suitable for you. You should first learn risk and capital management. You can also use the educational content from this channel.
Finally, these triggers reflect my personal opinions on price action, and the market may move completely against this analysis. So, do your own research before opening any position.

TradeCityPro | Bitcoin Daily Analysis #174👋 Welcome to TradeCity Pro!
Let’s dive into Bitcoin analysis. Today the U.S. inflation data was released, so let’s see how it impacted the market.
⌛️ 4-Hour Timeframe
Earlier today, the PPI index came in favorably for the market, and Bitcoin responded with an upward move following the news.
🔔 Yesterday, however, we saw some unusual global events. Israel carried out a military strike in Qatar, and at the same time, Nepal’s government collapsed following a popular revolution.
✨ These developments were negative for risk assets like Bitcoin, and as a result, the price was rejected from its resistance zone.
✔️ That said, news like this usually impacts markets only temporarily. Today, Bitcoin once again found support at the trendline and pushed higher with strong volume back into the key zone.
📊 Volume has risen significantly, and with today’s bullish PPI release, the current candle is closing above the resistance area.
💥 At the same time, the RSI is breaking through the 64.92 level, which greatly increases the likelihood of Bitcoin starting its next bullish leg. So if you’re already holding a long position, it’s worth keeping it open—there are no clear signs of weakness in the trend yet, and the market still has room to move upward.
🧩 If you don’t have a position open, you can look for entries on lower timeframes once resistance breaks. However, keep in mind that I personally already opened my positions with earlier triggers, and any new triggers appearing today come with higher risk.
❌ Disclaimer ❌
Trading futures is highly risky and dangerous. If you're not an expert, these triggers may not be suitable for you. You should first learn risk and capital management. You can also use the educational content from this channel.
Finally, these triggers reflect my personal opinions on price action, and the market may move completely against this analysis. So, do your own research before opening any position.

TradeCityPro | Bitcoin Daily Analysis #173👋 Welcome to TradeCity Pro!
Let’s dive into Bitcoin analysis. Today and tomorrow are very important days, and it’s crucial to have the right outlook on Bitcoin. We’ve got some interesting triggers for opening positions that could potentially hit our trading targets for the next few weeks.
⌛️ 4-Hour Timeframe
Bitcoin has been moving upward along a trendline and is now sitting inside a resistance zone. How price reacts to this level is key—it could determine Bitcoin’s next major move.
🔍 If the resistance breaks, an upward rally could begin, as volume has been increasing strongly and the RSI is sitting just below 64.92. That’s an important resistance level, and breaking it could bring fresh momentum into the market.
💥 Rising momentum and strong buying volume are always good signs of a powerful uptrend, and as long as these two factors align with price action, the trend should continue.
⚡️ So, if you already have open positions, you might want to take profits if the price rejects from support and RSI plus volume show divergence with the price move.
✨ If you’re looking to open a new position, the breakout of 113,237 is currently the best trigger for a long entry, provided no divergence appears.
🔽 On the other hand, if price rejects this zone and breaks below the trendline, a short setup could form. However, keep in mind that in the current market, where higher cycles remain bullish, all short positions are risky. Personally, I don’t take shorts in this environment and prefer to stay aligned with the broader uptrend.
📰 Finally, tomorrow we have the U.S. inflation report—one of the most important releases of the month, and it will have a big impact on the market. Be extra careful with your positions, because sharp volatility is highly likely once the data comes out.
❌ Disclaimer ❌
Trading futures is highly risky and dangerous. If you're not an expert, these triggers may not be suitable for you. You should first learn risk and capital management. You can also use the educational content from this channel.
Finally, these triggers reflect my personal opinions on price action, and the market may move completely against this analysis. So, do your own research before opening any position.

TradeCityPro | Bitcoin Daily Analysis #172👋 Welcome to TradersCity Pro!
Let’s move on to Bitcoin analysis. Yesterday, one of the triggers we had for a long position was activated. Let’s see which direction the market moves today and what other triggers we have.
⌛️ 1-hour timeframe
The trigger we had yesterday at the 111654 zone was activated, and good buying volume entered the market. The price is now moving toward the 113233 level.
✔️ If you opened a position with yesterday’s trigger, you can secure your profits when the price reaches 113233. A breakout of 113233 itself can also be the next trigger for another long position.
📊 If the volume does not decrease and continues to rise, the likelihood of this upward move continuing is much higher, and a new leg in higher cycles could form.
✨ However, if this upward move turns out to be fake and the price stabilizes below 111654, the probability of short triggers being activated and the start of a bearish wave increases significantly.
🎲 In that case, with a break of the 110473 zone, we can open a short position. These setups are among the trades that are better to open with a small stop-loss and low risk, so they can reach the target more quickly, and if stopped out, we won’t face a big loss.
❌ Disclaimer ❌
Trading futures is highly risky and dangerous. If you're not an expert, these triggers may not be suitable for you. You should first learn risk and capital management. You can also use the educational content from this channel.
Finally, these triggers reflect my personal opinions on price action, and the market may move completely against this analysis. So, do your own research before opening any position.

TradeCityPro | Bitcoin Daily Analysis #171👋 Welcome to TradersCity Pro!
Let’s move on to Bitcoin analysis. Yesterday, Bitcoin continued ranging. Let’s see what triggers the market gives us today.
⌛️ 1-hour timeframe
Yesterday, after Bitcoin’s volume dropped to the lowest possible level, the market made a downward move and faked around the 110473 zone, and now it’s back inside the box again.
📊 The top of the box is at the 111654 zone, and if it breaks, the price can move toward the 113233 zone.
✔️ I still believe volume is very important, and as long as no significant volume comes in, the market won’t move. Even if it does, like yesterday’s drop, the chance of it being fake is very low.
📉 For a short position, we can enter with the 110473 trigger, but in my opinion, considering the higher cycles, it’s still not logical to open shorts. However, if buying volume enters, we can enter a long position with the long triggers we have.
🔔 In market conditions like this, when the volume is so low, one thing that really helps avoid unnecessary stop-losses is to avoid opening positions for a while and miss the first leg of the next price move.
⚡️ In this case, it’s true that we miss one leg that could have given us a risk-to-reward opportunity, but on the other hand, it prevents us from getting stopped out inside the ranging box. It also keeps our mind free from open trades so we can open new positions in the next legs, which are more reliable and have a higher win rate.
❌ Disclaimer ❌
Trading futures is highly risky and dangerous. If you're not an expert, these triggers may not be suitable for you. You should first learn risk and capital management. You can also use the educational content from this channel.
Finally, these triggers reflect my personal opinions on price action, and the market may move completely against this analysis. So, do your own research before opening any position.

TradeCityPro | Bitcoin Daily Analysis #170👋 Welcome to TradeCity Pro!
Let’s dive into Bitcoin analysis. Yesterday, the U.S. unemployment rate was released. Let’s see how it impacted the market and what the conditions look like for the future.
⏳ 1-Hour Timeframe
Yesterday, after the U.S. unemployment rate report came out positive for the market, the price made an upward move and reached the 113233 resistance.
⚡️ But after hitting this level, it faced a heavy rejection and with a red candle, the price dropped back down to the 110561 support and is still ranging around this area.
✔️ After the daily candle closed, market volume dropped significantly and remains very low, which is why candle volatility has also decreased a lot.
📊 This low volume is natural because it comes after a sharp, high-volume move in the market, and also because it is the weekend—volume typically declines on Saturdays and Sundays.
⭐ It’s likely that today and tomorrow the volume will stay this low and price could continue ranging until then, with the next real move happening once the new weekly candle opens.
💥 Step by step, we are also approaching Jerome Powell’s speech and the U.S. interest rate decision on September 17, which will make the market even more indecisive as we get closer to that date.
❌ Disclaimer ❌
Trading futures is highly risky and dangerous. If you're not an expert, these triggers may not be suitable for you. You should first learn risk and capital management. You can also use the educational content from this channel.
Finally, these triggers reflect my personal opinions on price action, and the market may move completely against this analysis. So, do your own research before opening any position.

TradeCityPro | Bitcoin Daily Analysis #169👋 Welcome to TradeCity Pro!
Let’s move on to analyzing Bitcoin. It has had a very important reaction to the resistance zone we had, and we need to see which direction its next move will be. So stay with me as we review it.
⏳ 4-Hour Timeframe
After breaking its descending trendline, Bitcoin made a short upward move and reached the resistance zone.
🔍 However, once it touched this zone, the price was rejected and corrected down to 109577. This correction can extend further as a pullback to the trendline or even to the 107467 zone.
💥 If this deeper correction occurs and selling volume increases at the same time, the probability of breaking 107467 rises. This would not be favorable for Bitcoin’s bullish trend, and it would be better for this zone not to be lost.
📊 In case 107467 breaks with higher volume, we can open a short position. This would be considered a very risky trade, and I would personally put very little risk into it.
📈 On the other hand, if an upward move resumes and the resistance zone breaks, the price could begin a new bullish move toward higher resistances such as 117048, 119096, or even 122545.
📰 Tomorrow, the U.S. unemployment rate report will be released, which can significantly affect the market. The probability of a new wave beginning after this news is high, so make sure you’re on alert to have an open position if the market decides to move.

TradeCityPro | Bitcoin Daily Analysis #168👋 Welcome to TradeCity Pro!
Let’s move on to the Bitcoin analysis. Yesterday Bitcoin made an upward move and has now reached an important zone. Let’s see how the market wants to react to this resistance.
⏳ 1-Hour Timeframe
Yesterday Bitcoin briefly faked a breakout of its trendline but then broke it again and also activated its trigger.
🔍 Currently, the price has reached the resistance zone and is trying to penetrate it. The volume has increased throughout this upward move, which shows the strength of the buyers.
📊 If you opened a position with the triggers we had, now is not a bad time to take some profit and secure your position. But definitely leave a portion of it open so that in case the zone breaks, you won’t be left without a position.
🔔 Even with the breakout of this zone, a new long position can be opened. This zone has a lot of sell orders, and if the price manages to push through them, it can begin a sharp upward move.
💥 The RSI oscillator is stabilizing above the 64.09 level, which is a very good sign for buyers and increases the probability of breaking the zone.
✔️ However, if this RSI level fakes out, the chance of rejection from the zone rises, and in that case, the price correction can continue down to the 110721 and 109577 levels.
❌ Disclaimer ❌
Trading futures is highly risky and dangerous. If you're not an expert, these triggers may not be suitable for you. You should first learn risk and capital management. You can also use the educational content from this channel.
Finally, these triggers reflect my personal opinions on price action, and the market may move completely against this analysis. So, do your own research before opening any position.

TradeCityPro | Bitcoin Daily Analysis #167👋 Welcome to TradeCity Pro!
Let’s go for Bitcoin analysis, Bitcoin has finally broken out of the box it was in. Let’s see what positions it can give us today.
⏳ 1-Hour Timeframe
Yesterday Bitcoin broke the 109577 level and the trendline that it had in the higher timeframes, and now it has reached the resistance of 110721.
⭐ We have not yet received confirmation of the trendline breakout because no volume has entered the market, and the price has not made higher highs and higher lows, so it can still be said that the trendline is not yet broken.
📊 If volume starts to increase and the 110721 ceiling is broken, we get confirmation of the breakout of this trendline. If RSI also breaks the 64.09 level, we can take momentum confirmation from it.
💥 With the breakout of 110721, a long position can be opened on Bitcoin. If Bitcoin dominance continues its upward movement, this position can be very attractive, but if dominance starts to drop, altcoins will be a much better option.
🔽 For a short position, a fakeout of this upward movement and price stabilizing below the 109577 level would be a good trigger for a fakeout, and in the lower timeframes, we can open a short position with price stabilizing below 109577.
❌ Disclaimer ❌
Trading futures is highly risky and dangerous. If you're not an expert, these triggers may not be suitable for you. You should first learn risk and capital management. You can also use the educational content from this channel.
Finally, these triggers reflect my personal opinions on price action, and the market may move completely against this analysis. So, do your own research before opening any position.

TradeCityPro | Bitcoin Daily Analysis #166👋 Welcome to TradeCity Pro!
Today a new weekly candle has opened, so let’s analyze Bitcoin and review the trading conditions for the new week.
⏳ 1-Hour Timeframe
Bitcoin has formed a ranging box in the 1-hour timeframe, and with the start of the new week and month, the candle volumes have increased significantly.
✔️ The trendline we drew yesterday on the 4-hour timeframe can also have an impact here in the 1-hour chart, and if the price reaches it, a reaction is very likely.
✨ If the price reacts to the trendline and gets rejected, the downward move can continue. The trigger we currently have for a short position is the break of 107467.
⚡️ But if the trendline is broken, we can open a long position with the activation of the trendline trigger, which is the break of 109577. In this case, Bitcoin could start a bullish move that may continue towards resistance areas.
🧩 Yesterday was the last day of the month, and today is the first day of the new month. Many companies and funds are forced to open or close their positions due to accounting strategies. This has caused some unusual volatility.
🔍 Keep this in mind: I recommend not opening any major positions today. If you do, manage them with proper risk control until the market returns to normal conditions.
❌ Disclaimer ❌
Trading futures is highly risky and dangerous. If you're not an expert, these triggers may not be suitable for you. You should first learn risk and capital management. You can also use the educational content from this channel.
Finally, these triggers reflect my personal opinions on price action, and the market may move completely against this analysis. So, do your own research before opening any position.

TradeCityPro | Bitcoin Daily Analysis #165👋 Welcome to TradeCity Pro!
Let’s dive into Bitcoin analysis. Over the past few days, I unfortunately couldn’t provide updates, but starting today I’ll try to bring you daily analyses again.
⌛️ 4-Hour Timeframe
Bitcoin is still continuing its downward trend and has managed to consolidate below the supply zone we had marked.
📊 At the moment, a descending trendline has formed, and the price has reacted to it multiple times.
⭐ I currently don’t have any open positions on Bitcoin and won’t be opening new ones yet. For new entries, I’m waiting until my triggers are activated.
📈 For a long position, with a break of the trendline and activation of the 110183 trigger we can enter. But the main position will be after consolidation above the 113000 zone.
🔽 For a short position, with a break of 107853 the price could make another downward leg. The next support would be 105370.
✔️ There’s a strong chance Bitcoin will continue this corrective move, possibly until the next interest rate announcement. But we still need to watch the market daily, so that once triggers activate, we can open positions accordingly.
❌ Disclaimer ❌
Trading futures is highly risky and dangerous. If you're not an expert, these triggers may not be suitable for you. You should first learn risk and capital management. You can also use the educational content from this channel.
Finally, these triggers reflect my personal opinions on price action, and the market may move completely against this analysis. So, do your own research before opening any position.

TradeCityPro | Bitcoin Daily Analysis #164👋 Welcome to TradeCity Pro!
Let’s analyze Bitcoin today. I want to take a different approach by analyzing Bitcoin with volume to get a fresh perspective on it.
⏳ 1-Hour Timeframe
Bitcoin is still continuing its bearish move and has reached an important support level at 109509.
📊 If we use the FRVP indicator, we have identified 3 key resistance zones that I have plotted for you. In case Bitcoin is supported at the 109509 zone and starts a bullish move, the price could react to these resistance levels.
✨ After the price was rejected from the 110000 range, the volume decreased, indicating a weakness in the bearish trend. If the volume doesn’t increase, the bearish movement won’t continue.
⚡️ However, if the selling volume increases and 109509 is broken, the price could move down to the next support at 107853.
💥 The RSI oscillator is still showing a bearish momentum and is range-bound between 30 and 50. A break of 30 and entering the Oversell zone will initiate Bitcoin’s main bearish movement, and the price could move towards lower levels.
❌ Disclaimer ❌
Trading futures is highly risky and dangerous. If you're not an expert, these triggers may not be suitable for you. You should first learn risk and capital management. You can also use the educational content from this channel.
Finally, these triggers reflect my personal opinions on price action, and the market may move completely against this analysis. So, do your own research before opening any position.

TradeCityPro | Bitcoin Daily Analysis #163👋 Welcome to TradeCity Pro!
Let’s analyze Bitcoin. Yesterday, Bitcoin made a bearish move. Let’s explore the reason behind it and what Bitcoin’s next move might be.
⏳ 4-Hour Timeframe
Yesterday, during the New York session, a large number of Bitcoin were sold by one of the whales, which caused Bitcoin to make a large red 4-hour candle with high volume.
✨ This candle caused the price to make a long shadow below the range, and afterward, the price started to gradually decline. With the break of 112233, the price is now heading towards the 110183 support.
🔔 The 110183 zone is a very important support, and the price’s reaction to this zone will significantly impact the future market trend.
🧩 Bitcoin’s dominance trend is still bearish, and if this continues, altcoins could provide excellent long positions as long as Bitcoin doesn’t experience a sharp decline.
✔️ However, Bitcoin itself is still experiencing a lot of selling pressure, and the volume is still increasing. If this increase in volume continues, the price could reach at least the 110183 support.
💥 The RSI oscillator has reached near the 30 zone again. A break of this zone and entering Oversell would increase the likelihood of further bearish movement.
⚡️ For now, I’m not opening any positions and I’m waiting for the right structure to form before entering a trade.
❌ Disclaimer ❌
Trading futures is highly risky and dangerous. If you're not an expert, these triggers may not be suitable for you. You should first learn risk and capital management. You can also use the educational content from this channel.
Finally, these triggers reflect my personal opinions on price action, and the market may move completely against this analysis. So, do your own research before opening any position.c
