BTC/USD H4 – Pausing to Consolidate the UptrendHello everyone,
Looking at the BTC/USD H4 chart, what stands out to me is not the few recent red candles, but the way the market is slowing down after a very decisive rally. After moving from the 88,000 area up toward nearly 95,000, Bitcoin has started to cool off and pull back into the 92,000–93,000 zone. To me, this is a fairly natural price reaction following a strong advance, as capital needs time to rebalance before the market commits to its next directional move.
From a technical standpoint, the medium-term bullish bias has not been compromised. Price is currently pulling back into the confluence zone of EMA 34 and EMA 89 — an area that often acts as a “support base” within a healthy trend. The fact that BTC continues to hold above the slower EMA suggests that bullish momentum has not been broken, and that the current retracement is more consistent with short-term profit-taking than with genuine distribution.
A constructive detail lies in the price behavior during the recent pullback. Selling volume has not expanded, while the corrective candles show narrower ranges compared to the prior impulsive advance. This indicates that supply pressure is fading, while buyers have not stepped aside. Historically, this type of price action often leads to a brief consolidation phase before the market resumes its primary direction.
Stepping back from the chart to look at the broader context, the current macro backdrop remains supportive for Bitcoin. Recent US economic data point to easing inflation while growth remains moderate. This makes a shift toward a more aggressive monetary stance less likely, helping to preserve a relatively stable “risk-on” environment for risk assets.
In addition, early-year market sentiment has improved noticeably after the holiday period.
Capital is flowing back into equities and crypto, and Bitcoin is often among the first beneficiaries when risk appetite improves. Reports from international financial media also suggest that institutional money has not exited the market, but is instead repositioning after the strong year-end rally — a narrative that aligns well with what the H4 chart is currently showing.
Buy

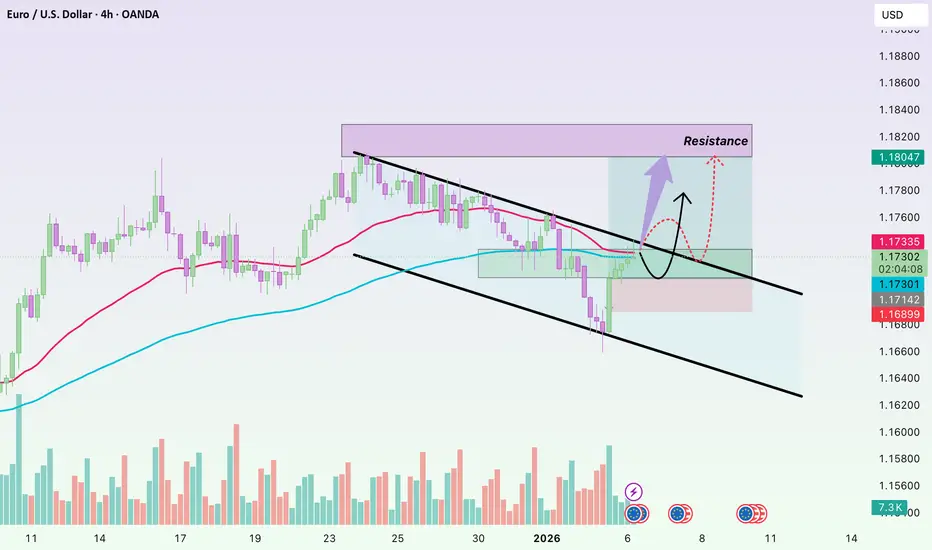
EURUSD Breakout and Potential RetraceHey Traders, in today's trading session we are monitoring EURUSD for a buying opportunity around 1.16600 zone, EURUSD was trading in a downtrend and successfully managed to break it out. Currently is in a correction phase in which it is approaching the retrace area at 1.16600 support and resistance area.
Trade safe, Joe.

Gold H1 Analysis: Resistance Reaction Signals a Healthy PullbackHello, I’m Camila.
Looking at the H1 chart, I can see that gold has reached a well-defined resistance zone and is now reacting rather than breaking through impulsively. Instead of aggressive continuation, price action is showing hesitation, with shorter candles and overlapping ranges. This behavior tells me that bullish momentum is pausing, not reversing, as the market reassesses value after the recent advance.
From a structural standpoint, the broader bullish framework remains intact. The prior impulse leg is still respected, and there is no evidence of a confirmed bearish break of structure. What we are witnessing now is a controlled pullback, typical in trend-driven markets, where price steps back to test whether previous demand is still active. In healthy uptrends, this kind of retracement is often a necessary process to build fuel for the next leg higher.
The zone I am monitoring most closely sits around 4,450, where price is likely to seek liquidity and test buyer commitment. If gold rotates lower into this area and selling pressure continues to fade, I would expect buying interest to re-emerge. Such a reaction would reinforce the bullish narrative and open the door for price to rotate back toward the upper resistance band around 4,520 – 4,550. Only a clean loss of this support area would force me to reassess the current bullish bias.
On the fundamental side, the backdrop continues to favor gold. Persistent geopolitical uncertainty and unresolved macroeconomic risks are keeping safe-haven demand alive. At the same time, expectations that the Federal Reserve will avoid a sharply hawkish shift are limiting upside pressure on the U.S. dollar and Treasury yields. With several high-impact U.S. data releases ahead, I expect volatility to remain uneven, reinforcing the likelihood of a pullback-then-continuation environment rather than a one-directional move.
In summary, I view the current price action as a pause within an ongoing uptrend. As long as gold holds above the key support area and continues to show diminishing bearish momentum, the path of least resistance remains higher after this corrective phase.
Wishing you calm execution and disciplined trading.

Gold Testing a Key EMA, the Pullback Remains TechnicalOn the OANDA:XAUUSD H1 chart, gold is entering a short-term corrective phase following the previous strong rally. The key point to emphasize is that the bullish structure remains intact, and current price action is mainly about how the market reacts around the major EMA levels.
From a technical perspective, price is hovering around the EMA 89, corresponding to the 4,435–4,440 zone. Meanwhile, the EMA 34 sits higher near 4,455 and has temporarily turned into a short-term dynamic resistance. Price failing to hold the faster EMA and pulling back toward the slower one is a familiar scenario within a healthy uptrend, where larger players closely observe price reactions to assess whether the trend continues to be defended.
The constructive sign so far is that gold has not printed a clear H1 close below the EMA 89 . The corrective candles remain relatively small and show lower wicks, suggesting that selling pressure is still limited. Although volume has ticked up slightly during some of the pullback legs, there is no evidence of aggressive distribution or heavy unloading.
Overall, this decline is better interpreted as a pullback toward a balance zone after price had extended significantly away from the EMAs during the prior advance. Given gold’s volatility characteristics, such corrections often serve to relieve pressure and rebuild a base before the market decides on its next directional move.

XAU/USD – The bullish trend continues to strengthenAs we move into the early sessions of 2026, gold continues to reinforce its role as a safe-haven asse t amid escalating geopolitical tensions following U.S. military actions in Venezuela . The sharp 2.7% surge in the previous session signals a clear return of defensive capital flows, especially as global markets face rising uncertainty. At the same time, expectations of further Fed rate cuts this year are creating a favorable environment for non-yielding assets such as gold.
From a technical perspective, the H4 chart confirms that XAU/USD’s bullish structure remains firmly intact . After a brief corrective phase, price quickly rebounded from the 4,440 zone, validating it as a key instant support where buying pressure consistently emerges. The recovery legs are decisive and well-supported, indicating that buyers remain firmly in control of the broader trend .
As long as price continues to hold above this support area, the high-probability scenario points toward a renewed advance toward 4,520, followed by a potential extension to the 4,600 resistance zone. With safe-haven demand still active, any near-term pullbacks are likely to remain technical in nature, serving as a base for further upside continuation in XAU/USD.

XAUUSD – A Healthy Reset Before Trend ContinuationHello, I’m Camila.
Observing the XAUUSD H4 chart, I believe the market is unfolding exactly as a technical correction within a well-defined uptrend. After price was rejected at the upper resistance of the ascending channel, gold deliberately pulled back to retest the channel’s dynamic support. This move should not be interpreted as a trend reversal, but rather as a natural and rational response following a steep and extended rally.
What stands out to me is how price behaves upon reaching the support zone. Selling pressure has not expanded further; instead, downside momentum has clearly slowed, accompanied by signs of supply absorption at the highlighted support area. This is classic price behavior in a healthy uptrend: the market retraces to lower levels to assess whether buyers remain committed to defending the underlying structure.
From a structural perspective, the ascending channel remains intact. Price has not broken below the lower boundary of the channel, and the entire pullback still falls well within acceptable corrective limits. This indicates that the medium-term bullish trend remains unbroken. I see no clear evidence of distribution at this stage; rather, the market appears to be undergoing a temporary rebalancing of supply and demand before the primary trend resumes.
My preferred scenario is for gold to stabilize and consolidate around the dynamic support zone, marked as a BUY area on the chart. If buying interest continues to emerge and price maintains its higher-low structure, the market is likely to form a technical rebound. From there, gold could move back toward a retest of the upper resistance zone previously highlighted. A decisive breakout above that area would confirm trend continuation and open the door to higher targets in the next phase.
From a macro perspective, the broader backdrop continues to support this bullish outlook. Ongoing global economic and geopolitical uncertainties sustain demand for safe-haven assets, while expectations of a more accommodative Federal Reserve stance help cap U.S. dollar strength and Treasury yields. In this environment, pullbacks in gold are better viewed as strategic opportunities, rather than early signals of a trend reversal.
In summary, based on what the chart is showing, I consider the current decline to be a necessary step back before the next advance. Once the market completes its support test and buying strength is reaffirmed, gold is likely to revisit resistance and continue along the upward path already established.
Wishing you disciplined trading, a calm mindset, and decisions aligned with market structure.

Technical Rebound at Key EMA, Medium-Term Uptrend Remains IntactHello everyone,
EUR/USD has just completed a fairly deep but well-controlled correction. The prior sell-off pulled price back toward the medium-term EMA zone around 1.1680–1.1700, and the subsequent rebound suggests selling pressure is no longer expanding, while buyers have started to step in to defend the broader structure.
Although price briefly printed a lower low in the short term, the medium-term picture has not been broken. At the moment, EUR/USD is fluctuating around the confluence of EMA 34 and EMA 89 near 1.1730–1.1740 — a key decision area. Holding above this zone would give the market room to continue consolidating and recovering; failure here could open the door for a retest of the prior lows.
From a macro perspective, the current backdrop does not place significant pressure on the euro. The Fed remains cautious and data-dependent, limiting the upside in US Treasury yields. Meanwhile, the ECB continues to maintain a moderately firm stance, helping EUR hold a stable price base. Upcoming data such as services PMI and US jobless claims may trigger short-term volatility, but in my view, they are unlikely to alter the medium-term trend unless a major surprise emerges.
Gold in NFP week — When the chart out-plays the traderNFP week (Non-Farm Payrolls) is known for wide ranges, frequent SL sweeps, and sharp reversals that make retail traders believe the trend has broken, while the market is actually just collecting liquidity before the real move.
1. Gold is “calm” early week, “crazy” late week
Mon – Tue: Price usually compresses and moves sideways to build positions and stack liquidity
Wed – Thu: Spikes, fake breakouts, and Stop Hunts happen more often
Friday (NFP release): Volatility explodes, spreads widen, and price can hit both directions within minutes
During NFP week, gold isn’t hard to analyze — it’s hard because it won’t let you be right too early.
2. NFP news doesn’t just create a trend, it creates noise before the trend
Before running the main direction, gold often:
Breaks a level quickly to trigger retail SL
Wicks back into the original zone (liquidity sweep)
Then launches the real move
That’s why traders get “stopped at the top or bottom” — not because they’re wrong, but because their SL is sitting at the most obvious liquidity spot.
3. Where does gold react the hardest during NFP week?
Typically at:
Recent highs and lows
Round numbers
Zones where structure looks too clean and everyone draws the same
These areas are liquidity magnets, not true breakout guarantees.
4. What should traders do this week?
Reduce position size, avoid all-in
Don’t place SL too tight near early-week levels
Wait for liquidity to be swept before entering
Avoid FOMO when spikes appear too soon
Prioritize setups that revalidate structure after the noise
5. The classic gold storyline every NFP week
Retail traders hunt perfect entries.
Institutions hunt perfect SL.
Gold hunts SL first, then delivers trend later.

GBP/JPY – Uptrend Weakens, Correction Risk RisesAfter a strong and decisive rally , GBP/JPY is clearly entering a cooling phase as the market begins to reassess risk. Cautious sentiment is returning , while a recovery in the Japanese yen is reducing the pair’s previous upside momentum.
On the macro side, the JPY is finding support from expectations that the Bank of Japan will continue its tightening path , whereas recent UK data have not been strong enough to provide fresh momentum for GBP. As global risk appetite softens, yen crosses typically come under early corrective pressure.
From a technical perspective, GBP/JPY has clearly reacted at the upper resistance zone and is showing signs of exhaustion after multiple failed breakout attempts. Price is now hovering around a balance area, while the short-term structure favors a pullback toward lower support. This suggests that buying pressure is gradually losing control, giving way to profit-taking activity.
In the preferred scenario , unless price can reclaim and hold above the current resistance, GBP/JPY is likely to extend its correction to seek a lower equilibrium level. This move can be seen as a necessary cooldown after a strong advance, before the market commits to its next directional move.

Latest Gold Price Update TodayGold closed the January 6 trading session up 45 USD at 4,494 USD. The bullish momentum continued into this morning, with prices briefly touching 4,500 USD, moving closer to the previous peak of 4,549 USD set on December 24, 2025.
Safe-haven demand remains strong following the U.S. military strike in Venezuela and the arrest of President Nicolás Maduro over the weekend, which has heightened geopolitical uncertainty and supported gold prices.
Investors are also closely awaiting today’s U.S. employment report for further clues on the Federal Reserve’s interest rate outlook. If the data aligns with expectations for a more accommodative policy stance, the current uptrend in gold could strengthen further.

BITCOIN Is Bullish! Long!
Please, check our technical outlook for BITCOIN.
Time Frame: 1h
Current Trend: Bullish
Sentiment: Oversold (based on 7-period RSI)
Forecast: Bullish
The price is testing a key support 91,856.04.
Current market trend & oversold RSI makes me think that buyers will push the price. I will anticipate a bullish movement at least to 93,654.01 level.
P.S
Overbought describes a period of time where there has been a significant and consistent upward move in price over a period of time without much pullback.
Like and subscribe and comment my ideas if you enjoy them!

AUD/USD – Corrective pressure emerges after inflation coolsIt can be observed that AUD/USD is starting to show signs of slowing down after a relatively smooth advance. While the medium-term trend has not been fully broken , the latest macroeconomic factors from Australia are making the market more cautious toward the AUD.
From a fundamental perspective, Australia’s November CPI fell more than expected (3.4% vs. a 3.6% forecast and down from 3.8% previously). This indicates that headline inflation pressures are easing rapidly, particularly due to lower electricity prices. For the market, this development reduces expectations that the RBA will maintain a hawkish stance, thereby adding short-term downside pressure on the AUD — despite core inflation remaining sticky.
On the chart, AUD/USD has moved close to the resistance zone around 0.6780 within its ascending channel and is starting to show signs of exhaustion. Price is pulling away from the upper boundary of the channel, while 0.6730 stands out as the nearest support level. The current structure leans more toward a technical correction rather than a renewed bullish breakout.
In the base scenario, if selling pressure persists , AUD/USD may pull back to retest 0.6730, or even extend lower toward the lower support area of the ascending channel. Only if core CPI unexpectedly shifts RBA policy expectations would the AUD have a chance to regain immediate upside momentum.
Overall, AUD/USD is entering a necessary “cool-off” phase . With inflation easing and technical resistance overhead, the current pullback is more likely a rebalancing move before the market commits to a clearer directional bias.

Gold’s Rally Is Losing Momentum — Is a Deeper Pullback Loading?OANDA:XAUUSD has staged a strong bullish recovery from the lower demand zone, developing a clear ascending channel on H1. The sequence of higher highs and higher lows confirms that buyers were firmly in control during the impulsive phase of the move.
However, momentum has started to fade as price reached a major supply and resistance zone around 4,490–4,520. Multiple rejections from this area signal that sell-side pressure is increasing, and the market is no longer trending impulsively but transitioning into a distribution and corrective phase.
Currently, price is trading back below the upper channel structure and hovering near the 4,450–4,455 region, which aligns closely with the rising EMA and prior intraday structure. This area acts as a short-term decision point: holding above it keeps the bullish structure technically valid, while failure would confirm a deeper correction.
- Bullish scenario: If price reclaims strength above 4,500 and breaks the upper channel with acceptance, bullish continuation toward 4,540–4,560 becomes likely.
- Bearish scenario: A sustained breakdown below 4,450, followed by a pullback and rejection, would confirm a corrective move targeting 4,400, with extended downside toward the 4,330–4,350 demand zone.
At this stage, the market is no longer offering easy trend trades. Patience is crucial, as the middle of the structure carries high risk, and the next high-probability opportunity will emerge only after a clear confirmation of direction.

GBPUSD is Nearing a Decent Support Area!Hey Traders, in today's trading session we are monitoring GBPUSD for a buying opportunity around 1.33600 zone, GBPUSD is trading in an uptrend and currently is in a correction phase in which it is approaching the trend at 1.33600 support and resistance area.
Trade safe, Joe.

GOLD TODAY Slowing Down to Move FurtherHello, I’m Camila.
Looking closely at the current H8 chart, I see gold entering a very typical phase after a strong rally. The previous sequence of bullish candles pushed price close to the upper resistance zone, but at this point the market has started to slow down and move sideways. This does not surprise me. When price advances too quickly relative to the underlying support, the market usually needs a pause to reassess the strength of buyers.
From a structural standpoint, the uptrend remains intact. Price is still trading above the key moving averages, and the series of higher lows has not been broken. This indicates that buying pressure has not left the market, but is simply decelerating. In gold, this phase often represents a period of compression before the next expansion.
From a fundamental perspective, the recent rally has not been random. Based on Forex Factory and major mainstream news sources, the market continues to react to ongoing geopolitical and global economic risks. Geopolitical tensions have not eased, while the Federal Reserve maintains a data dependent stance without signaling any new tightening. These factors continue to provide a supportive backdrop for gold, while also making it difficult for price to move higher in a straight line without short term corrections.
The price zone I am watching most closely at the moment lies between 4,360 and 4,330. In strong momentum driven uptrends like this, the market often repeats a familiar pattern: a sharp push higher that creates a breakout narrative, followed by a pullback to test the base and support, and only then does the market decide whether it has enough strength to continue higher. If gold corrects into this zone and shows a clear buying reaction, the bullish structure will remain clean and healthy.
On the upside, once the consolidation process is complete, I expect price to rotate back toward the upper resistance area around 4,500 to 4,550. A decisive breakout above this zone would open the door for a higher price range to be established in the next phase.
For me, gold today is not weakening. It is simply slowing down to prepare for its next move. I wish you successful trading and the patience to stay focused while the market is “catching its breath.”

Gold Spot / USD – H1 | Macro Resistance – Liquidity Sweep StyleGold prices remain supported within a broader bullish market structure after a strong impulsive rally from the demand zone. The current price action suggests a pause near a key supply area, indicating the market may be preparing for a liquidity-driven correction rather than immediate continuation.
The price is now trading just below a well-defined resistance zone around 4,480–4,500, which has previously acted as a distribution area. Multiple rejections from this zone highlight active seller interest, making it a critical level to watch for a potential rejection or failed breakout.
A pullback scenario is favored if price continues to hold below resistance. In this case, a corrective move toward the 4,420 support zone is likely first. Failure to hold this support could open the path for a deeper retracement into the gap-fill area around 4,340, aligning with the broader demand zone near 4,315, where stronger buying interest is expected to re-emerge.
Despite the potential for a sharp correction, the higher-timeframe bias remains bullish. Such a pullback would be considered a healthy reset, allowing the market to absorb liquidity and build a stronger base for the next leg higher.
A clean breakout and sustained acceptance above the 4,500 resistance zone would invalidate the corrective setup and signal continuation toward the previous highs.

Demand Broken — Is Gold Entering a Deeper Corrective Phase?Gold has transitioned from a bullish impulse into a clear structural shift on H1. After failing to sustain acceptance above the recent highs, price has rolled over and broken below a key demand zone, signaling that bullish control has weakened materially.
The latest downside move is impulsive in nature, not corrective. This confirms that the prior bullish structure has been disrupted, and the market is now operating in a bearish-to-corrective transition phase, with sellers regaining short-term control.
The former demand zone around the 4,430 area has now been cleanly broken and accepted below, turning it into a potential resistance on any retest. Price is also trading decisively below the EMA 50, which has started to flatten and roll over a classic sign of momentum shift rather than a shallow pullback.
Overhead, the supply zone near 4,465–4,480 remains intact and untested, reinforcing the bearish bias as long as price stays below that region.
Resistance (Supply):
4,450–4,470 (former demand → supply flip)
4,465–4,480 (major supply zone)
Support:
4,390 (next structural downside target)
Below 4,390 opens room for deeper continuation
EMA / Dynamic Level:
EMA 50 around 4,450 (bearish dynamic resistance)
➡️ Primary Scenario:
Price retests the broken 4,430–4,450 zone from below and shows rejection. This would confirm a classic break-and-retest continuation, opening the path toward the 4,390 level as the next downside objective.
⚠️ Risk Scenario:
If price reclaims and accepts back above the broken demand zone, the bearish continuation would be delayed. In that case, a deeper recovery toward the 4,465–4,480 supply zone could develop before sellers re-engage.

Gold Slips Under Descending Pressure — Correction Unfolding Gold on the M30 timeframe is showing clear signs of short-term structural weakness after failing to sustain the previous bullish impulse. Following the strong rally into the recent highs, price has transitioned into a descending structure, characterized by lower highs forming beneath a clearly defined descending trendline. This shift reflects a loss of upside momentum and signals that the market has entered a corrective phase.
Current price action is consolidating around the 4,430 area, a level that previously acted as a key intraday support. Repeated reactions around this zone suggest indecision, but the inability to reclaim and hold above the descending trendline keeps downside pressure dominant. Each rebound attempt has been met with selling interest, indicating that buyers are struggling to regain control in the short term.
As long as price remains capped below the descending trendline, the corrective scenario remains favored. A brief bounce from current levels cannot be ruled out; however, such a move would likely function as a liquidity-driven pullback rather than a genuine reversal. In that case, renewed selling pressure could drive price toward the 4,399 support zone, which represents the first meaningful downside target and a prior reaction area.
If bearish momentum persists and this level fails to hold, Gold could extend lower toward the 4,380 region, where a deeper liquidity sweep is likely to occur. This zone aligns with previous consolidation and may attract stronger buyer interest, potentially marking the point where the correction begins to stabilize.
Despite the current bearish intraday structure, the broader higher-timeframe bias remains constructive unless price decisively breaks below the lower support range. Until that happens, the ongoing decline should be viewed as a corrective pullback within a larger trend, rather than confirmation of a full trend reversal.

Accumulation for a Push Higher or Breakdown Into Deeper CorrectHello traders! Here’s a clear technical breakdown of XAUUSD (1H) based on the current chart structure.
Gold previously printed a strong bullish impulse, establishing a sequence of higher highs and higher lows. After reaching the recent peak, price transitioned into a sideways consolidation, signaling a pause in momentum rather than an immediate trend reversal.
This consolidation has formed between well-defined boundaries, reflecting market equilibrium as buyers and sellers reassess value after expansion. Price action within this range remains controlled, with no impulsive follow-through in either direction so far.
🟦 SUPPLY & DEMAND – KEY ZONES
Supply Zone:
The upper range near 4,500–4,520 acts as a clear supply zone, where previous buying momentum stalled and sellers entered aggressively. This area represents overhead resistance and the ceiling of the current range.
Demand Zone:
The 4,430–4,440 region is a key demand zone, aligned with prior breakout structure and repeated reactions. Buyers have consistently defended this level, preventing deeper downside.
Breakdown Risk Area:
A clean acceptance below the demand zone would expose 4,330, which aligns with the next liquidity pool and the projected downside target if structure fails.
🎯 CURRENT MARKET POSITION
Currently, Gold is trading directly on top of its demand zone, placing price at a high-impact decision point. This is where the market will determine whether the consolidation resolves as accumulation or transitions into distribution.
The lack of strong bearish momentum into demand suggests sellers are cautious, but confirmation is still required.
🧠 MY SCENARIO
As long as Gold holds above the 4,430–4,440 demand zone, the broader bullish structure remains intact, and current price action can be viewed as range consolidation after expansion. A bullish reaction from demand could lead to a push back toward the 4,500 supply zone, and acceptance above that area would open the door for continuation higher.
However, a decisive hourly close below the demand zone would invalidate the accumulation thesis. In that case, price could accelerate lower toward 4,330, confirming a deeper corrective phase before buyers potentially re-enter.
For now, price is balancing, not breaking.
⚠️ RISK NOTE
This is a critical inflection zone. Let price confirm direction from demand or breakdown, avoid anticipation, and always manage your risk.

Gold Is at a Decision Point — Break Higher or Deeper Liquidity Price is currently reacting at the key demand zone around 4,430–4,440, where buyers are attempting to defend the EMA support after a rejection from the 4,470–4,480 resistance zone.
A hold and bullish reaction above 4,430 would signal absorption of selling pressure, opening the path for a recovery toward 4,460–4,470, with a potential extension back into the upper resistance zone.
However, a clean break and close below 4,430 would invalidate the short-term bullish attempt and expose the downside toward 4,400, where liquidity and a stronger demand area are likely to be tested before any meaningful continuation.

EUR/JPY SENDS CLEAR BULLISH SIGNALS|LONG
Hello, Friends!
EUR/JPY pair is in the downtrend because previous week’s candle is red, while the price is clearly falling on the 4H timeframe. And after the retest of the support line below I believe we will see a move up towards the target above at 183.402 because the pair oversold due to its proximity to the lower BB band and a bullish correction is likely.
Disclosure: I am part of Trade Nation's Influencer program and receive a monthly fee for using their TradingView charts in my analysis.
✅LIKE AND COMMENT MY IDEAS✅

GOLD (XAUUSD) — Sell From Resistance | Targets 4,412 → 4,330Gold prices are currently holding firm in strong demand after a positive correction within a bullish market structure. Prices have broken through resistance levels several times, but the next resistance is the all-time high (ATH). Sellers will likely prevent the price from breaking through and reaching a new peak just before news from the White House.
A sharp drop is expected when the price reaches the predicted resistance level of 4,491.
If the price fails to break through and holds below this resistance, a liquidation is likely to occur, and the price will quickly fall to 4,400.
Despite being in an uptrend, a sharp correction is expected to consolidate for a stronger subsequent rally. It will also fill the gap left by the previous day.
A breakdown above the resistance level would invalidate this setup.

Gold Bullish Outlook | Dollar Weakness & Geopolitical Risks!Hey Traders,
In the coming week, we are closely monitoring XAUUSD (Gold) for a potential buying opportunity around the 4,280 zone. Gold remains in a strong bullish trend and is currently undergoing a healthy corrective pullback, approaching a key trendline confluence and 4,280 support & resistance zone, which could act as a high-probability demand area.
From a macro perspective, the recent weakness in the US Dollar continues to support upside momentum in Gold. Additionally, last night’s escalation of US tensions with Venezuela has increased geopolitical uncertainty, further boosting safe-haven demand for Gold, which strengthens the bullish bias.
As always, wait for confirmation and manage risk accordingly.
Trade safe,
Joe.
