Gold Supported by the Fed but Still Trapped Near 4,200 USDGold opened around 4,209 USD/ounce — about 10 USD higher than last weekend — mainly thanks to continued weakness in the US Dollar as the DXY broke below 99 and slipped to 98.9. At the same time, markets are broadly aligned with expectations that the Fed will cut another 0.25% at the 10 December meeting, creating a favourable backdrop for gold as both yields and USD remain depressed. From a macro perspective, gold is clearly being “supported,” but on the 2-hour chart this still looks like a rebound within the broader 4,200 consolidation box — not yet enough to confirm a new bullish leg.
Structurally, the medium-term trend remains upward, with gold forming higher lows since late November. However, what stands out is the inability of recent highs in the 4,245–4,250 region to surpass previous peaks. This signals weakening buying pressure as price approaches the upper range, locking the market inside the 4,185–4,230 zone — essentially a tight tug-of-war between buyers and sellers. While the macro trend remains bullish, the short-term structure is leaning toward a sideways–corrective mode, reflecting a market waiting for PCE data and the upcoming Fed meeting.
Buy!!

XAUUSD: The Calm Before the BreakoutOANDA:XAUUSD Over the past few sessions the price has shown remarkable strength, yet the market has recently slowed and slipped into a sideways phase. This type of behavior is common after a strong rally and does not necessarily indicate weakness. It is more of a natural pause, allowing buyers to regroup while maintaining control of the overall trend.
The decisive moment will come if the price breaks convincingly above the upper boundary of this consolidation. That would confirm that bullish momentum is returning and that the market is preparing to move toward new highs.
This is the scenario I am watching: a calm accumulation phase, a temporary slowdown, and then a renewed move higher once consolidation has run its course. At this stage, the breakout appears less like a possibility and more like something that is gradually taking shape.

GBPAUD Will Go Higher From Support! Long!
Please, check our technical outlook for GBPAUD.
Time Frame: 4h
Current Trend: Bullish
Sentiment: Oversold (based on 7-period RSI)
Forecast: Bullish
The market is approaching a key horizontal level 2.007.
Considering the today's price action, probabilities will be high to see a movement to 2.020.
P.S
We determine oversold/overbought condition with RSI indicator.
When it drops below 30 - the market is considered to be oversold.
When it bounces above 70 - the market is considered to be overbought.
Like and subscribe and comment my ideas if you enjoy them!

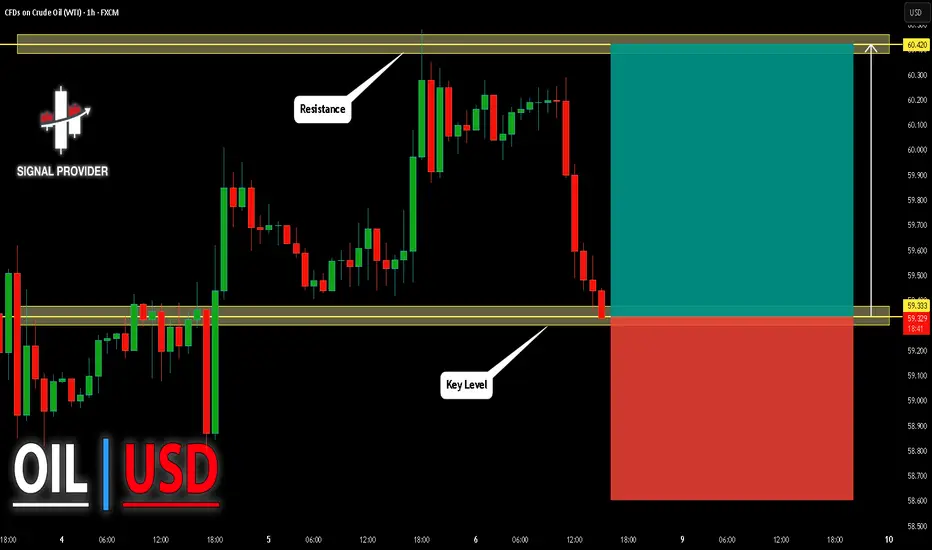
USOIL Will Go Up From Support! Buy!
Here is our detailed technical review for USOIL.
Time Frame: 1h
Current Trend: Bullish
Sentiment: Oversold (based on 7-period RSI)
Forecast: Bullish
The market is approaching a significant support area 59.333.
The underlined horizontal cluster clearly indicates a highly probable bullish movement with target 60.420 level.
P.S
Overbought describes a period of time where there has been a significant and consistent upward move in price over a period of time without much pullback.
Like and subscribe and comment my ideas if you enjoy them!
XAUUSD – The Silent but Dangerous Upside Force!Gold is showing a truly silent climb , with price edging higher as the USD slips to its lowest level in five weeks . With markets almost certain that the Fed will cut rates on December 9–10 , capital is gradually shifting toward safe-haven assets. What is interesting here is that gold is rising quietly, as if the market is waiting for one more confirmation before a stronger move.
On the chart, XAUUSD is trading inside a compression pattern , forming higher lows and repeatedly bouncing from the lower rising trendline. Each time price approaches 4,246–4,250, sellers appear, yet the pullbacks remain shallow, showing that selling pressure is weak and buyers are still in control.
Strategy for now:
– Prefer waiting for a pullback toward 4,205–4,210
– Look for a clear bullish reaction
– Short-term target: 4,240–4,250
As long as gold holds above the rising trendline and does not break below 4,200, this remains a phase of accumulation before a potential breakout , rather than a reversal. Gold may not be rising aggressively, but it is rising with intention – and that is often the most important type of trend to pay attention to.

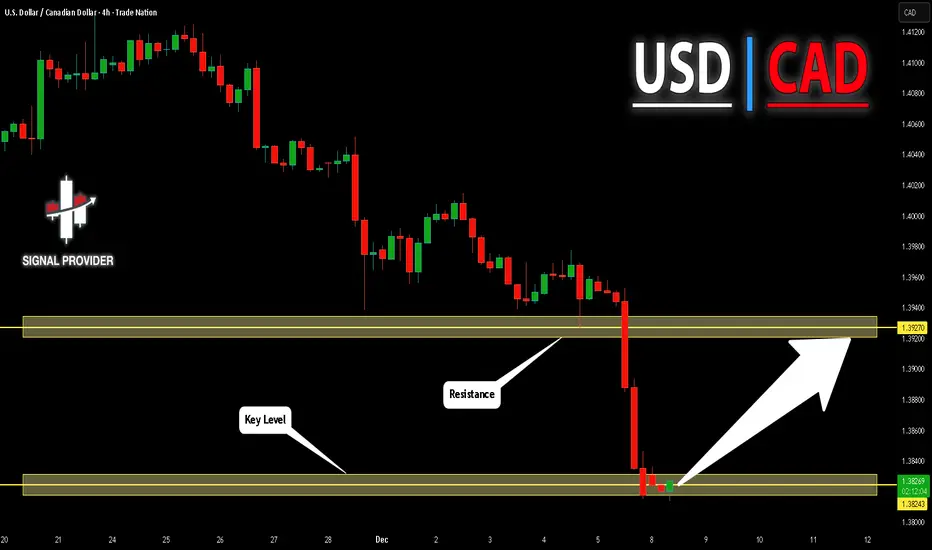
USDCAD Will Go Higher! Long!
Take a look at our analysis for USDCAD.
Time Frame: 4h
Current Trend: Bullish
Sentiment: Oversold (based on 7-period RSI)
Forecast: Bullish
The market is on a crucial zone of demand 1.382.
The oversold market condition in a combination with key structure gives us a relatively strong bullish signal with goal 1.392 level.
P.S
Please, note that an oversold/overbought condition can last for a long time, and therefore being oversold/overbought doesn't mean a price rally will come soon, or at all.
Like and subscribe and comment my ideas if you enjoy them!
Euro Leads the Wave – Buyers Take the Advantage!If I had to choose a pair that is currently sailing with the wind , EURUSD would be the standout name. The expectation that the Fed will cut interest rates soon is weakening the USD, while improving eurozone data helps the Euro attract capital. The macro backdrop is clearly favoring the buyers more than the sellers.
Looking at the H4 chart, EURUSD is moving smoothly inside the rising channel . Price stays near the lower boundary of the channel, above the Ichimoku cloud and the 1.1640 support zone. This shows the uptrend is still intact and current pullbacks are mostly technical corrections .
My preferred scenario: wait for price to pull back around 1.1640–1.1650 , where price meets the channel + cloud, then look for bullish confirmation to buy with the trend. The near-term target is 1.1700, the resistance zone above. As long as EURUSD holds above 1.1640, every dip is still a chance to join the uptrend rather than trying to sell against it.

Bitcoin – Selling Pressure Rises as the Downtrend FormsHello everyone,
Bitcoin is showing a clear corrective leg on the H4 timeframe after failing to sustain the bounce near 94,000 USD. Price sliced through the closest FVG and retreated back to the 88,500–89,000 USD demand zone, signalling that buyers are present but not strong enough to shift the structure. The overall technical picture now leans towards a short-term bearish trend, with the spike to 96,000 acting merely as a liquidity grab before sellers resumed control.
BTC has already formed a lower high at 94,000 and confirmed a new lower low by breaking the lower FVG, fully activating the short-term downtrend. The Ichimoku cloud has turned red and thickened, creating a strong barrier between 90,500–92,000 that continues to reject every recovery attempt. Buy-side volume also remains noticeably weaker than sell-side activity, reflecting defensive rather than aggressive bidding.
On the fundamental side, Bitcoin remains under pressure as the US Dollar Index (DXY) rebounds and US Treasury yields climb, drawing short-term flows away from crypto. With markets now anticipating NFP and PCE data, caution dominates; historically, BTC tends to soften before major macro releases as traders avoid adding risk.
Let’s see how BTC reacts once the data hits — this move may determine whether the correction deepens or stabilises.

AUDUSD Potential UpsidesHey Traders, in tomorrow's trading session we are monitoring AUDUSD for a buying opportunity around 0.66300 zone, AUDUSD is trading in an uptrend and currently is in a correction phase in which it is approaching the trend at 0.66300 support and resistance area.
Trade safe, Joe.

XAUUSD – Sideways Ahead of the CPI CatalystGold is currently in a “holding pattern” as the market waits for the U.S. CPI data on December 5. Rising U.S. Treasury yields are putting pressure on prices, but the USD dropping to a 1-month low is helping to cushion the downside. At the same time, labor data remains mixed — initial jobless claims fell sharply , while ADP reported a steep decline in private employment — leaving traders without a clear directional bias. As a result, XAUUSD is stuck in a sideways phase.
On the chart, gold is ranging between 4,200 – 4,280:
4,200 → strong support, aligned with the ascending trendline and Ichimoku cloud base.
4,280–4,300 → strong resistance where sellers consistently appear.
Price action shows buyers holding a slight advantage: candles repeatedly bounce from support, the trendline remains intact, and the Ichimoku cloud supports price like a cushion. However, bullish momentum is still not strong enough to break through 4,280 as the market remains cautious ahead of CPI.
Likely scenario: XAUUSD will continue oscillating within this sideways box — retesting 4,200 then moving back toward 4,280. A clear breakout will depend entirely on the CPI release:
Break above 4,280 → opens the path to 4,300+
Break below 4,200 → signals a deeper correction
For now, the best approach is range trading and waiting for a decisive signal after CPI.

NZD/CAD BULLS ARE STRONG HERE|LONG
Hello, Friends!
The BB lower band is nearby so NZD-CAD is in the oversold territory. Thus, despite the downtrend on the 1W timeframe I think that we will see a bullish reaction from the support line below and a move up towards the target at around 0.802.
Disclosure: I am part of Trade Nation's Influencer program and receive a monthly fee for using their TradingView charts in my analysis.
✅LIKE AND COMMENT MY IDEAS✅

AUD/CAD LONG FROM SUPPORT
Hello, Friends!
Bullish trend on AUD/CAD, defined by the green colour of the last week candle combined with the fact the pair is oversold based on the BB lower band proximity, makes me expect a bullish rebound from the support line below and a retest of the local target above at 0.921.
Disclosure: I am part of Trade Nation's Influencer program and receive a monthly fee for using their TradingView charts in my analysis.
✅LIKE AND COMMENT MY IDEAS✅

CHF/JPY BUYERS WILL DOMINATE THE MARKET|LONG
CHF/JPY SIGNAL
Trade Direction: long
Entry Level: 192.579
Target Level: 193.023
Stop Loss: 192.284
RISK PROFILE
Risk level: medium
Suggested risk: 1%
Timeframe: 1h
Disclosure: I am part of Trade Nation's Influencer program and receive a monthly fee for using their TradingView charts in my analysis.
✅LIKE AND COMMENT MY IDEAS✅

CAD/JPY BULLS ARE GAINING STRENGTH|LONG
Hello,Friends!
CAD/JPY pair is in the uptrend because previous week’s candle is green, while the price is obviously falling on the 4H timeframe. And after the retest of the support line below I believe we will see a move up towards the target above at 111.532 because the pair is oversold due to its proximity to the lower BB band and a bullish correction is likely.
Disclosure: I am part of Trade Nation's Influencer program and receive a monthly fee for using their TradingView charts in my analysis.
✅LIKE AND COMMENT MY IDEAS✅

Intermarket Perspective: Gold – Oil – Dollar IndexThree Markets, One Big Picture
If you want to understand where XAUUSD is now — and where it is likely to move next — you cannot look at gold alone.
In today’s market, Intermarket Analysis is essential to reading real money flow.
The three markets you must watch together are:
Gold – Oil – Dollar Index (DXY).
They interact like three gears in the same machine.
Let’s break down how these markets connect — and how professional traders use them to anticipate gold’s next move.
1. Gold – The Safe-Haven and Market Risk Barometer
Gold reflects expectations about:
Interest rates
Inflation
Geopolitical risk
Safe-haven flows
Important Principle:
Lower rates → weaker USD → lower yields → stronger gold.
Gold is extremely sensitive to the DXY and the U.S. 10-year yield.
But looking at USD alone is not enough — that’s where Oil enters the picture.
2. Oil – The Engine of Global Inflation
Oil is not “just a commodity” — it is the foundation of inflation.
When oil rises sharply:
Transportation costs rise
Production costs increase
Inflation spreads across the economy
This forces central banks to maintain or raise interest rates.
→ Higher rate expectations often pressure gold lower
→ And support the Dollar Index
In short:
Oil ↑ → Inflation ↑ → Fed turns hawkish → USD ↑ → Gold ↓
Not always 1:1, but this is the classic money-flow pattern.
3. Dollar Index (DXY) – The Global Money Compass
DXY measures USD strength against major currencies.
When DXY rises, it usually signals:
Higher interest rate expectations
Risk-off sentiment
Growing demand for USD
This typically:
→ Pressures gold downward
→ Impacts oil prices because oil is USD-denominated
Strong DXY = Weak Gold
Weak DXY = Gold has room to rally
4. How These Three Markets Interact
Scenario 1: DXY Up – Oil Up – Gold Down
→ High inflation, hawkish Fed, strong USD
→ Gold faces pressure due to rising yields
→ Oil may rise from supply issues or geopolitical tension
Scenario 2: DXY Down – Gold Up – Oil Flat or Down
→ Rate-cut expectations rise
→ Gold benefits most
→ Oil may lag due to supply-demand dynamics
Scenario 3: Oil Spikes – Gold & DXY Move Mixed
→ Inflation rises
→ DXY may strengthen
→ Gold can rise due to recession fears
This is usually a volatile phase filled with false signals.
5. As a Gold Trader, What Should You Watch?
(1) DXY
If DXY breaks its bullish structure → gold often prepares for a strong move.
(2) Oil
Rising oil pushes inflation up → gold may fall initially but can surge later if economic risks grow.
(3) Macro Data
Fed policy
OPEC decisions
CPI, PCE
Oil inventory data
U.S. employment numbers
These are the lifeblood connecting all three markets.

Gold completes its corrective phase and heads toward $4,250OANDA:XAUUSD is moving within a remarkably well-structured ascending channel, and the overall market structure clearly highlights the strength of the buying momentum. Each swing produces higher highs and higher lows, confirming that the bullish dynamic remains intact despite a few natural pauses along the way. The recent pullback looks more like a healthy technical breather than a sign of weakness, often the kind of pause that sets the stage for a new upward acceleration.
The price is now approaching a key support zone, where the lower boundary of the channel aligns with a previously proven demand area. If the market reacts here, buyers could find a highly favorable re-entry opportunity that aligns perfectly with both the channel structure and the logic of the current trend. In that scenario, the natural upside target is around 4,250 dollars, a level that combines the channel’s midline with a historical resistance, giving even more weight to this objective.
The bullish outlook remains valid as long as the price holds above the support zone and the ascending trendline. A decisive break below these levels would redefine the market context and open the door to a deeper correction, but for now, market conditions continue to favor long positions.
Stay disciplined in your market reading, validate your setups carefully, and protect your capital with strict risk management. Good luck.

Gold Awakens: Sharp Pullback but Outlook Remains BrightFrom a technical perspective, gold is currently moving within a parallel ascending channel, showing a clear bullish momentum with a rhythm that is hard to ignore. The price recently bounced away from the resistance area, indicating a typical overbought reaction. At the moment, the market is approaching the lower boundary of this projected channel, an area considered important. The convergence of several technical support levels in this zone is likely to attract renewed buying interest.
I expect the price to rebound toward the 4,250 area, which aligns with the mid-channel region. The bullish momentum may not appear immediately. The situation could develop into a consolidation phase, a false decline, or even a sudden acceleration.

XAUUSD: A new rise is possible after the pullbackXAUUSD has climbed strongly along a steep uptrend, and based on what I’m seeing on the chart, I expect the price to continue pushing toward the 4,265 area.
This zone could become a decision point where the price either finds support and bounces higher or breaks below and allows the move to extend deeper.
If I had to choose a direction right now, I’d lean toward more upside. But price action will always decide what comes next because the chart always speaks last.
When the price breaks below the trendline with real conviction, the bullish scenario loses validity. That could signal a pause in the uptrend or even a short-term reversal.
This is not financial advice, only my personal thoughts based on what I see on the chart.

EURUSD – Upswing Slows at Key Resistance 1.1680Hello everyone, EURUSD is clearly slowing on the H4 chart as it touches the resistance zone 1.1670–1.1680 – overlapping with previous highs, a bearish FVG, and the upper edge of the Ichimoku cloud. Sellers reacted strongly, reflected in the H4 candle closing below the FVG, indicating weakening bullish momentum. Below, the market left empty FVG zones around 1.1620 – 1.1590 – 1.1560, potential support areas where buyers may step in.
On the news side, the USD is slightly stronger as investors await PCE data, causing a minor DXY rebound and pressure on the EUR. Eurozone growth remains weak with PMI below 50, while the ECB cannot ease. The Fed is expected to cut 0.25% in December, but confidence is not yet strong enough to weaken the USD immediately.
Overall, EURUSD is likely to adjust toward the lower FVG zones, initially 1.1620. Only a lower-than-expected PCE or stronger Fed easing expectations would provide enough momentum to break 1.1680 and target 1.1725–1.1740. For now, 1.1680 remains a significant barrier without a news-driven catalyst.

Gold Rockets Higher – Buy Momentum UnstoppableGold showed a sharp upside movement today from the strong intraday support area 4200/4186 and the market reached a high of 5258, which clearly indicates that buyers are in full control. Such a strong bullish breakout usually continues in the same direction.
The price is trading far above the support zone, confirming strong momentum. As long as the market holds above support the probability of further bullish continuation remains high.
KEY POINTS
Entry Level 4213
Support Area. 4200/4186
Target 1. 4230
Target 2. 4255

NETFLIX - Bottom is in?NASDAQ:NFLX
The bottom looks close based on this weekly chart.
- Deeply oversold RSI
- Bounced off the POC in anchored volume profile
- W%R deeply oversold and starting to curl up
Overall, the acquisition of WBD is expensive, but Netflix is playing the long game.
This provides content as far as the eye can see with the addition of DC, GoT series, and more.
Overall it's a blockbuster, but I feel NFLX reaching a $1T market cap is inevitable... currently sitting sub $500B.

Gold Eyes 4,207 Rebound as USD Softens & Venezuela Tensions RiseHey Traders, in today’s trading session we are monitoring XAUUSD for a potential buying opportunity around the 4,207 zone. Gold continues to trade within a broader uptrend, and the current pullback is bringing price into a key support–resistance confluence aligned with the ascending trend structure.
Fundamentals:
The US Dollar remains under pressure, with markets increasingly leaning toward a dovish shift from the Federal Reserve, reinforcing gold’s classic negative correlation with the USD. A softer Dollar environment typically boosts demand for metals, and this week’s macro flow continues to point in that direction.
At the same time, geopolitical tensions between the U.S. and Venezuela are escalating, increasing global uncertainty and driving markets toward safe-haven assets. Gold is already reflecting this risk premium, and any further escalation could accelerate flows into XAU.
Next Step:
We’re watching price reaction closely around 4,207 for a potential continuation of the broader bullish structure.
Trade safe,
Joe.

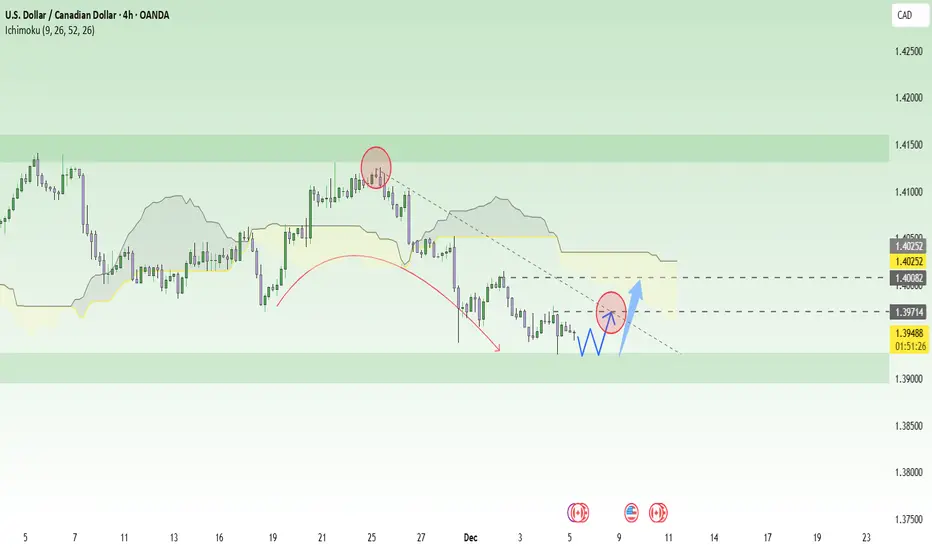
USDCAD – A “Soft Rebound” Forming at Defensive SupportUSDCAD is currently caught between two weak forces . On one side, the USD is losing momentum as markets almost fully expect the Fed to cut rates soon ; on the other side, the CAD isn’t strong either as Canada’s manufacturing data continues to weaken. These opposing forces neutralize each other, preventing a strong trend—but they do create room for a mild technical rebound from the current support zone.
On the H4 chart, USDCAD has slipped out of its upper consolidation range and gradually moved toward the support area around 1.3920, a level where price has reacted strongly multiple times before. The decline is slowing, with candles showing reduced volatility—signs that selling pressure is fading . Above, the zone around 1.3970, aligned with the lower edge of the Ichimoku cloud and the descending trendline, becomes a reasonable upside target for a rebound.
Preferred scenario: USDCAD may continue to test the floor near 1.3920, form a small accumulation pattern, then bounce for a light recovery toward 1.3970, possibly even sweeping slightly higher toward the cloud if USD sentiment stabilizes. However, this remains only a corrective move within a broader weakening structure. Therefore, the optimal approach is to look for short-term buys at support , take profits early at nearby resistance, and maintain strict risk management in a macro environment that remains highly uncertain.