GBP/JPY - Multi Timeframe Analysis⭐ 8H CHART – Mid-Range Chop But Setting Up a Sneaky Play
📍 Current Situation
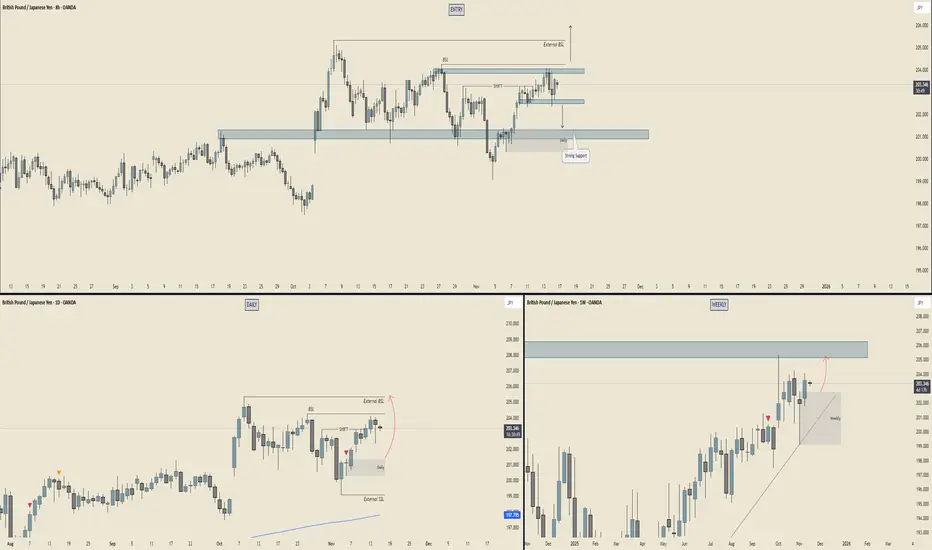
Price is chilling just under that internal BSL, repeatedly tapping a mini supply shelf. You’ve got a SHIFT marked and a clear reaction zone sitting underneath (your grey + blue combo).
💡 Key Levels
Internal BSL → Gets run, we go hunting for External BSL above.
Strong support block below → Price keeps respecting this like a trampoline.
Market is compressing between:
🔼 8H supply above
🔽 Bullish support block below
📌 Interpretation:
This looks like accumulation under liquidity → classic build-up for a sweep + pop.
If price dips first, your grey demand is the reload zone before any upper raid.
⭐ DAILY CHART – Clean Buyside Above, Built For a Run
📍 Structure
Daily is holding bullish order flow. You’ve got:
Daily BSL close overhead
External BSL even further up
A beautiful Daily demand block (highlighted) that caused the last impulsive leg.
📌 Interpretation:
The arrow you drew says it all — Daily wants that buy-side.
Sweep the daily demand → send price into external liquidity.
Momentum = bullish unless that daily block breaks.
⭐ WEEKLY CHART – HTF Premium Zone Waiting Above
📍 The Big Picture
Weekly demand held weeks ago and price has been climbing ever since.
Key details:
That massive weekly supply / inefficiency block above 205-207 is the magnet.
Price is stair-stepping higher with clean bullish candles.
Arrow toward weekly imbalance = HTF target.
📌 Interpretation:
Weekly is bullish and wants that macro supply fill.
Shorts inside here = countertrend until we hit the big zone.
🎯 SUMMARY – What’s the Play?
🔥 Bias : Bullish on all timeframes
📌 What the market wants:
A tiny correction to demand (8H or Daily)
Run internal liquidity
Push toward 205-207 weekly supply
🧨 What invalidates this?
A clean break and close below daily demand — then the bullish engine loses fuel.
Buy-signal
Professional Analysis and BUY SIGNAL: AAVEUSDT (Daily Timeframe)Current Setup:
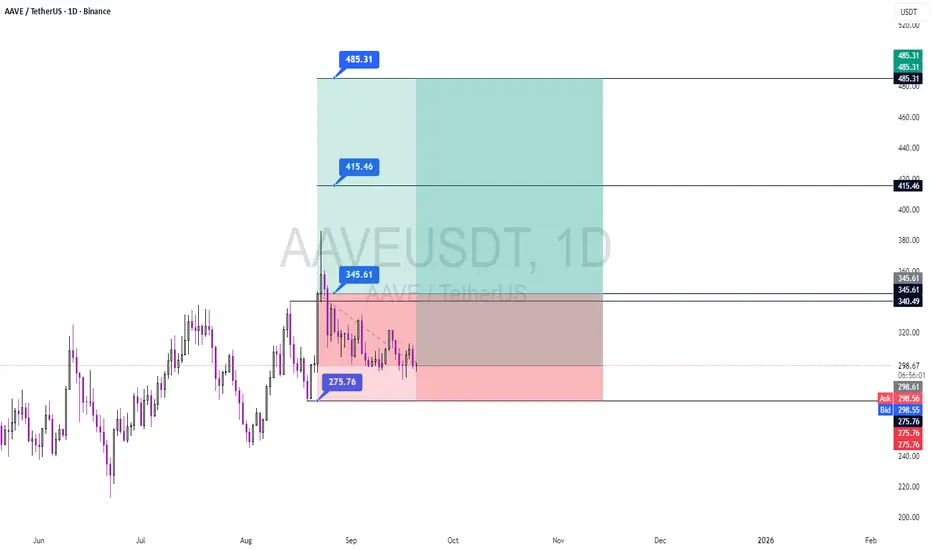
AAVE has delivered a buy signal following a successful breakout and consolidation above the key $340.49 resistance level, with confirmation at $345.61. Although the second candle after the signal touched $380 and formed a large upper shadow (indicating short-term profit-taking and buyer trapping), the overall structure remains aligned with the bullish trajectory. The asset is now consolidating within the $345.61–$275.76 range, offering a potential entry zone for strategic buyers.
Trigger & Confirmation:
The buy signal was confirmed at $345.61. While the rejection at $380 suggests increased short-term volatility, it does not invalidate the broader bullish outlook. Traders may consider entries near the $345–$350 support zone, with a decisive close above $380 reaffirming momentum.
Projection:
Upon sustained bullish momentum, AAVE is poised to target $415.46 (Target 1) and $485.31 (Target 2). The recent rejection at $380 implies potential consolidation before upward resumption. A breakout above $380 could accelerate momentum toward higher targets.
Risk Management:
Stop-Loss: $275.76 (daily close below).
Position Strategy:
Given the recent volatility, limit orders near $345–$350 are advised for optimal risk-reward.
Use SPOT trading or low leverage (≤3x) to mitigate volatility risks.
Risk ≤5% of capital per position.
At $415.46 (Target 1), close 75% of the position to secure profits and adjust the stop to breakeven.
Hold the remainder toward $485.31 (Target 2).
Note: The upper shadow at $380 underscores the need for disciplined entry and risk management. This signal remains valid unless $275.76 is lost.
Trade Safe,
S.Reza Mehrjuyan / CEO FNS
Analyst, Manager
Potentially, A Safer Way To Long The EURUSDIn contrast to my previous outlook, the current price action suggests an increased probability of a deeper bearish move—potentially invalidating the buy zone marked out in the previous analysis. This sudden change is largely driven by the prospect of untapped liquidity residing beneath that zone, reinforcing the well-known market principle that price seeks out liquidity before committing to directional moves.
Given this development, the newly identified zone on the chart emerges as a more technically sound and reliable area from which to anticipate bullish interest. It aligns better with the broader liquidity profile and offers a stronger base for accumulation. Traders may opt to wait for confirmations within this zone or, depending on their risk appetite, consider executing buy positions upon price entry.
As always, patience and clarity are key as we allow price to reveal its intention.
Fingers crossed 🤞
Wishing you all a focused and profitable trading week.
Catch you on the next one. 🫡

APT - A lower timeframe view - Breakout Entry- On 1D candle, APT is still trading inside the channel
- currently price is trading near the resistance and got rejected from the resistance as expected.
- I'm expecting few more candles near the resistance zone before breakout.
If we look at the higher timeframe (1W) view we shared earlier, there is huge potential for uptrend as we are expecting past pattern to repeat
if you are looking for a short term trade without focusing on weekly chart, this is a good opportunity
Entry Price: 5.313
Stop Loss: 3.462
TP1: 6.141
TP2: 7.270
TP3: 8.634
TP4: 10.583
TP5: 14.768
Don't forget to keep stoploss
Cheers
GreenCrypto

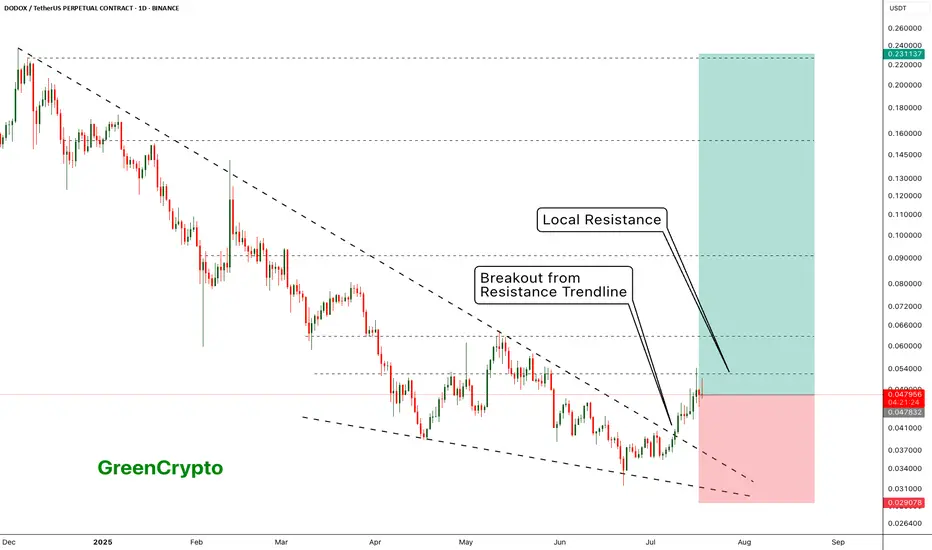
DODOX - Resistance is holding it back - Huge Potential- DODOX has successfully broken out from the resistance trendline
- Now its being pushed back back the weak local resistances
- I see a huge upward potential here.
Entry Price: 0.048271 ( Or you can wait for it breakout from the local resistance of 0.063051)
Stop Loss: 0.029078
TP1: 0.062621
TP2: 0.079766
TP3: 0.103243
TP4: 0.151853
TP5: 0.222332
Max Leverage 5x.
Don't forget to keep stoploss
Cheers!
GreenCrypto
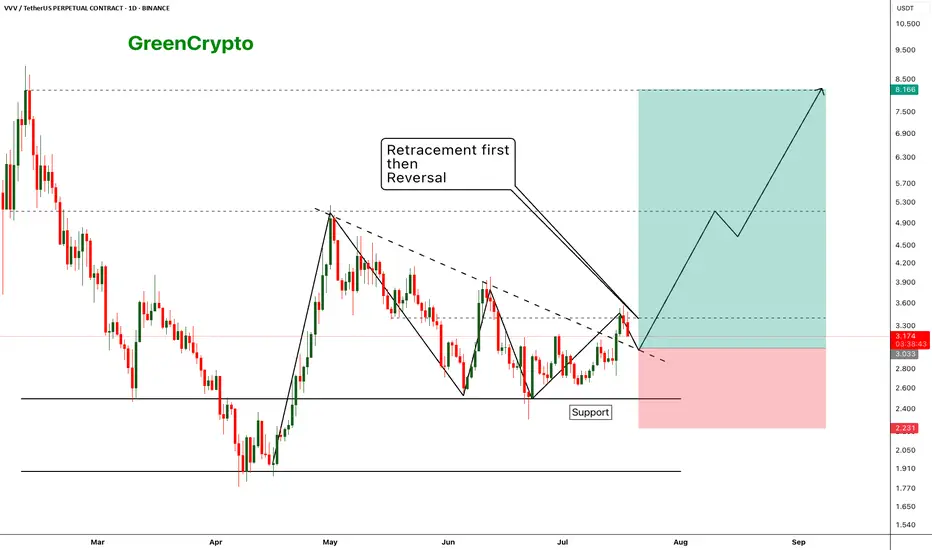
VVV - Expecting perfect reversal after the retracement- price has broken out from the resistance trendline and now we are seeing a retracement as expecting
- Price should hold the support (previous resistance) and reverse from the suppport zone.
- we can enter our trade once the retracement completed
Entry Price: 3.033
Stop Loss: 2.231
TP1: 3.411
TP2: 4.037
TP3: 4.851
TP4: 6.360
TP5: 8.028
Max Leverage 5x.
Don't forget to keep stoploss.
Cheers!
GreenCrypto
MOONPIG Is Taking Off — Thanks to James Wynn’s Viral CloutThe James Wynn Phenomenon:
James Wynn, a crypto trader who turned $4 million into $100 million before losing nearly all of it in leveraged Bitcoin futures, has become a polarizing figure in the crypto space. His massive trades, including a $1.2 billion Bitcoin long position that ended in a $17.5 million loss and a subsequent $1 billion short position with 40x leverage, have made him a viral sensation. Despite these setbacks, Wynn’s resilience and bold moves keep him in the spotlight, with thousands of traders and investors following his every step.
Wynn’s fame stems not just from his trading but from his ability to move markets. His posts on X, where he boasts a significant following, often trigger rapid price movements in the assets he mentions. This influence is now centered on $MOONPIG, a Solana-based meme coin that’s gaining traction thanks to his vocal support.
$MOONPIG: A Meme Coin with Momentum:
$MOONPIG, a meme coin built on the Solana blockchain, has seen its price surge by as much as 80% following Wynn’s endorsements, though it’s also faced volatility with a 30% drop in 24 hours and a 60% decline from its all-time high. Despite these fluctuations, the coin’s community-driven narrative and Wynn’s backing make it a compelling speculative play.
Wynn’s posts on X reveal his belief in $MOONPIG’s potential to be the “next SafeMoon” of this cycle, predicting a run to a billion-dollar market cap. He’s emphasized its appeal to retail investors, calling it “normie-friendly” and highlighting its strong community as a key driver. This narrative aligns with the meme coin mania that often propels tokens like CRYPTOCAP:DOGE or CRYPTOCAP:SHIB to explosive gains during bullish market phases.
Why I’m Bullish:
Wynn’s Influence as a Catalyst: Wynn’s fame amplifies $MOONPIG’s visibility. His posts on X, such as one claiming he transferred profits to the $MOONPIG reserves wallet, signal commitment and attract attention. When Wynn speaks, traders listen, and his endorsements have already driven significant price action, with one instance sparking an 80% surge.
Community Strength: Wynn has emphasized $MOONPIG’s community-driven ethos, stating it “doesn’t need KOLs or BS” and thrives on organic support. In the meme coin space, strong communities can sustain momentum, as seen with tokens like CRYPTOCAP:PEPE , which Wynn also supports.
Market Timing: With Bitcoin hitting new highs and retail interest flooding back into crypto, $MOONPIG is well-positioned to ride the wave. Wynn’s thesis that retail investors will soon pour into altcoins aligns with current market sentiment, making $MOONPIG a potential beneficiary.
Speculative Upside: Meme coins thrive on hype, and $MOONPIG’s low market cap relative to its potential—analysts like @KookCapitalLLC
speculate a $1 billion valuation—offers significant upside for early investors. Even after recent pullbacks, the coin’s volatility suggests opportunities for traders who can stomach the risk.

XAUUSD (Gold) - ICT AnalysisI'm currently looking for higher levels on Gold,
after we reversed from a Daily IRL zone and printed a clear 1H structure shift.
Price just rejected from a 4H IRL, and my first target is the 4H ERL,
which is already marked on the chart.
Watching price action closely for continuation confirmation.

GBPUSD today should buy or sell?GBP/USD continues to build on its bullish momentum, reclaiming the 1.3100 level on Monday morning. The ongoing weakness of the U.S. dollar suggests that the path of least resistance for this pair remains to the upside.
The key monthly employment report is set to be released on Tuesday, followed by the latest consumer inflation data on Wednesday. In addition, investors this week will also face the release of U.S. monthly Retail Sales figures and pay close attention to a speech by Federal Reserve Chairman Jerome Powell — a speech that could play a crucial role in shaping the USD’s price dynamics. These events are expected to provide meaningful catalysts for the GBP/USD pair in the latter part of the week.

Gold Gathers Strength Amid Global UncertaintyRight now, gold is benefiting from a convergence of highly favorable conditions for a strong bullish trend. Growing concerns about a global trade war have triggered widespread risk-off sentiment, driving capital flows into safe-haven assets like gold. As a result, the precious metal has maintained an impressive upward momentum throughout the past week and is currently stabilizing around $3,235.
From my personal view, the U.S. dollar is showing clear signs of weakness — and that only adds fuel to gold’s rally. The $3,300 mark looks like the next logical milestone, with $3,500 as a longer-term target if the current trend holds. Recent corrections in gold have been shallow and brief, which reflects persistent buying pressure and no signs of a distribution phase at the top.
This week, we should pay close attention to major monetary policy events, including meetings from the Bank of Canada, the ECB, and a speech by Federal Reserve Chairman Jerome Powell. These events could bring increased volatility to the market. However, if central banks hold or cut rates as expected, it will provide even stronger psychological and technical support for gold.
Personally, I remain optimistic about the bullish outlook on XAUUSD — how about you?

AUD/USD Breakdown: Bears in ControlThe AUD/USD pair has officially broken below its medium-term ascending channel on the daily chart, signaling a strong shift in momentum. After failing to hold above the resistance zone at 0.6311 – 0.6386, the pair reversed sharply and is now trading around 0.6213.
🔍 Key technical highlights:
A confirmed breakout beneath the channel support, accompanied by strong bearish candles, suggests growing seller dominance.
Both the EMA 34 and EMA 89 are now positioned well above the current price, reinforcing a medium-term bearish trend.
A potential short-term pullback to the 0.6240 – 0.6266 area may occur before further downside continuation.
📉 Next downside target: If bearish momentum persists and price fails to reclaim the broken support, the pair is likely to slide toward the marked support at 0.59142.
💬 With the USD gaining strength amid hawkish Fed expectations and the AUD facing domestic economic headwinds, selling the rallies remains the favored strategy in the current environment.

DXY Breakdown: Bearish Momentum Builds Amid Weak U.S. DataThe U.S. Dollar Index (DXY) is maintaining a clear bearish trajectory, with price action on the H4 chart showing a consistent pattern of lower highs and lower lows inside a descending channel. The technical structure points to continued selling pressure, and recent fundamental developments only reinforce this view.
📰 Key drivers behind the decline:
The latest U.S. CPI data came in weaker than expected, signaling easing inflationary pressure and fueling expectations that the Federal Reserve may cut interest rates sooner than anticipated.
A slight uptick in jobless claims has raised concerns that the U.S. labor market may be losing momentum.
Simultaneously, global players like China and Japan are shifting toward more stable monetary policy, prompting capital flows away from the dollar.
📉 From a technical perspective, DXY has broken below the key 100.817 support zone and is now trading around 99.7. Each attempt at a bullish pullback has been short-lived, with sellers regaining control quickly. The green arrows on the chart indicate potential reaction zones, but the descending channel structure remains firmly intact.
Outlook: If the index fails to reclaim the 100.8 – 101.3 resistance area, there’s a high probability of further downside toward the 98.5 – 98.0 support region.
In short, DXY is under pressure both technically and fundamentally, which explains the current bullish momentum in EUR/USD, GBP/USD, and especially gold (XAU/USD).

SOL/USDT – Key Support Test: Will It Hold or Break?#SOL/USDT #Analysis
Description
---------------------------------------------------------------
Solana (SOL) has been in a strong uptrend since late 2023, but recent price action suggests a key test of support around the $115–$135 zone. This level was previously a major resistance and is now being retested as support.
Moving Averages: The price has dipped below the shorter EMAs but is still above the long-term moving average.
Bearish Momentum: The recent sharp drop suggests selling pressure, but the support zone could lead to a reversal.
Two Scenarios:
🔼 Bullish: If the support holds, SOL could bounce back towards $180+ and continue its uptrend.
🔽 Bearish: If support breaks, a deeper correction to $43–$60 is possible.
📊 Trading Strategy
Long Entry: If a strong bounce occurs from the $115–$135 zone, targeting $180+.
Short Entry: A confirmed breakdown below $115 could trigger a move toward $60 or lower.
---------------------------------------------------------------
Enhance, Trade, Grow
---------------------------------------------------------------
Feel free to share your thoughts and insights. Don't forget to like and follow us for more trading ideas and discussions.
Best Regards,
VectorAlgo

MAVIAUSDT VIP Signal № 351 I'd like to share an exciting MAVIA buy trade setup with you, one that comes with a very high probability of success and a solid risk/reward ratio. Based on Elliott Wave theory, we're on the cusp of seeing Wave 3 unfold, and I expect this to drive a fast 35% rise starting today. Get ready for an incredible move!

MOVE BUYhello friends
Considering the failure of our resistance and the strength of the trend, we can enter a buying position.
Capital management should be observed.
Be successful and profitable.

SEI BUY...hello friends
Considering the support range we are in, we expect a short-term growth from this currency.
Be sure to observe capital management.
Be successful and profitable.

BIG positionHello friends
This coin is located in a very, very foggy support area, and by maintaining this support area, you can expect a 50% growth from it up to the previous ceiling, which will be our first target, and we will update the following targets if needed.
Again, note that maintaining this support range is very, very important.
If you like this analysis, give us energy with like and comment.

FTM BUY!Hello friends
After the third encounter with the resistance, this coin was able to break it, and now with the pullback to that resistance, it has become a support, and by maintaining the range, we can expect a step up.
Be successful and profitable.

MINA shopping pointsHello friends
After the heavy fall, this coin has succeeded in making a floor and formed a trading range.
Now, according to its growth, we can wait for a step purchase at the lower points.
Be successful and profitable .

WHAT IS TRUE...Hello friends
This coin is placed in a channel.
Now, according to the rising market, we have two scenarios:
1_ To break the channel from here and go to register new ceilings.
2- You cannot succeed in a channel failure and buy in the lower range that we specified.
There is another mode, according to the rising market, if the channel succeeds in a valid failure, we should buy a pullback.
Be successful and profitable.

Unbelievable profit!!!hello guys
We have come with the introduction of this coin, which we think can grow a lot.
After bottoming in weekly and daily time, this coin gives us this signal that it wants to grow big.
Now, according to the price, we suggest you to buy a step.
Now is the time to buy one step, and in case of modification, we have determined for you that it is suitable for buying two more steps.
The targets have also been specified that we drew for you.
If you like this analysis, please support us with like and comment

<HIGH> FOR BUY!!!Hello friends
This coin has succeeded in turning the trend due to the good flooring it has done.
Now considering that the price is a good place, it increases the value of buying it.
If you like it, we will be happy to support us with likes and comments.

Smart Shoppinghello guys
This coin belongs to PSG club.
After its long-term downward trend and after several attempts to break the resistance in front of it, this coin has now been able to break the resistance and give us signs of the trend turning.
Note that this coin has a lot of potential and considering its price, it makes sense to buy it.
We will be happy if you give us energy with likes and comments.
