GOLD XAUUSD PROFITS Gold has held on to the structure and will continue to follow its trend to the upside for more trades to be taken
Buys

Gold Price Targets 3990 After Support ReboundGold (XAU/USD) is trading around 3966, showing bullish momentum after rebounding from the support zone near 3928. The price is moving within an ascending channel, with a short-term target set at 3990. A breakout above this level could push prices toward the next resistance near 4006.

DigitalOcean: Quiet Cloud Stock with Big PotentialIntroduction
While everyone is focused on AI giants like NVIDIA and the big cloud players, there’s a quieter cloud company quietly gaining momentum.
DigitalOcean (DOCN) may not grab headlines, but its fundamentals and technical setup make it an interesting stock for investors seeking growth in the cloud infrastructure space.
Fundamentals
DigitalOcean’s financials show strong growth:
Revenue: +12–13% year-over-year
EPS: +~80% year-over-year
The company currently has no buyback program, and there’s a slight share dilution, but the growth trajectory more than offsets this.
Key valuation metrics:
Forward P/E: 19
P/S: 4
This places the stock at roughly four times revenue, which is attractive considering its rapid earnings growth.
Overall, from a fundamental perspective, DigitalOcean is healthy — cash flows are improving, profits are up, and the business is in a solid growth phase.
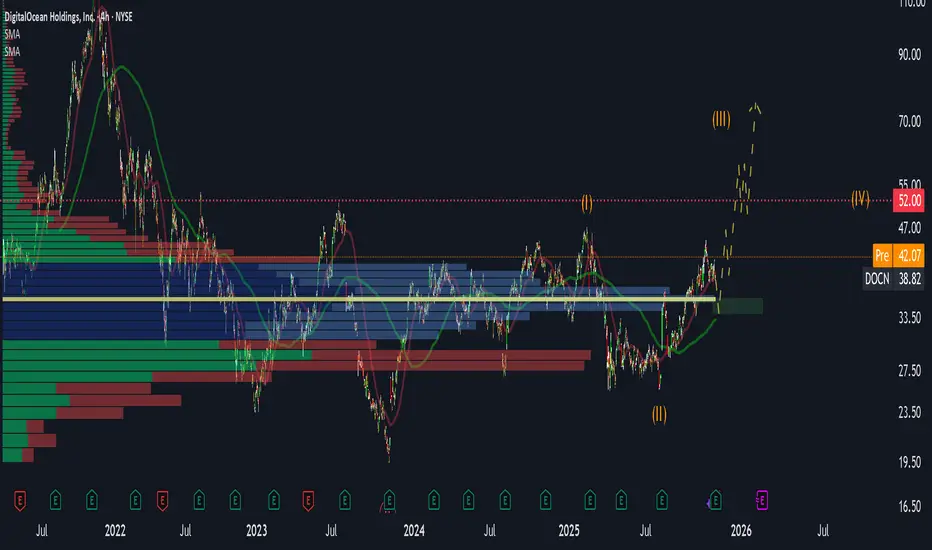
Technical Analysis
On the chart, using a Fixed Range Volume Profile, the largest volume cluster sits around $30–40, suggesting smart money accumulation.
Price has been compressing toward $52, forming a classic wave structure:
First wave, Second wave
Another first, second sequence
This coiling pattern indicates a potential breakout.
Upside target: ~$130 if the $52 resistance is broken
Possible short-term dip: ~$35 to fill an unclosed gap
The technicals suggest a bullish setup for traders looking at momentum and accumulation zones.
Conclusion
DigitalOcean is currently a long-term holding in my portfolio.
The combination of solid fundamentals and bullish technical setup makes it a stock to watch.
If growth continues at the current pace, triple-digit prices are realistic.
Traders can use this setup to watch key levels: $52 for breakout confirmation and $30–40 as a base accumulation zone.
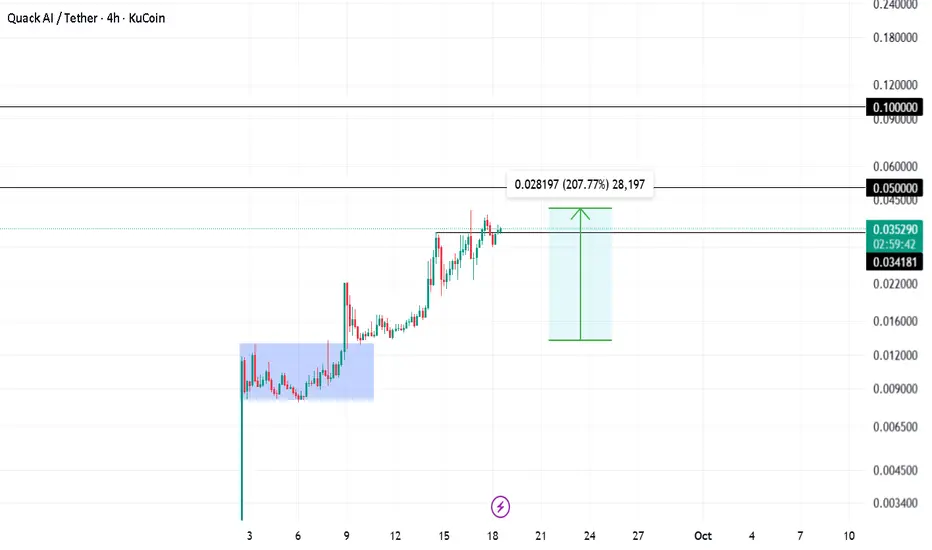
Q Pumped 207% Shared insights on Q trade a while ago. Been holding the trade for a while now and made easy 2x till now.
Hodling for 0.05 and 0.1 targets
Stop loss trailed!
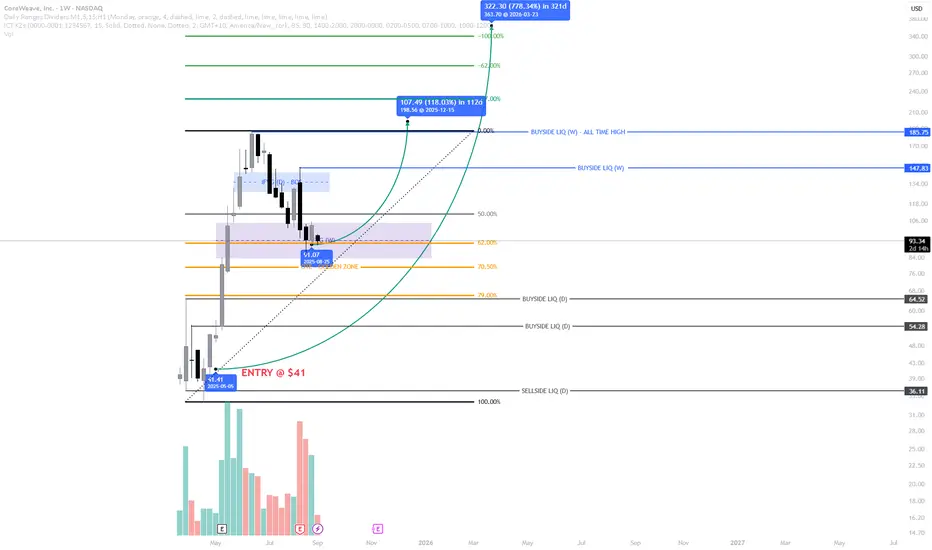
CoreWeave – Golden Zone Setup with FVG ConfluencePrice action on CoreWeave (CRVW) has delivered exactly what high-probability ICT setups are built on. After the strong bullish expansion post-IPO, price retraced cleanly into the golden Fibonacci zone (62%–79%), aligning perfectly with a higher-timeframe Fair Value Gap (FVG).
This retracement holds confluence from multiple PD arrays:
- Golden Zone Respect → Buyers stepped in right at equilibrium levels, where institutional order flow often reloads.
- Weekly FVG → The retracement filled imbalance left on the weekly expansion leg, strengthening the bullish narrative.
- Volume Profile → The drop into this zone occurred on decreasing sell volume, suggesting sellers are exhausted while buyers accumulate.
If price continues to hold above this golden zone/FVG region, the bias remains to the upside with immediate targets at:
- $147 (Weekly Buyside Liquidity)
- $185 (Above Prior Weekly Highs)
- $198–200 (FVG Fill & Structural Target)
Ultimately, a full bullish expansion could send CoreWeave towards $360 (778% projection) in the long term if liquidity pools above are targeted. DYOR.
BUY DXYIn todays session we will be taking buys on the dollar. Our entry is at 97.677 and stops are below 97.480 targets are above 98.40. Use proper risk management.

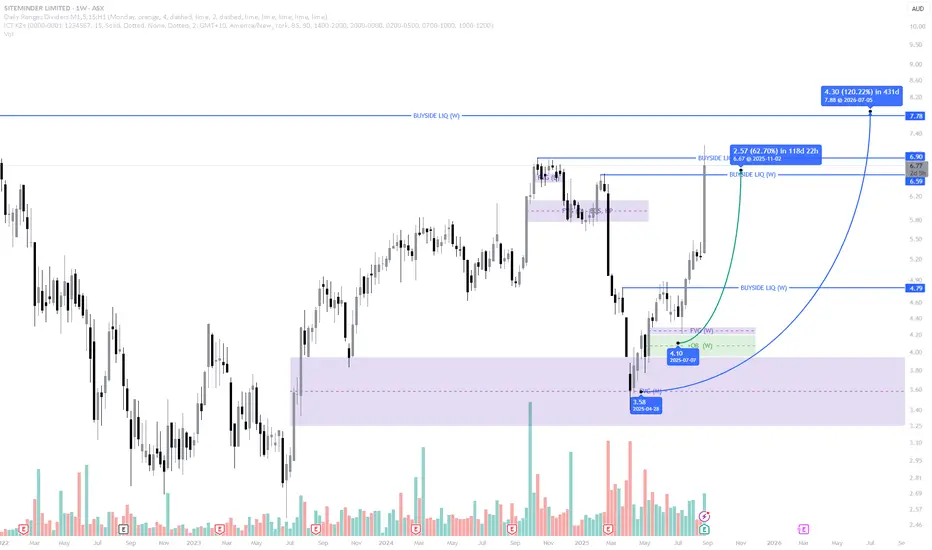
SDR – Textbook Respect of PD Arrays Leading to Explosive UpsideExplanation
The move we anticipated on SDR has now unfolded exactly as outlined, with price reacting strongly from the higher-timeframe PD arrays.
Fair Value Gap (FVG): Price tapped perfectly into the monthly/weekly FVG and used it as a springboard for accumulation. This zone served as the rebalancing point for inefficient pricing.
Order Block (OB): The bullish OB inside the FVG held as expected, providing the structural base for buyers to step in and defend.
Liquidity Dynamics: Prior to the move, sell-side liquidity was swept, clearing weak longs and fuelling the drive higher. Once liquidity was taken, momentum shifted sharply to the upside.
Buyside Targets: Price has now begun its run into the weekly buyside liquidity levels at 6.90 and beyond, with the higher target around 7.78 still in play.
This reaction is a textbook ICT move: sweep → rebalance via FVG → respect of OB → expansion toward buyside.
✅ Key Takeaway: The predictive model played out exactly, proving once again that respecting PD arrays across HTFs provides a high-probability roadmap for price action.
BTCUSD SCALP TRADEBitcoin will be scalping it carefully and as quick as possible and will just wait for a turn over to the upper side
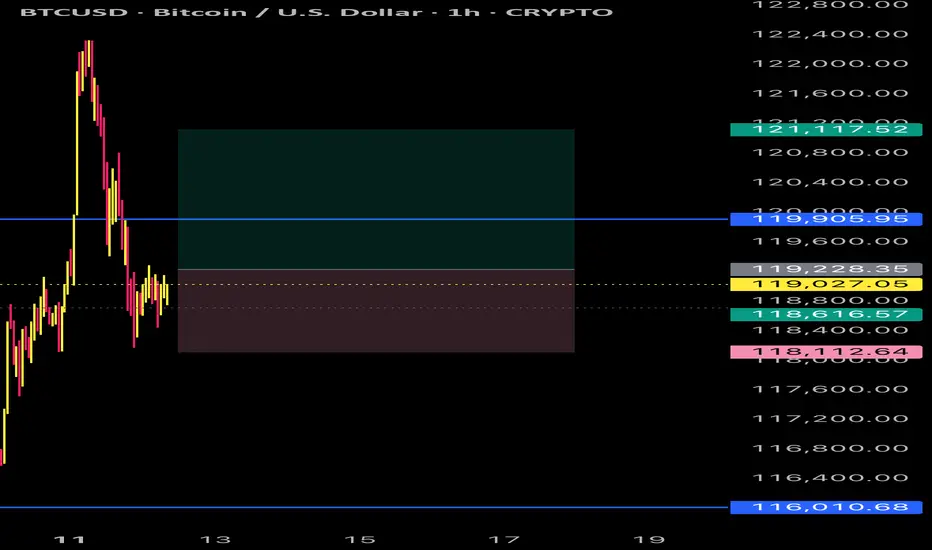
BTCUSD UPDATE Bitcoin has gone up and now I will close partial profits and secure what I have or even swing again to the up side

USDJPY BULLISHUJ closed bullish last week so I’ll continue looking for buys this week. There was a daily double bottom & 50% Retracement on the daily timeframe. I would like for price to either break the H4 resistance, form a HL then look for buys. Or price could retrace and form a HL the I’ll look for buys towards daily resistance @149.190 then my next TP will be 151.00

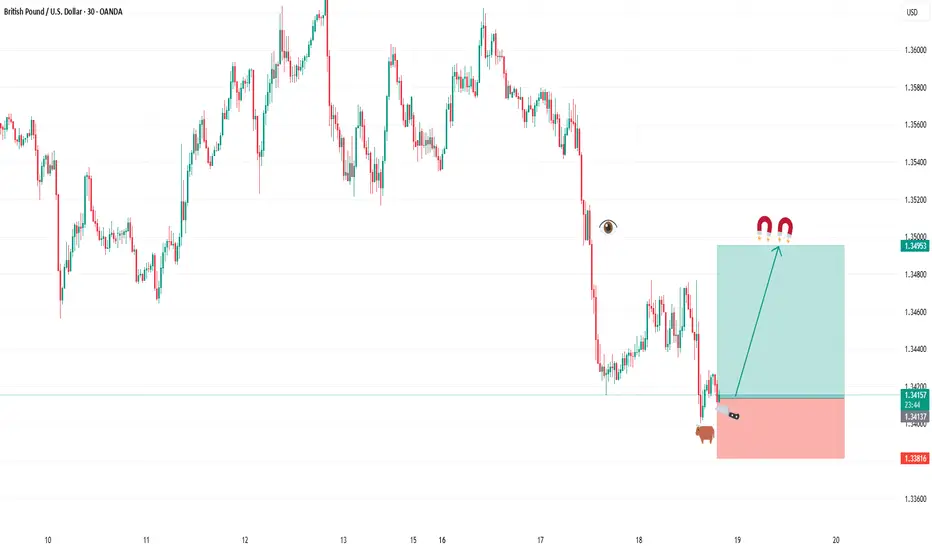
BUY CABLEIn todays session we are monitoring GBPUSD for bullish opportunities. Our buy entry is at 1.34120 and stops are below 1.3380 our target is 1.3500. Use proper risk management and best of luck. Cheers
NAS/NQ 4H Buy IdeaLooking for price to break and retest the current high to continue higher
OR
Looking for price to go back and fill the imbalance left below current price to then continue higher

BUY EURUSDAs we monitor DXY for selling opportunity we will also be focusing on EURUSD for buying opportunities. Our current buy is at 1.12878 and stops below 1.12544 our targets remains 1.13630 and higher. Use proper risk management.

GU buys Price closed bullish on the weekly timeframe. I would like to see GU either retrace to 1.29200 area to continue bullish or break and retest h4 resistance to to push towards 1.34200 area.

EURCHF LONGSEURCHF has been on a bullish run so I'll continue looking for buys as long as price continues to form bullish structure (Higher highs & higher lows). Price is currently at a resistance so I'd wait until price breaks above this resistance before placing any buys.

GBP/USD BUYThis trade is closed now but it is me logging it for anyone and everyone.
This analysis is based on the provided image and should not be considered financial advice. Trading involves risks, and it is essential to conduct your own research and consult with a financial advisor before making any trading decisions.

NAS 100/SPX 500you can see liquidty on both pairs you had a nice sweep and bullish structure and its also been holding. which ever one gets to the zone last is the one i want to buy and also looking at US30 to sweep

GU D B Idea 11/9/24Since price is not breaking the 200 EMA, looking for price to continue bullish and hit the D highs from 9/26/24.

BUY EURUSD In todays session we are monitoring EURUSD for buying opportunities. Entry at 1.01963 stops below 1.01654 and targets above 1.03500 to 1.04500 level. Use proper risk management.

Gold Bullish Scenario .by closing above 2760 .
should be able to break ATH again to keep flying for the next targets as marked on chart .
still need to break ATH first anyway .

Update on Tesla This is my update on Tesla stock.
A huge gap that was created today and looking to not go inside the gap.
Not seeing anything to show why this will continue going up without going back to the first GAP mentioned in the last post. Which was in October.
The GAP is showing a whopping 4% rise.

Gold isn't ready to buy yetI've been trading gold for many years and I can say that I have a pretty good handle gold's behaviors.
While I think many think now might be the right time to buy gold as it is "really low" at least by comparison, I don't think so.
Gold Buys slowly and overtime, big bull spikes while they do occur they typically aren't the catalyst for the actual bull push. You'd typically find bearish spikes as these are the fake move.
What I mean by this is I think gold may continue to sell until it starts to slowly create higher highs and higher lows only to break out slowly after that.
The fact that gold is so bearish currently, it is likely to go up to get rid of these sellers within this orange zone (which I have re-analyzed) to the level I've highlighted (black line) and then drop.
But why am I choosing this line in particular, well I've studied gold for such a long time - I've noticed that it actually likes to play between obvious levels rather than go directly to them.
These are just my thoughts and I wouldn't act on them (for sells) until it actually decides to start going bearish. So even if I am wrong about this, who cares lol

GBPUSD Sustained SellsGU unlike EU is actually a bearish market overall and this makes sells more readily available to me. TBH since shifting over to trading gold almost exclusively I can't stand how much slower forex pairs such as GU and EU move by comparison so it is unlikely that I would trade it even if I do end up seeing something but I will call it out if I feel like it needs to do so.
That being said, GU is currently in consolidation right now after just breaking out of a previous consolidation. When we look at what GU has been doing over the past few weeks it also shows heavy bearish momentum
If you even look at the peak one might even say that price stop hunted high to get rid of sellers who had stops higher, but I'm not quite sure so I won't use that as a confluence within this particular analysis.
This is what I see, price stumbling within the consolidation a bit more and then pushing up to about this level or so to get rid of sellers stops within both the consolidation areas and then drop after that.
My reason for using this particular path is simple. I think the dealer wants to get rid of sellers but he can't drive price so high such that he gives new sellers a better opportunity - if price goes any higher he may give sellers the signal they are looking for to get in which invalidates the dealer's move. If price gets up to the level highlighted by the blue marker sells are probably off the table temporarily.
