GBP/JPY long positions buys all dayStructure zone(purple box) as you can see has been touched multiple times between points 161.521/161.871 and was tested, but acted as a strong support. Can be going for long positions. A lot of pips to be catch ladies an gentlemen
RvR:
Risk.-35 pips
Reward.-126 pips
Buys

XAUUSD XAUUSD OANDA:XAUUSD
gold change in trend. 4hr failed to create a new lower low, expecting a new higher high to be created and ride the trend.

GOLD ON SUPPORT FOR LONGS!Gold on a clear support level to the upside. If the price breaks 1826.81, there is a high probability it will continue towards 1835.

Can we Fill the Clean Range? (GBPUSD)Hi Traders,
GBPUSD has broken a 4-hour resistance level, The current h4 candle has wicked down to come all the way up and break structure, That is a sign of a lot of money being poured into the buys, I do expect the continuation and I would love to see price retest the broken resistance and then go for the highs of 1.2825.
We will, as always, need to see the price close above before even considering the buys, To back up my analysis we also have an inverse head and shoulders.
Happy Trading.
Renaldo Philander

AUD/USD potential buy setupAUDUSD has taken trend line liquidity and had a strong rejection away from support.
Today AUD has had positive news release on employment rate so i'm bullish on this pair possibly targeting the daily supply, which would also take out sell side liquidity.
I'm looking into the 30 minute demand following order flow, If i see accumulation on the lower timeframes ill be looking for potential buy entry.

Bullish USoilUSOIL is bullish…watchOUT…retracement to 0.618 level, then a bullish momentum takes over

XAUUSD bullish ideaLong position for #XAUUSD it is considered a 'safe haven' therefore during times of uncertainty we are going to be seeing in the increase of price of Gold.
****This is not financial advice . Please always carry out your own analysis before trading.****

Possible EU buy when price returns to this areaLooking for price to eventually make it's way back down here for the buy from the 1H, 4H, and D buy OB area. In the same area of the 1H order block there is also a 4H and a Daily order block in the same area and they all intersect. What do you think?

AUD/USD BuysThe higher timeframes indicate a bullish nature on this particular pair
The most recent support regions on the smaller timeframes have successfully held with some consolidation becoming apparent prior to Asian open
Price attempted to break support again and failed. This justified a buy position in the form of a buy stop in order to confirm momentum before entering.
To gauge an early entry (due to the large candle sizes), I used the 15min timeframe.
Targets are set at the previous highs where we have seen low traffic movement
If history is to repeat itself, these previous resistance levels should be achieved again.

NZDCAD Intraday LongsNice H&S pattern formed on Higher low on this bull uptrend... Plenty of bullish momentum and fairly clean Price action!
TRADING IDEA --- NOT TRADING OPPORTUNITY!

EURCAD beautiful reversal looking at EURCAD any time frame 4hr and up, we can see a MASSIVE reversal pattern (falling wedge) and has broken now we wait for retest or around 1.37640 for a solid LONG(BUY) entry or somewhere close to it. Good luck if you take a look at it.

EURAUD looking pretty bullish now We have a beautiful falling wedge pattern that an potentially give us a ton of pips let’s see

AUDCAD, WHICH WAY EVENTUALLY ?From the structure , we notice that the structure , from previous history clearly has touched the dynamic support zone , this hints us that the price action will find its way to the dynamic resistance zone , and rom such bias we start to observe the current price action . that forms higher high and higher lows in this case. which clearly signifies the uptrend.
but on observation the price is currently trapped from the lateral resistance and support .
but here is the catch , we will be willing to hop in the trade once the , price action kicks out of that ranging to look for the target to the next price zone.

GBPUSD , BUYSFrom the outer structure we can clearly see the price , hitting the lateral support zone, this way we see the price action was at the correction phase , we expect an impulse there after .
we are able to observe the impulse and the correction that is trapped in between the support and resistance zone , from the price action we need to find a trend , the trend will be found once the price action breaks the previous higher highs , to focus on the next high value areas.

US30 REVERSAL FROM SELLS TO BUYSAs mentioned in the title, the setup is pretty simple. I found a strong divergence and I entered with the momentum of the London session.
The divergence is confirmed on Both MACD and RSI indicators and the overall structure in the market.
Tell me your thoughts.
Dimitrisbetfx

CADCHFCADCHF currently in a bullish trend
50 and 200 MA crossing
if price touches the blue MA and 50 fib wait for structure to break and indicate a continuation then taking buys

BUY USDCADLoonie is presenting a beautiful opportunity for us to go long. My entry is at a lower price 1.2738 when price gets here then I will go long. My stops at 1.2697 and my targets at 1.2969. Use proper money management. All the best to you all.

Gold XAUUSDThis is my next place i hope price will push into before making its next intra leg up to my target. This is a phenomenal area and if it break much lower than this I will loose confidence that gold will travel to 1824. keep an eye on this.

Gold Buys Updatewell done to anyone that got in on those entries, unfortunately for me i didnt get the second one. I am now using Trading View as a diary of the trades I am taking going into the new year. Had a struggle with the dollar on GU but made back nicely with gold. If anyone is interested in my method and wants to learn just ask!

GBP/CAD BUYSPossible retrace to top of the channel here... might be looking at a structure flip as well

GBPJPY BULLISH VIEW!!!Going long here as seen on the chart.
Will see if we continue to range before a break out, before adding another position.
Looking for previous Highs.

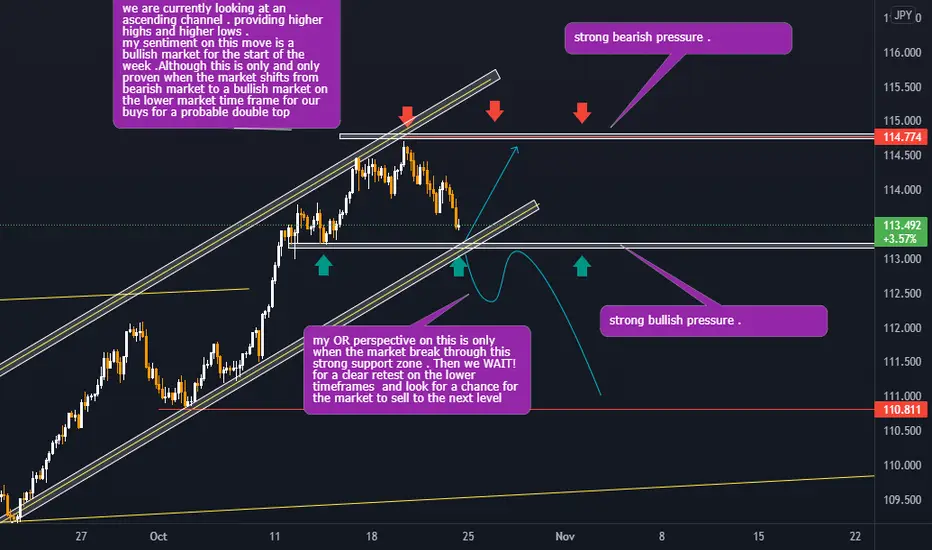
USDJPY . SWEET BUYS!! we are currently looking at an ascending channel . providing higher highs and higher lows .
my sentiment on this move is a bullish market for the start of the week .Although this is only and only proven when the market shifts from bearish market to a bullish market on the lower market time frame for our buys for a probable double top