Sideways movement and stable recovery above 5000GOLDEN INFORMATION:
US Nonfarm Payrolls (NFP) increased by 130,000 in January, above the market consensus of 70,000, according to the Bureau of Labor Statistics on Wednesday. This figure was an improvement over December, which saw a gain of 48,000 after a slight downward revision.
Meanwhile, the Unemployment Rate edged lower to 4.3% in January from 4.4% in December, below the forecast to stay unchanged at 4.4%. The upbeat report provides some relief to concerns about the state of the US labor market, which could lift the US Dollar (USD) and weigh on the USD-denominated commodity price.
⭐️Personal comments NOVA:
Gold prices are stable and the price range is narrowing as they consolidate. Buyers are maintaining a strong position above 5000.
⭐️SET UP GOLD PRICE
🔥SELL GOLD zone: 5138 - 5140 SL 5145
TP1: $5120
TP2: $5100
TP3: $5080
🔥BUY GOLD zone: 4972- 4970 SL 4965
TP1: $4985
TP2: $5000
TP3: $5020
⭐️Technical analysis:
Based on technical indicators EMA 34, EMA89 and support resistance areas to set up a reasonable BUY order.
⭐️NOTE:
Note: Nova wishes traders to manage their capital well
- take the number of lots that match your capital
- Takeprofit equal to 4-6% of capital account
- Stoplose equal to 2-3% of capital account
Buysell

AUR Aurora Innovation Options Ahead of EarningsAnalyzing the options chain and the chart patterns of AUR Aurora Innovation prior to the earnings report this week,
I would consider purchasing the 5usd strike price Calls with
an expiration date of 2026-5-15,
for a premium of approximately $0.55.
If these options prove to be profitable prior to the earnings release, I would sell at least half of them.

Accumulation below 5134 - gold price⭐️GOLDEN INFORMATION:
Gold price (XAU/USD) rises to near $5,035 during the early Asian session on Monday. The precious metal extends its recovery amid a weaker US Dollar (USD) and rising demand from central banks. The delayed release of the US employment report for January will be in the spotlight later on Wednesday.
US Treasury Secretary Scott Bessent on Thursday refused to rule out the possibility of a criminal investigation of Kevin Warsh, President Donald Trump’s nominee for US Federal Reserve (Fed) chair, if Warsh ends up refusing to lower the interest rates. Concerns over the Fed’s independence continue to drag the Greenback lower and provide some support to the USD-denominated commodity price.
⭐️Personal comments NOVA:
Gold prices recovered above 5000, consolidating and stabilizing. Trading below 5141.
⭐️SET UP GOLD PRICE
🔥SELL GOLD zone: 5140 - 5142 SL 5147
TP1: $5125
TP2: $5100
TP3: $5082
🔥BUY GOLD zone: 4834- 4836 SL 4829
TP1: $4850
TP2: $4865
TP3: $4885
⭐️Technical analysis:
Based on technical indicators EMA 34, EMA89 and support resistance areas to set up a reasonable SELL order.
⭐️NOTE:
Note: Nova wishes traders to manage their capital well
- take the number of lots that match your capital
- Takeprofit equal to 4-6% of capital account
- Stoplose equal to 2-3% of capital account

BTC To the moon?Bitcoin (BTC/USD) is currently positioned in a critical demand zone, which I believe represents a strong accumulation area for buyers. This zone has historically acted as a support level where significant buying interest emerges, preventing further downside and setting the stage for upward momentum.
From a technical perspective:
The price is consolidating around this demand area, showing signs of reversal with increasing volume and bullish candlestick patterns.
Key support levels in this zone are holding firm, aligning with Fibonacci retracement levels from the previous bull run.
I anticipate a strong bullish impulse from here, targeting $120,000 as the primary upside objective.
This target is derived from measured moves based on prior wave extensions and resistance projections.
Risk management: Place stops below the demand zone to protect against invalidation.
This is not financial advice; always DYOR.

Correction - Accumulation below 5000⭐️GOLDEN INFORMATION:
Gold (XAU/USD) retreats more than 4% on Monday after the US President Donald Trump announced his pick to lead the Federal Reserve (Fed) in succession to the Fed Chair Jerome Powell. Economic data in the US paint an optimistic outlook as manufacturing activity improves. At the time of writing,XAU/USD trades at $4,681.
XAU/USD sinks below $4,700 as markets reprice a firmer Fed outlook and US manufacturing hits multi-year highs
Since last Friday, Gold price tumbled by over 14%. Although the nomination of Kevin Warsh was seen as one of the catalysts behind the precious metals rout. Economic activity in the manufacturing sector improved the most, reaching levels last seen in 2022, according to the Institute for Supply Management (ISM).
⭐️Personal comments NOVA:
Gold prices continue to consolidate below 5000 - selling pressure cools down the market, leading to greater stability.
⭐️SET UP GOLD PRICE
🔥SELL GOLD zone: 4996 - 4998 SL 5003
TP1: $4980
TP2: $4965
TP3: $4950
🔥BUY GOLD zone: 4400 - 4398 SL 4393
TP1: $4415
TP2: $4444
TP3: $4470
⭐️Technical analysis:
Based on technical indicators EMA 34, EMA89 and support resistance areas to set up a reasonable SELL order.
⭐️NOTE:
Note: Nova wishes traders to manage their capital well
- take the number of lots that match your capital
- Takeprofit equal to 4-6% of capital account
- Stoplose equal to 2-3% of capital account

Prices are constantly rising - 5652⭐️GOLDEN INFORMATION:
Gold price (XAU/USD) surges to a fresh record high of $5,579 before retreating to around $5,500 in early Asian trading on Thursday. The rally of the precious metal is bolstered by strong safe-haven demand amidst persistent geopolitical tensions, economic uncertainty, and a weaker US Dollar (USD).
Geopolitical tensions persisted after US President Donald Trump issued fresh warning to Iran on Wednesday. Trump urged Iran to “come to the table” and negotiate a “fair and equitable deal” that would prohibit the development of nuclear weapons or the next US attack would be far worse. Meanwhile, Iran responded with a threat to strike back against the US, Israel and those who support them.
⭐️Personal comments NOVA:
With tariffs combined with the risk of another US government shutdown, gold continues to show its current overwhelming appeal. The price increase is too sharp.
⭐️SET UP GOLD PRICE:
🔥SELL GOLD zone: 5652 - 5654 SL 5659
TP1: $5640
TP2: $5620
TP3: $5600
🔥BUY GOLD zone: 5402 - 5400 SL 5395
TP1: $5420
TP2: $5440
TP3: $5460
⭐️Technical analysis:
Based on technical indicators EMA 34, EMA89 and support resistance areas to set up a reasonable BUY order.
⭐️NOTE:
Note: Nova wishes traders to manage their capital well
- take the number of lots that match your capital
- Takeprofit equal to 4-6% of capital account
- Stoplose equal to 2-3% of capital account

TSLA Tesla Options Ahead of EarningsIf you missed buying TSLA before the rally:
Now analyzing the options chain and the chart patterns of TSLA Tesla prior to the earnings report this week,
I would consider purchasing the 460usd strike price Calls with
an expiration date of 2026-1-30,
for a premium of approximately $4.40.
If these options prove to be profitable prior to the earnings release, I would sell at least half of them.

NFLX Netflix Options Ahead of EarningsIf you ahven`t sold the top on NFLX:
nor bought the stock before the rally:
With Netflix (NFLX) reporting Q4 2025 earnings today, January 20, 2026, the stock looks primed for a rebound—trading at $88.00, down 91% from its 2021 highs but showing signs of being oversold on the 14-day RSI at around 27 (below 30 threshold, signaling potential buying exhaustion).
Consensus expects 17% revenue growth to $11.97B and 28% EPS jump to $0.55, with FY2025 sales up 15% and positive momentum from ads tier and subscriber gains.
Adding fuel: Netflix's pending $82.7B acquisition of Warner Bros. (from Warner Bros. Discovery spin-off in Q3 2026) could supercharge content library and synergies, boosting long-term growth.
Analyzing the options chain and chart patterns prior to earnings, I would consider a debit call spread:
Buy the $110 strike call and sell the $130 strike call, with expiration August 21, 2026, for a net premium of approximately $2.61.
If the position moves favorably post-earnings (e.g., RSI bounce and positive guidance), I'd scale out half for risk management.
This is a bullish, defined-risk play on NFLX's recovery—DYODD, high volatility expected!

PPI - economic data against the backdrop of gold's ATH.⭐️GOLDEN INFORMATION:
Gold (XAU/USD) rebounds toward the record high of $4,634.64 reached in the previous session, trading around $4,620.00 per troy ounce on Wednesday. Precious metals, including Gold, attract buyers amid growing bets on Federal Reserve (Fed) rate cuts following the softer inflation in the United States (US).
US inflation data for December signaled easing underlying US inflation, strengthening views that price pressures are gradually cooling. Rate futures showed investors divided between expectations of two or three Fed rate cuts this year, well above policymakers’ median projection of one.
⭐️Personal comments NOVA:
The bulls continue their uptrend - consolidating around the ATH price of 4630 and waiting for new highs to be established.
⭐️SET UP GOLD PRICE:
🔥SELL GOLD zone: 4684 - 4686 SL 4691
TP1: $4670
TP2: $4655
TP3: $4630
🔥BUY GOLD zone: 4565 - 4563 SL 4558
TP1: $4580
TP2: $4600
TP3: $4615
⭐️Technical analysis:
Based on technical indicators EMA 34, EMA89 and support resistance areas to set up a reasonable BUY order.
⭐️NOTE:
Note: Nova wishes traders to manage their capital well
- take the number of lots that match your capital
- Takeprofit equal to 4-6% of capital account
- Stoplose equal to 2-3% of capital account

Gold price continues to reach a new all-time high - waiting for ⭐️GOLDEN INFORMATION:
The UK and Germany are reportedly considering boosting their military footprint in Greenland to underscore Europe’s commitment to Arctic security amid heightened geopolitical strains, following last week’s arrest of former Venezuelan President Nicolas Maduro by US forces. Rising global uncertainty continues to underpin demand for traditional safe-haven assets such as Gold.
Meanwhile, a mixed US employment report has reinforced expectations of further Federal Reserve rate cuts, lending additional support to the yellow metal. Lower interest rates reduce the opportunity cost of holding non-yielding assets, keeping Gold well supported.
⭐️Personal comments NOVA:
Gold prices continue to rise - officially reaching a new all-time high. Strong buying pressure continues.
⭐️SET UP GOLD PRICE:
🔥SELL GOLD zone: 4633 - 4635 SL 4640
TP1: $4620
TP2: $4605
TP3: $4590
🔥BUY GOLD zone: 4515 - 4513 SL 4508
TP1: $4530
TP2: $4545
TP3: $4560
⭐️Technical analysis:
Based on technical indicators EMA 34, EMA89 and support resistance areas to set up a reasonable BUY order.
⭐️NOTE:
Note: Nova wishes traders to manage their capital well
- take the number of lots that match your capital
- Takeprofit equal to 4-6% of capital account
- Stoplose equal to 2-3% of capital account

Gold prices recover - awaiting NFP breakout.⭐️GOLDEN INFORMATION:
Gold prices stabilize ahead of the US Nonfarm Payrolls release as firmer labor market data and a stronger US Dollar weigh on the metal. The Greenback is rebounding after employment figures showed a sharp slowdown in job losses in December, while Initial Jobless Claims beat expectations despite a weekly increase. A narrower US trade deficit has further bolstered USD sentiment.
⭐️Personal comments NOVA:
Gold recovered and maintained buying pressure above 4400, awaiting the NFP results today.
⭐️SET UP GOLD PRICE:
🔥SELL GOLD zone: 4518 - 4520 SL 4525
TP1: $4505
TP2: $4490
TP3: $4475
🔥BUY GOLD zone: 4400 - 4398 SL 4393
TP1: $4416
TP2: $4430
TP3: $4445
⭐️Technical analysis:
Based on technical indicators EMA 34, EMA89 and support resistance areas to set up a reasonable SELL order.
⭐️NOTE:
Note: Nova wishes traders to manage their capital well
- take the number of lots that match your capital
- Takeprofit equal to 4-6% of capital account
- Stoplose equal to 2-3% of capital account

Gold is accumulating and increasing in price.⭐️GOLDEN INFORMATION:
The latest FOMC Minutes showed that most Federal Reserve officials favor further rate cuts if inflation continues to ease, though divisions remain over the timing and magnitude. Meanwhile, Fed funds futures imply an roughly 82% probability of a rate hold at the January 27–28 meeting, per CME FedWatch. Expectations of lower rates continue to underpin Gold by reducing the opportunity cost of holding the non-yielding asset.
⭐️Personal comments NOVA:
Gold prices continue their upward trend – amid a weakening DXY and caution regarding risky assets at the start of 2026.
⭐️SET UP GOLD PRICE:
🔥SELL GOLD zone: 4544 - 4546 SL 4551
TP1: $4530
TP2: $4515
TP3: $4500
🔥BUY GOLD zone: 4402 - 4400 SL 4395
TP1: $4415
TP2: $4430
TP3: $4445
⭐️Technical analysis:
Based on technical indicators EMA 34, EMA89 and support resistance areas to set up a reasonable BUY order.
⭐️NOTE:
Note: Nova wishes traders to manage their capital well
- take the number of lots that match your capital
- Takeprofit equal to 4-6% of capital account
- Stoplose equal to 2-3% of capital account

XAUUSD Strong Bull Trend, Watching for Continuation vs Shallow
Timeframes: 4H / 1H (Daily context)
Date: January 6, 2026
Bias: Bullish continuation with intraday consolidation risk
📌 Market Overview
Gold (XAUUSD) remains within a dominant bullish structure, supported by persistent safe-haven demand and strong technical momentum. After an exceptional rally throughout 2025, price is consolidating above the $4,400 region, suggesting acceptance at higher value rather than distribution.
Current price action reflects digestion before the next directional expansion.
📈 Trend & Market Structure
Daily trend: Strong bullish (higher highs / higher lows)
4H structure: Ascending channel remains intact
Recent pullback: Shallow and corrective, followed by a fast reclaim above $4,400
A previously observed 4H bear flag failed, increasing continuation probability
➡️ As long as price holds above the recent higher low, bullish structure remains valid.
📊 Technical Indicators
RSI (14):
Holding around 64–65
Bullish momentum, no bearish divergence
RSI above 55 supports trend continuation
MACD:
Daily MACD remains positive (no bearish cross)
4H MACD has turned upward again after consolidation
Momentum pause, not reversal
Moving Averages:
Price well above 50-day and 200-day MAs
Bullish MA alignment confirms trend strength
20-day MA acting as dynamic intraday support
Bollinger Bands:
Price trading near the upper band
Bands beginning to expand again → volatility expansion likely
No mean-reversion signal yet
Volume / VWAP:
High-volume acceptance around $4,395–$4,405
Price holding above VWAP = buyers in control
Thin volume above $4,440 increases breakout potential
🔑 Key Levels to Watch
Resistance
$4,441 — Immediate resistance / breakout confirmation
$4,475–$4,500 — Next upside expansion zone
Support
$4,403 — Intraday pivot / value area
$4,373 — Key short-term support (recent higher low)
$4,313 — Major structural support (bullish invalidation below)
🧠 Trade Scenarios
Scenario 1 — Bullish Continuation (Preferred)
Bias: Buy strength
Confirmation: Sustained break and hold above $4,441
Expectation: Continuation toward $4,475–$4,500
Rationale: Failed bearish pattern + bullish momentum + strong structure
Scenario 2 — Shallow Pullback (Counter-Trend / Neutral)
Failure near $4,440 combined with loss of $4,395
Retracement toward $4,373 possible
Still corrective unless $4,313 breaks
📌 Technical Conclusion
No topping or distribution signals present
Momentum indicators support continuation
Consolidation above former resistance is constructive
Bias remains bullish while price holds above $4,373

PLCE The Children's Place Options Ahead of EarningsAnalyzing the options chain and the chart patterns of PLCE The Children's Place prior to the earnings report this week,
I would consider purchasing the 8usd strike price Calls with
an expiration date of 2026-1-16,
for a premium of approximately $0.85.
If these options prove to be profitable prior to the earnings release, I would sell at least half of them.

XRP — [2D] WEEK 49 TREND REPORT | 12/05/2025XRP — WEEK 49 TREND REPORT | 12/05/2025
Ticker: BINANCE:XRPUSDT
Timeframe: 2D
This is a reactive structural classification of XRP based on the weekly chart as of this timestamp. Price conditions are evaluated as they stand — nothing here is predictive or forward-assumptive.
⸻
1) Current Trend Condition [ Numbers to Watch ]
Current Price @ 2.03
• Trend Duration @ +22 Days ( Bullish )
• Trend Reversal Level ( Bullish ) @ 2.05
• Trend Reversal Level ( Bullish Confirmation ) @ 2.26
• Correction Retracement @ 2.41
• Structural Support @ 1.64
⸻
2) Structure Health
• Retracement Phase:
Testing Structure (approaching 38.2%)
• Position Status:
Unstable (price below both structural layers)
⸻
3) Temperature :
Cooling Phase
⸻
4) Momentum :
Bearish
⸻
Author’s Note
DOWNWARD STRUCTURAL ALIGNMENT
This mark identifies a moment where the market showed clearer alignment with downside direction. It does not predict future movement, but acknowledges where weakness became more evident within the prevailing structure. Its relevance remains only while price continues to hold beneath key structural boundaries.
⸻
Methodology Overview
This classification framework evaluates directional conditions using internal trend-interpretation logic that references price behavior relative to its structural layers. These relationships are used to identify when price movement aligns with the framework’s criteria for directional phases, transition points, or regime shifts. Visual elements or structural labels reflect these internal interpretations, rather than explicit trading signals or preset indicator crossovers. This framework is observational only and does not imply future outcomes.

BTC — [2D] WEEK 49 TREND REPORT | 12/05/2025BTC — WEEK 49 TREND REPORT | 12/05/2025
Ticker: BINANCE:BTCUSDT
Timeframe: 2D
This is a reactive structural classification of BTC based on the weekly chart as of this timestamp. Price conditions are evaluated as they stand — nothing here is predictive or forward-assumptive.
⸻
1) Current Trend Condition [ Numbers to Watch ]
Current Price @ 89,200
• Trend Duration @ +98 Days ( Bullish )
• Trend Reversal Level ( Bullish ) @ 103,400
• Trend Reversal Level ( Bullishh Confirmation ) @ 103,400
• Pullback Support @ 100,002
• Correction Support @ 79,436
⸻
2) Structure Health
• Retracement Phase:
Correction (approaching 61.8%)
• Position Status:
Unstable (price below both structural layers)
⸻
3) Temperature :
Cooling Phase
⸻
4) Momentum :
Bearish
⸻
Author’s Note
DOWNWARD STRUCTURAL ALIGNMENT
This mark identifies a moment where the market showed clearer alignment with downside direction. It does not predict future movement, but acknowledges where weakness became more evident within the prevailing structure. Its relevance remains only while price continues to hold beneath key structural boundaries.
⸻
Methodology Overview
This classification framework evaluates directional conditions using internal trend-interpretation logic that references price behavior relative to its structural layers. These relationships are used to identify when price movement aligns with the framework’s criteria for directional phases, transition points, or regime shifts. Visual elements or structural labels reflect these internal interpretations, rather than explicit trading signals or preset indicator crossovers. This framework is observational only and does not imply future outcomes.

Accumulated price increase - bulls expect rate cut⭐️GOLDEN INFORMATION:
Expectations of further Fed rate cuts and inflation still above target continue to underpin gold and silver, said David Meger, director of metals trading at High Ridge Futures.
However, China’s physical gold demand has weakened at elevated price levels, which could weigh on the metal. According to the Financial Times, major retail chains have scaled back their presence in mainland China this year, while smaller sellers report that soaring prices and higher taxes have severely hurt sales.
⭐️Personal comments NOVA:
Gold price took H1 4193 breakout liquidity and reacted bullishly, still maintaining the uptrend, continuing to expect December rate cut
⭐️SET UP GOLD PRICE:
🔥SELL GOLD zone: 4274 - 4276 SL 4281
TP1: $4260
TP2: $4245
TP3: $4230
🔥BUY GOLD zone: 4145 - 4143 SL 4138
TP1: $4160
TP2: $4175
TP3: $4190
⭐️Technical analysis:
Based on technical indicators EMA 34, EMA89 and support resistance areas to set up a reasonable BUY order.
⭐️NOTE:
Note: Nova wishes traders to manage their capital well
- take the number of lots that match your capital
- Takeprofit equal to 4-6% of capital account
- Stoplose equal to 2-3% of capital account

PLTR to $150: Overvaluation, AI Hype, Slowing Government Growth If you haven`t bought PLTR at $16:
Palantir has become one of the most crowded trades of the AI boom. While the company is strong fundamentally, the stock price has detached from reality. A move toward $150 (post-split) is not only reasonable — it is structurally likely.
1. Extreme Valuation — PLTR Trades Like a Hyper-Growth AI Leader, But Growth Is Slowing
Palantir’s current valuation assumes:
accelerating revenue growth
massive enterprise AI adoption
long-term dominance in the AI/defense space
But real numbers tell a different story:
government revenue growth has slowed
commercial AI revenue is not scaling as fast as expected
current valuation implies “perfection”
PLTR is priced like Nvidia, but grows closer to a legacy enterprise software company.
That gap must eventually close.
2. Government Contracts Are Growing Much Slower Than Expected
Historically, the Gov segment was Palantir’s growth engine. Now:
U.S. federal agencies face budget constraints
large DoD and DHS contracts are delayed or split among competitors
players like Anduril, C3.ai, and smaller defense tech shops are taking share
geopolitical spending doesn’t translate directly into PLTR revenue
Slowing government growth is a major red flag, because it removes the company’s most stable source of revenue.
3. AI Hype in the Commercial Segment Is Not Converting Into Real Revenue (Yet)
Most of the excitement around PLTR in 2024–2025 comes from:
AIP (Artificial Intelligence Platform)
enterprise copilots
generative AI tools
predictive modeling engines
But the commercial AI pipeline suffers from:
too many POCs (proof-of-concepts)
long implementation timelines (6–24 months)
high customer acquisition costs
conservative corporate spending
The hype is real.
The revenue, not so much.
4. Heavy Insider Selling — A Consistent Bearish Signal
Top insiders have repeatedly sold shares into every major rally:
Alex Karp (CEO)
Shyam Sankar (COO)
multiple VPs and directors
Notice what’s missing:
large insider buying.
Insiders consistently cash out when retail enthusiasm peaks, which historically precedes corrections.
Macro Risk: If AI Capex Slows, PLTR Gets Hit Harder Than NVDA
PLTR is far more sensitive to an AI spending slowdown than hardware leaders like Nvidia, which still enjoy massive chip demand.

BFAGROBUY Call BFAGRO
Trend line breake with volume and bullish news Barkat Frisian Agro Ltd
🚀 Barkat Frisian Agro Ltd (PSX: BFAGRO) – BUY CALL
📣 Bullish Fundamental Update – Fresh Catalyst Alert
Barkat Frisian has officially established its wholly-owned UAE subsidiary in the **Meydan Freezone, Dubai
Because the company is:
Expanding internationally
Increasing exports
Creating a base in UAE (a major business hub)
Seeking higher sales
Strengthening its brand
Enhancing long-term profitability

When will gold continue to rise? 4300?⭐️GOLDEN INFORMATION:
Gold (XAU/USD) advances toward $4,210 during Thursday’s Asian session, hovering near a fresh record high as Fed rate-cut expectations and renewed trade tensions lift safe-haven demand. Traders now await comments from Fed officials, including Michael Barr, Stephen Miran, Christopher Waller, and Michelle Bowman, for policy cues. Earlier this week, Fed Chair Jerome Powell warned that slowing job growth poses a risk to the US economy, reinforcing prospects for two more rate cuts this year—supportive of the non-yielding yellow metal.
⭐️Personal comments NOVA:
The buying power shows no signs of stopping, breaking 4217 and continuing to increase in price. The whole market is very excited and focusing on investing in gold as the safest asset.
⭐️SET UP GOLD PRICE:
🔥SELL GOLD zone: 4275 - 4277 SL 4282
TP1: $4265
TP2: $4250
TP3: $4240
🔥BUY GOLD zone: $4154-$4152 SL $4147
TP1: $4165
TP2: $4180
TP3: $4190
⭐️Technical analysis:
Based on technical indicators EMA 34, EMA89 and support resistance areas to set up a reasonable BUY order.
⭐️NOTE:
Note: Nova wishes traders to manage their capital well
- take the number of lots that match your capital
- Takeprofit equal to 4-6% of capital account
- Stoplose equal to 2-3% of capital account

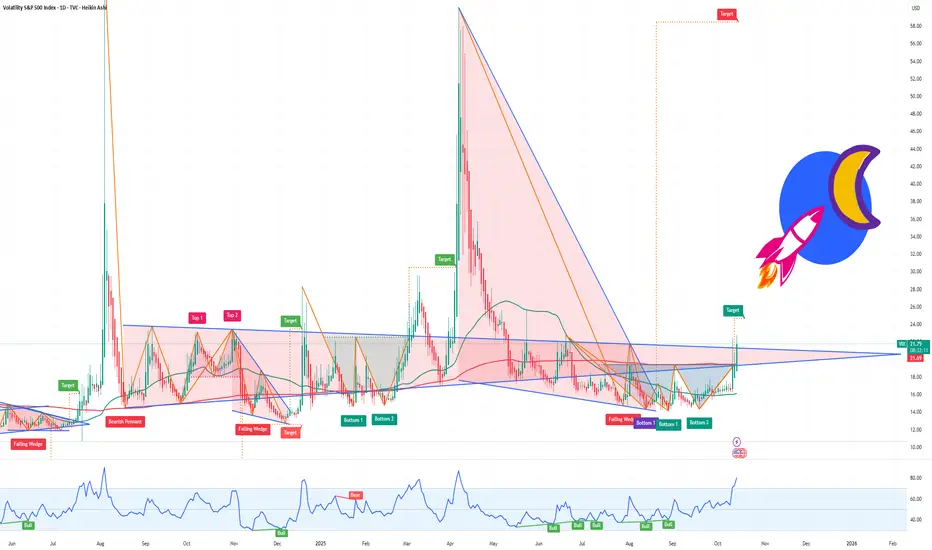
VIX The Calm Before the Next Wave of Volatility! Recession RisksAfter last week’s sharp selloff across equities and crypto, followed by a swift recovery on Monday, many traders are once again lulled into a sense of comfort. But beneath the surface, volatility is quietly building — and the VIX is starting to tell the story.
From Panic to Complacency — Too Fast
Friday’s market crash revealed how fragile sentiment still is. We saw broad-based liquidations, risk-off flows, and a short spike in volatility as traders scrambled for protection. Then, as if nothing happened, Monday brought a sharp rebound — driven by short-covering, dip-buying algos, and a belief that the correction was “overdone.”
Geopolitical Flashpoints: U.S.-China Tensions
The ongoing conflict between the U.S. and China over critical metals exports has intensified. China controls a large portion of rare earth metals, essential for electronics, batteries, and defense technology. Recent U.S. threats to impose sanctions or tariffs on key exports, coupled with potential Chinese retaliatory measures, have created uncertainty for supply chains.
Markets hate uncertainty. Every news cycle mentioning trade escalation acts like a volatility catalyst, as investors hedge against unexpected economic shocks. This alone can drive the VIX higher, even if the S&P 500 has short-term rallies.
Trump Tariff Threats and Market Psychology
Adding fuel to the fire, former President Trump has repeatedly hinted at renewed tariff measures. While the headlines may seem political theater, history shows that even the anticipation of tariffs can disrupt equities and spark short-term volatility spikes.
Friday’s selloff can be partially attributed to traders pricing in these geopolitical and policy risks, which are not reflected in earnings reports or fundamentals — making hedging through VIX-linked products increasingly attractive.
Earnings and Economic Signals
Beyond geopolitics, the earnings season will likely reveal weak spots across sectors. Companies exposed to global supply chains, tech hardware, and industrials may report margins under pressure. This combination — disappointing earnings and global trade uncertainty — often precedes volatility expansions.
Historical patterns show that VIX rises ahead of earnings dispersion and macro shocks, as investors scramble for protection against downside surprises.
Potential upside target: 25+ if earnings disappoint and SPX breaks below $6000
HIMS 1D: time to heal the trend?On the daily chart, Hims & Hers Health is testing a descending trendline, while MA50 and MA200 provide strong support from below. Buyers are clearly in control. The highlighted buy zone sits around $54.40, but the real signal comes only after a confirmed breakout and retest of the trendline.
Technically , the targets are set: first stop at $73.23, then $86.64, and if momentum holds, the extension points to $103.69. That would mark a strong continuation of the bullish move.
From the fundamental side, the company keeps expanding its product portfolio and growing its presence in telehealth — a sector known for resilience even during market turbulence.
The tactical play: wait for the breakout and retest, then ride the bullish wave.
Just don’t confuse HIMS with a real doctor - if you ask for a prescription for profits, all you’ll get is a smile.

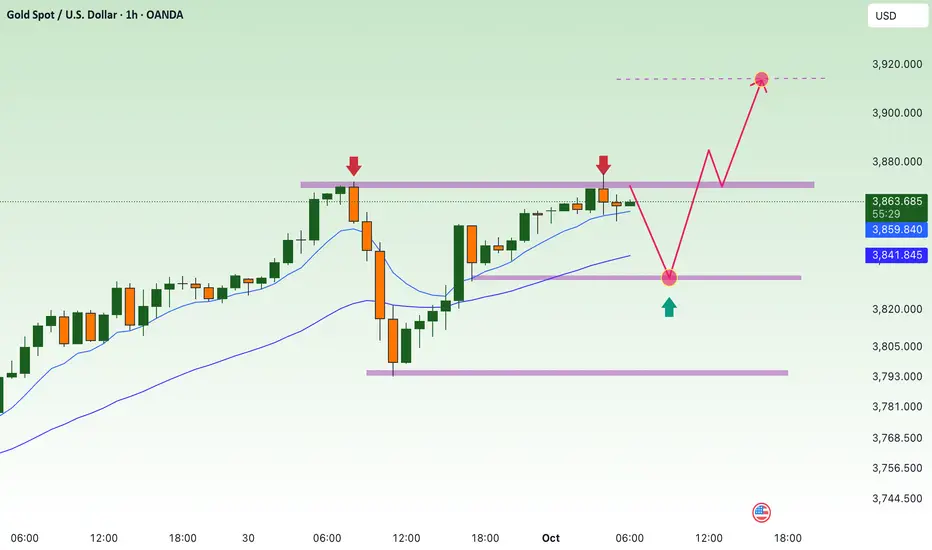
Bulls continue to increase prices, waiting for ATH 3915⭐️GOLDEN INFORMATION:
Markets, via the CME FedWatch Tool, now price in a 97% chance of a Fed rate cut in October and a 76% probability of another in December. Growing bets on easing pressured the US Dollar, making Gold more attractive to overseas buyers. Bullion also drew support from fears of a potential US government shutdown, with Washington gridlocked over funding and the Labor Department warning it would halt key data releases, including Friday’s jobs report, if a shutdown occurs.
⭐️Personal comments NOVA:
Gold price returns, continues to create new ATH 3875 in Asian session. Maintain buying power and continue the uptrend
⭐️SET UP GOLD PRICE:
🔥SELL GOLD zone: 3915- 3917 SL 3922
TP1: $3905
TP2: $3890
TP3: $3880
🔥BUY GOLD zone: $3833-$3831 SL $3826
TP1: $3845
TP2: $3860
TP3: $3870
⭐️Technical analysis:
Based on technical indicators EMA 34, EMA89 and support resistance areas to set up a reasonable BUY order.
⭐️NOTE:
Note: Nova wishes traders to manage their capital well
- take the number of lots that match your capital
- Takeprofit equal to 4-6% of capital account
- Stoplose equal to 2-3% of capital account