Bullish bounce off key support?EUR/CAD is falling towards the pivot, which has been identified as an overlap support that aligns with the 61.8% Fibonacci retracement and could bounce to the 1st resistance.
Pivot: 1.61331
1st Support: 1.60705
1st Resistance: 1.62262
Disclaimer:
The opinions given above constitute general market commentary and do not constitute the opinion or advice of IC Markets or any form of personal or investment advice.
Any opinions, news, research, analyses, prices, other information, or links to third-party sites contained on this website are provided on an "as-is" basis, are intended to be informative only, and are not advice, a recommendation, research, a record of our trading prices, an offer of, or solicitation for, a transaction in any financial instrument and thus should not be treated as such. The information provided does not involve any specific investment objectives, financial situation, or needs of any specific person who may receive it. Please be aware that past performance is not a reliable indicator of future performance and/or results. Past performance or forward-looking scenarios based upon the reasonable beliefs of the third-party provider are not a guarantee of future performance. Actual results may differ materially from those anticipated in forward-looking or past performance statements. IC Markets makes no representation or warranty and assumes no liability as to the accuracy or completeness of the information provided, nor any loss arising from any investment based on a recommendation, forecast, or any information supplied by any third party
CAD

Loonie H4 | Potential Bearish ReversalThe price has rejected our sell entry level at 1.3906, which is an overlap resistance.
Our stop loss is set at 1.3944, which is a pullback resistance that aligns with the 61.8% FIbonacci retracement.
Our take profit is set at 1.3824, which is a pullback support that aligns with the 38.2% Fibonacci retracement.
High Risk Investment Warning
Stratos Markets Limited (

Falling towards 38.2% Fib support?Loonie (USD/CAD) is falling towards the pivot, which aligns with the 38.2% Fibonacci retracement and could bounce to the 1st resistance.
Pivot: 1.3810
1st Support: 1.3748
1st Resistance: 1.3975
Disclaimer:
The opinions given above constitute general market commentary and do not constitute the opinion or advice of IC Markets or any form of personal or investment advice.
Any opinions, news, research, analyses, prices, other information, or links to third-party sites contained on this website are provided on an "as-is" basis, are intended to be informative only, and are not advice, a recommendation, research, a record of our trading prices, an offer of, or solicitation for, a transaction in any financial instrument and thus should not be treated as such. The information provided does not involve any specific investment objectives, financial situation, or needs of any specific person who may receive it. Please be aware that past performance is not a reliable indicator of future performance and/or results. Past performance or forward-looking scenarios based upon the reasonable beliefs of the third-party provider are not a guarantee of future performance. Actual results may differ materially from those anticipated in forward-looking or past performance statements. IC Markets makes no representation or warranty and assumes no liability as to the accuracy or completeness of the information provided, nor any loss arising from any investment based on a recommendation, forecast, or any information supplied by any third party

Bullish bounce off key level?EUR/CAD is falling towards the pivot, which has been identified as an overlap support that lines up with the 50% Fibonacci retracement and could bounce to the 1st resistance.
Pivot: 1.61331
1st Support: 1.60705
1st Resistance: 1.62262
Disclaimer:
The opinions given above constitute general market commentary and do not constitute the opinion or advice of IC Markets or any form of personal or investment advice.
Any opinions, news, research, analyses, prices, other information, or links to third-party sites contained on this website are provided on an "as-is" basis, are intended to be informative only, and are not advice, a recommendation, research, a record of our trading prices, an offer of, or solicitation for, a transaction in any financial instrument and thus should not be treated as such. The information provided does not involve any specific investment objectives, financial situation, or needs of any specific person who may receive it. Please be aware that past performance is not a reliable indicator of future performance and/or results. Past performance or forward-looking scenarios based upon the reasonable beliefs of the third-party provider are not a guarantee of future performance. Actual results may differ materially from those anticipated in forward-looking or past performance statements. IC Markets makes no representation or warranty and assumes no liability as to the accuracy or completeness of the information provided, nor any loss arising from any investment based on a recommendation, forecast, or any information supplied by any third party

Bullish bounce?CAD/JPY is falling towards the pivot, which serves as pullback support and could bounce back to the 1st resistance.
Pivot: 113.53
1st Support: 112.96
1st Resistance: 114.52
Disclaimer:
The opinions given above constitute general market commentary and do not constitute the opinion or advice of IC Markets or any form of personal or investment advice.
Any opinions, news, research, analyses, prices, other information, or links to third-party sites contained on this website are provided on an "as-is" basis, are intended to be informative only, and are not advice, a recommendation, research, a record of our trading prices, an offer of, or solicitation for, a transaction in any financial instrument and thus should not be treated as such. The information provided does not involve any specific investment objectives, financial situation, or needs of any specific person who may receive it. Please be aware that past performance is not a reliable indicator of future performance and/or results. Past performance or forward-looking scenarios based upon the reasonable beliefs of the third-party provider are not a guarantee of future performance. Actual results may differ materially from those anticipated in forward-looking or past performance statements. IC Markets makes no representation or warranty and assumes no liability as to the accuracy or completeness of the information provided, nor any loss arising from any investment based on a recommendation, forecast, or any information supplied by any third party

Bearish reversal off pullback resistance?NZD/CAD is rising towards the pivot, which acts as a pullback resistance and could reverse to the 1st support.
Pivot: 0.79988
1st Support: 0.78174
1st Resistance: 0.80291
Disclaimer:
The opinions given above constitute general market commentary and do not constitute the opinion or advice of IC Markets or any form of personal or investment advice.
Any opinions, news, research, analyses, prices, other information, or links to third-party sites contained on this website are provided on an "as-is" basis, are intended to be informative only, and are not advice, a recommendation, research, a record of our trading prices, an offer of, or solicitation for, a transaction in any financial instrument and thus should not be treated as such. The information provided does not involve any specific investment objectives, financial situation, or needs of any specific person who may receive it. Please be aware that past performance is not a reliable indicator of future performance and/or results. Past performance or forward-looking scenarios based upon the reasonable beliefs of the third-party provider are not a guarantee of future performance. Actual results may differ materially from those anticipated in forward-looking or past performance statements. IC Markets makes no representation or warranty and assumes no liability as to the accuracy or completeness of the information provided, nor any loss arising from any investment based on a recommendation, forecast, or any information supplied by any third party

CADJPY ShortHi Traders, I have analysed this pair and from my point of view the channel has been broken. Taking in account that yen for long time has been weak, perhaps is the time to show up a little retracement of strength. The latest high is not acting as a resistance, so i expect the price to plunge for this pair.

GBPCAD H1 | Bullish Momentum To ExtendBased on the H1 chart analysis, we could see the price fall to tour buy entry level at 1.8644, which is a pullback support that aligns with the 50% Fibonacci retracement.
Our stop loss is set at 1.8605, which is a pullback support.
Our take profit is set at 1.8703, which is a multi swing high resistance.
High Risk Investment Warning
Stratos Markets Limited (


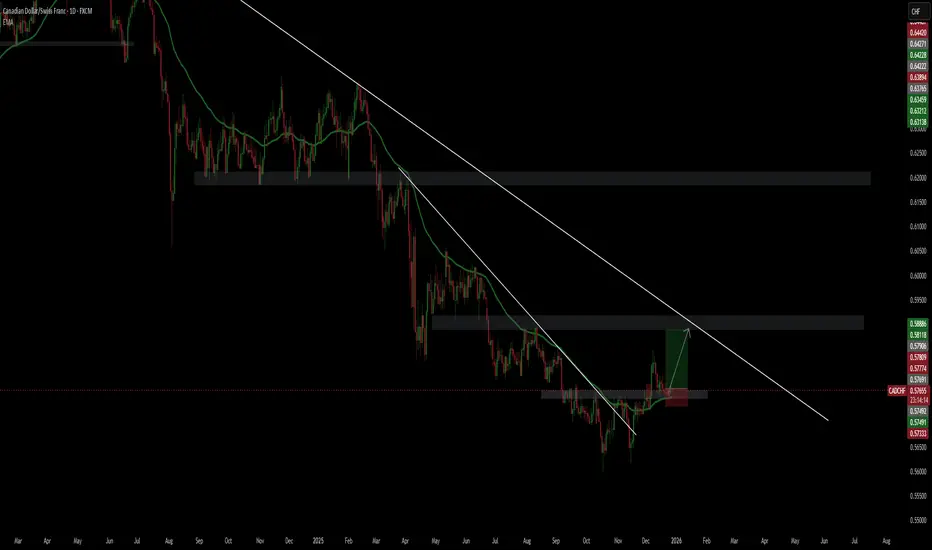
CADCHF LONG SCENARIO Here I'm using a slightly different approach.
So I'm using a 1:3+ RR and not the usual 1:1, because this is kinda different setup and here I'm combining the breakout of the minor resistance zone, which is now a support zone + the breakout of Daily 50 EMA + the breakout of the internal descending trend line (DTL).
Now is retesting all of these 3 indicators with SL not so far below and TP is the Weekly 50 EMA + minor zone + touch of the bigger weekly DTL (I'll put screenshot of the Weekly chart).
!!!- I already have an open trade from 22.12 from around this level here and I'm using only 0.4 risk for this trade, because it's a bit different from my strategy, but I like how the setup looks and everything is adding up perfectly + it's a clean setup.
USDCAD Breakout and Potential RetraceHey Traders, in today's trading session we are monitoring USDCAD for a selling opportunity around 1.38900 zone, USDCAD was trading in an uptrend and successfully managed to break it out. Currently is in a correction phase in which it is approaching the retrace area at 1.38900 support and resistance zone.
Trade safe, Joe.

GBPCAD NEXT LEG UP LONG CONTINUATIONIdea linked to last GBPCAD trade idea expecting the pair to trade into my second take profit target at 1.8750

eurcad looking good for upside continuationoverall in strong uptrend, and now getting ready for upside continuation after long consolidation, testing multiple indicators with trendline and crucial horizontal area, daily close above trendline can open doors for 200 pips bullish wave

Bearish reversal setup?Loonie (USD/CAD) is rising towards the pivot, which is a pullback resistance that aligns with the 61.8% Fibonacci retracement and could reverse to the 1st support.
Pivot: 1.3933
1st Support: 1.3796
1st Resistance: 1.4060
Disclaimer:
The opinions given above constitute general market commentary and do not constitute the opinion or advice of IC Markets or any form of personal or investment advice.
Any opinions, news, research, analyses, prices, other information, or links to third-party sites contained on this website are provided on an "as-is" basis, are intended to be informative only, and are not advice, a recommendation, research, a record of our trading prices, an offer of, or solicitation for, a transaction in any financial instrument and thus should not be treated as such. The information provided does not involve any specific investment objectives, financial situation, or needs of any specific person who may receive it. Please be aware that past performance is not a reliable indicator of future performance and/or results. Past performance or forward-looking scenarios based upon the reasonable beliefs of the third-party provider are not a guarantee of future performance. Actual results may differ materially from those anticipated in forward-looking or past performance statements. IC Markets makes no representation or warranty and assumes no liability as to the accuracy or completeness of the information provided, nor any loss arising from any investment based on a recommendation, forecast, or any information supplied by any third party

USD/CAD - Bullish Pennant Loading (09.01.2026)📝 Description 🔍 Setup (Technical Structure) FX:USDCAD
USD/CAD is forming a classic Bullish Pennant pattern after a strong impulsive move up (flagpole). Price is consolidating with higher lows, respecting short-term EMA support and holding above the Ichimoku cloud — a sign of healthy bullish continuation.
Key confirmations:
Strong bullish flagpole
Tight consolidation (pennant structure)
Price holding above EMA & cloud
No major bearish rejection yet
📍 Support & Resistance
🔴 Key Support: Pennant base / EMA zone
🟢 1st Resistance: 1.3911
🟢 2nd Resistance / Target: 1.3935
🎯 Measured Move Target: Based on flagpole height projection
#USDCAD #ForexTrading #BullishPennant #PriceAction #TrendContinuation #SupportResistance #TradingView #Kabhi_TA_Trading
⚠️ Disclaimer
This analysis is for educational purposes only.
Forex trading involves risk — always use proper risk management and stop-loss.
💬 Support the Analysis👍 Like if you see the bullish continuation
💬 Comment: Breakout or Fakeout? 🔁 Share with traders watching USD/CAD

USDCAD H4 | Bearish Reversal Off 50% Fib ResistanceBased on the H4 chart analysis, we can see that the price has rejected off our sell entry level at 1.3887, which is a pullback resistance that aligns with the 50% Fibonacci retracement and the 78.6% Fibonacci projection.
Our stop loss is set at 1.3933, which is a pullback resistance that aligns with the 61.8% Fibonacci retracement.
Our take profit is set at 1.3809, which is a pullback support.
High Risk Investment Warning
Stratos Markets Limited (

Bullish bounce setup?NZD/CAD is falling towards the pivot, which is slightly above the 61.8% Fibonacci retracement, and could bounce to the 1st resistance.
Pivot: 0.79333
1st Support: 0.78954
1st Resistance: 0.79992
Disclaimer:
The opinions given above constitute general market commentary and do not constitute the opinion or advice of IC Markets or any form of personal or investment advice.
Any opinions, news, research, analyses, prices, other information, or links to third-party sites contained on this website are provided on an "as-is" basis, are intended to be informative only, and are not advice, a recommendation, research, a record of our trading prices, an offer of, or solicitation for, a transaction in any financial instrument and thus should not be treated as such. The information provided does not involve any specific investment objectives, financial situation, or needs of any specific person who may receive it. Please be aware that past performance is not a reliable indicator of future performance and/or results. Past performance or forward-looking scenarios based upon the reasonable beliefs of the third-party provider are not a guarantee of future performance. Actual results may differ materially from those anticipated in forward-looking or past performance statements. IC Markets makes no representation or warranty and assumes no liability as to the accuracy or completeness of the information provided, nor any loss arising from any investment based on a recommendation, forecast, or any information supplied by any third party

Bearish reversal off 50% Fib resistance?USD/CAD is rising towards the resistance level, which is a pullback resistance that aligns with the 50% Fibonacci retracement and could reverse from this level to our take profit.
Entry: 1.3896
Why we like it:
There is a pullback resistance level that aligns with the 50% Fibonacci retracement.
Stop loss: 1.3977
Why we like it:
There is a pullback resistance level.
Take profit: 1.3799
Why we like it:
There is a pullback support that aligns with the 38.2% Fibonacci retracement.
Enjoying your TradingView experience? Review us!
Please be advised that the information presented on TradingView is provided to Vantage (‘Vantage Global Limited’, ‘we’) by a third-party provider (‘Everest Fortune Group’). Please be reminded that you are solely responsible for the trading decisions on your account. There is a very high degree of risk involved in trading. Any information and/or content is intended entirely for research, educational and informational purposes only and does not constitute investment or consultation advice or investment strategy. The information is not tailored to the investment needs of any specific person and therefore does not involve a consideration of any of the investment objectives, financial situation or needs of any viewer that may receive it. Kindly also note that past performance is not a reliable indicator of future results. Actual results may differ materially from those anticipated in forward-looking or past performance statements. We assume no liability as to the accuracy or completeness of any of the information and/or content provided herein and the Company cannot be held responsible for any omission, mistake nor for any loss or damage including without limitation to any loss of profit which may arise from reliance on any information supplied by Everest Fortune Group.

USD/CAD Comes Back to LifeComing into 2025 it seemed like USD bulls had full control of the FX market, but the Dollar set a high less than two weeks into the New Year and then weakness remained for pretty much the rest of the year. Of course, much of that weakness was confined the first-half of 2025, but another bearish run in December made it really easy to come into 2026 as a USD bear and so far in the New Year we've seen bullish price action in the DXY.
This puts a lot of focus into U.S. data with tomorrow's Non-farm Payrolls report and then inflation reports to be released thereafter, and what we're seeing now could simply be a degree of squaring up ahead of some big risk events, but in the USD/CAD pair, a strong sell-off has since led to a sizable rally with the pair continuing to show gains.
Notably, it was the oversold reading on the daily chart in late 2025 trade that led into the move and the question now is whether there's the making of a trend in here. Price is already testing a spot of resistance just inside of the 1.3900 handle and the 1.4000 level is a massive spot, if it does come into play. So chasing from here can be challenging, but, there's now bullish structure that can be worked with down to an upward-sloping trendline that's developed in the early stages of the rally.
I'm tracking supports at 1.3836, 1.3800 and then the zone from 1.3743-1.3750 as an 's3' of sorts. If sellers can elicit a closed body break below 's3' it's going to look like the rally is done for but, until that scenario, there's bullish potential for a re-test of the 1.4000 handle.
If 1.4000 trades before any of those supports come into play, then current resistance becomes the new 's1' area of support and that spans from 1.3889-1.3905. - js

Potential bullish rise?Loonie (USD/CAD) has bounced off the pivot and could rise to the overlap resistance.
Pivot: 1.3810
1st Support: 1.3748
1st Resistance: 1.3975
Disclaimer:
The opinions given above constitute general market commentary and do not constitute the opinion or advice of IC Markets or any form of personal or investment advice.
Any opinions, news, research, analyses, prices, other information, or links to third-party sites contained on this website are provided on an "as-is" basis, are intended to be informative only, and are not advice, a recommendation, research, a record of our trading prices, an offer of, or solicitation for, a transaction in any financial instrument and thus should not be treated as such. The information provided does not involve any specific investment objectives, financial situation, or needs of any specific person who may receive it. Please be aware that past performance is not a reliable indicator of future performance and/or results. Past performance or forward-looking scenarios based upon the reasonable beliefs of the third-party provider are not a guarantee of future performance. Actual results may differ materially from those anticipated in forward-looking or past performance statements. IC Markets makes no representation or warranty and assumes no liability as to the accuracy or completeness of the information provided, nor any loss arising from any investment based on a recommendation, forecast, or any information supplied by any third party

Bullish bounce off?EUR/CAD is reacting off the support level, which is an overlap support and could bounce from this level to our target profit.
Entry: 1.61336
Why we like it:
There is an overlap support level.
Stop loss: 1.60715
Why we like it:
There is a pullback support level.
Take profit: 1.62322
Why we like it:
There is a pullback resistance level.
Enjoying your TradingView experience? Review us!
Please be advised that the information presented on TradingView is provided to Vantage (‘Vantage Global Limited’, ‘we’) by a third-party provider (‘Everest Fortune Group’). Please be reminded that you are solely responsible for the trading decisions on your account. There is a very high degree of risk involved in trading. Any information and/or content is intended entirely for research, educational and informational purposes only and does not constitute investment or consultation advice or investment strategy. The information is not tailored to the investment needs of any specific person and therefore does not involve a consideration of any of the investment objectives, financial situation or needs of any viewer that may receive it. Kindly also note that past performance is not a reliable indicator of future results. Actual results may differ materially from those anticipated in forward-looking or past performance statements. We assume no liability as to the accuracy or completeness of any of the information and/or content provided herein and the Company cannot be held responsible for any omission, mistake nor for any loss or damage including without limitation to any loss of profit which may arise from reliance on any information supplied by Everest Fortune Group.

Bullish momentum to extend?AUD/CAD is falling towards the support level, which is a pullback support that aligns with the 38.2% Fibonacci retracement and could bounce from this level to our take profit.
Entry: 0.9246
Why we like it:
There is a pullback support level that aligns with the 38.2% Fibonacci retracement.
Stop loss: 0.91956
Why we like it:
There is a pullback support that is slightly above the 61.8% Fibonacci retracement.
Take profit: 0.93287
Why we like it:
There is a swing high resistance level.
Enjoying your TradingView experience? Review us!
Please be advised that the information presented on TradingView is provided to Vantage (‘Vantage Global Limited’, ‘we’) by a third-party provider (‘Everest Fortune Group’). Please be reminded that you are solely responsible for the trading decisions on your account. There is a very high degree of risk involved in trading. Any information and/or content is intended entirely for research, educational and informational purposes only and does not constitute investment or consultation advice or investment strategy. The information is not tailored to the investment needs of any specific person and therefore does not involve a consideration of any of the investment objectives, financial situation or needs of any viewer that may receive it. Kindly also note that past performance is not a reliable indicator of future results. Actual results may differ materially from those anticipated in forward-looking or past performance statements. We assume no liability as to the accuracy or completeness of any of the information and/or content provided herein and the Company cannot be held responsible for any omission, mistake nor for any loss or damage including without limitation to any loss of profit which may arise from reliance on any information supplied by Everest Fortune Group.

Bullidh momentum to extend?GBP/CAD could fall towards the pivot which acts as a pullback support that is slightly above the 50% Fibonacci retracement and could bounce to the 1st resistance.
Pivot: 1.8546
1st Support: 1.8442
1st Resistance: 1.8750
Disclaimer:
The opinions given above constitute general market commentary and do not constitute the opinion or advice of IC Markets or any form of personal or investment advice.
Any opinions, news, research, analyses, prices, other information, or links to third-party sites contained on this website are provided on an "as-is" basis, are intended to be informative only, and are not advice, a recommendation, research, a record of our trading prices, an offer of, or solicitation for, a transaction in any financial instrument and thus should not be treated as such. The information provided does not involve any specific investment objectives, financial situation, or needs of any specific person who may receive it. Please be aware that past performance is not a reliable indicator of future performance and/or results. Past performance or forward-looking scenarios based upon the reasonable beliefs of the third-party provider are not a guarantee of future performance. Actual results may differ materially from those anticipated in forward-looking or past performance statements. IC Markets makes no representation or warranty and assumes no liability as to the accuracy or completeness of the information provided, nor any loss arising from any investment based on a recommendation, forecast, or any information supplied by any third party
