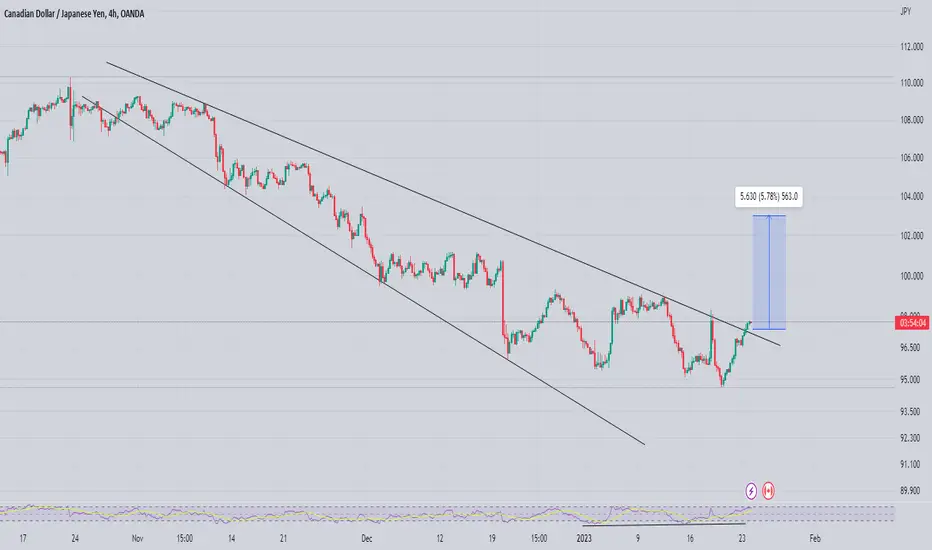
CADJPY: Looking to retest ascending trendline & order blockPrice Action is suggesting that CADJPY will continue it's move up to again retest the ascending dynamic trendline that it's been bouncing around since the end of last year.
Looking at CADWCU and JPYWCU, CAD is looking bullish to me with a pinbar on the 1D time-frame, JPYWCU on the other hand has broken an ascending trendline (1D) to the downside and has just posted a bearish engulfing candle.
I'm positive about JPY long-term because of the way they've handled their economy, limiting inflation without interest rate hikes, and maximising exports (due to the low currency value). We're just not yet seeing the impact of this, due to the higher interest rates that can be earned with other currencies.
I'm looking to get in long when I see confirmation on the LTF's, this may mean CADJPY could drop a little with an initial retracement (maybe down to 97.2), this would of course generate a better RR.
Cad-jpy

CADJPY H4: Bearish outlook seen, further downside below 97.80On the H4 time frame, prices are facing bearish pressure from the resistance zone at 97.80, in line with the 78.6% Fibonacci retracement and 61.8% Fibonacci extension. A pullback to this zone presents an opportunity to play the drop to the support zone at 94.80, in line with the graphical low. Stochastic is approaching the resistance at 86.37 as well.

Cadjpy Descending Broadening Wedge Has Already Done while Rsi Printed Bulish Divergence
Expecting 400 to 500 Pips Bulish move
CADJPY - Trend-Following Buy Setup!Hello TradingView Family / Fellow Traders. This is Richard, as known as theSignalyst.
🗒 CADJPY has been overall bullish trading above the blue trendline acting as a non-horizontal support.
Moreover, the zone 91.5 - 93.0 is a strong support zone .
📌 So the highlighted purple circle is a strong area to look for buy setups as it is the intersection of the green support zone and trendline in blue.
📉 As per my trading style:
As CADJPY approaches the lower purple circle zone, I will be looking for bullish reversal setups (like a double bottom pattern, trendline break , and so on...)
Always follow your trading plan regarding entry, risk management, and trade management.
Good luck!
All Strategies Are Good; If Managed Properly!
~Rich

CADJPY 1D Death Cross but bullish divergence short-termThe CADJPY pair has gone a long way since we caught the perfect sell at the top on our September 20 2022 idea as it hit our 1W MA50 target:
The price broke even lower and touched the bottom of the Channel and the Higher Lows trend-line that started on the March 09 2020 Low, and has since been rebounding. As we mentioned on our last analysis, we can expect a sustainable rise only if the RSI breaks above its Lower Highs trend-line.
On the long-term the 1D Death Cross formed on December 27, confirms that the trend switched to bearish but on the short-term the 1D RSI Higher Lows since December 05 being a bullish divergence against the Lower Lows of the price, favors a rebound not just to the 1D MA50 (blue trend-line) but also the 1D MA200 (orange trend-line), but again we need the RSI Lower Highs break-out confirmation.
If however the pair breaks below the 1W MA100 (red trend-line) earlier, we will resume selling, targeting the 0.5 and 0.618 Fibonacci retracement levels in succession.
-------------------------------------------------------------------------------
** Please LIKE 👍, FOLLOW ✅, SHARE 🙌 and COMMENT ✍ if you enjoy this idea! Also share your ideas and charts in the comments section below! This is best way to keep it relevant, support me, keep the content here free and allow the idea to reach as many people as possible. **
-------------------------------------------------------------------------------
You may also TELL ME 🙋♀️🙋♂️ in the comments section which symbol you want me to analyze next and on which time-frame. The one with the most posts will be published tomorrow! 👏🎁
-------------------------------------------------------------------------------
💸💸💸💸💸💸
👇 👇 👇 👇 👇 👇

CADJPY ANALYSIS!top down analysis, just my thoughts on this pair starting with my monthly down to the 1hr, entry on bearish engulfing heavy wick rejection to the upside. bearish on cadjpy potential to a monthly low. confluence aligns with heavy wick rejection, fibs lined with 38% bearish engulfing, the overall trend is bearish only looking to take sells. moving average cross on lower time frame for a better entry

CADJPY, still waiting, around 150 pipsRecently, the price has been moving in the designated channel (red lines). I am waiting for a support or resistance breakout.
This will be a buy or sell sign.
Beware of false breakouts.
TP around 102.60 (if long) or 98.00 (if short).
Around 150 pips in both cases.
GG
P.S.
This is of course not financial advice, just my idea.

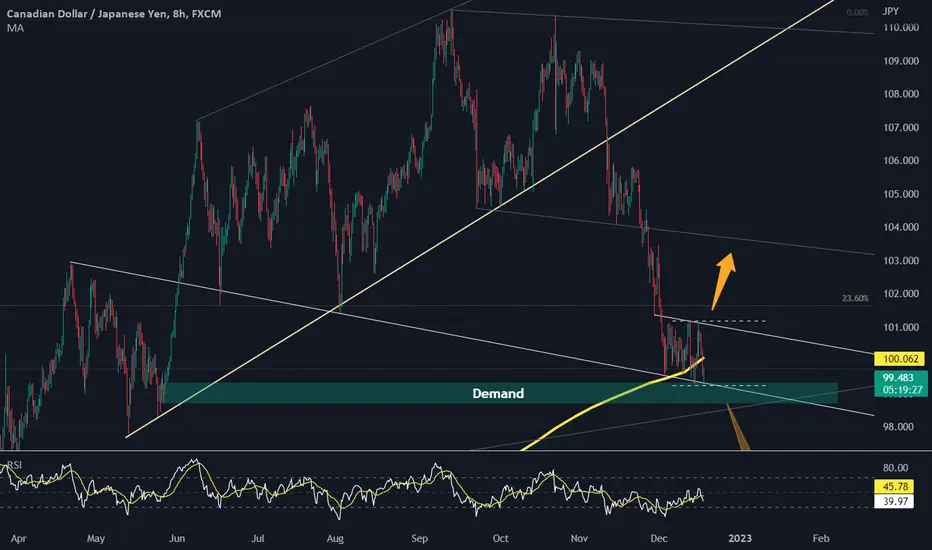
CADJPY waiting for a breakoutCADJPY is in a flag pattern. We are waiting for an escape candle with Propper momentum ether up above 101.212 to continue bullish or below 99.254 to fall bearish.
Although a bullish move would be more favorable, the price is in a Demand zone, with a 50 weekly moving average and touching the trend line below.
----------------------
Let us know your thoughts in the comments, and show your support by liking the idea.
Please follow if you're interested in more ideas like this.
Your support is greatly appreciated!
CADJPY strong bullish expectations
Hi viewers, CADJPY after today events, personally bullish.
TP1: 102.000 (100)
TP2: 102.600 (160)


Expect a Bullish run on CADJPY - ReversalPIVOT: 99.00
OUR PREFERENCE
Long Position above 99.00 with targets at 101.20 , 102.20 & 103.20 in extension
Alternate Scenario
Below 99.00 look for further downward trend with 97.00 & 96.30 as targets.
Comment:
the immediate trend is down but the momentum is weak

CAD/JPY - SHORT- Descending triangle pattern
- Bearish continuation of the current down trend
- Bearish confluence among indicators and moving averages
- Waiting until support at 99.70 breaks before entry

CAD/JPY - Short- Resistance zones respected
- In line with the bearish trend
- Indicators showing Bearish movements

CADJPY: Important Bearish Breakout
CADJPY broke and closed below a key daily structure support.
The broken structure turned into a resistance now.
I expect a bearish continuation to 103.0 / 101.8 levels.
❤️If you have any questions, please, ask me in the comment section.
Please, support my work with like, thank you!❤️

CAD JPY - FUNDAMENTAL DRIVERSCAD
FUNDAMENTAL OUTLOOK: WEAK BEARISH
BASELINE
Even though most recent jobs print offset all of the jobs that was lost in 2H22, the housing market still poses big risks for the Canadian economy. With a big increase in variable-rate mortgages after the pandemic, lots of consumers will be pressed on their disposable income after mortgages need to be reset (and that is happening while price pressures are still uncomfortably high). Furthermore, despite hawkish comments from Gov Macklem heading into the Oct meeting, the bank surprised markets with a 50bsp hike when markets were pricing in a 75bsp hike. The bank also stated there is increased risks of a recession during 1H23.
POSSIBLE BULLISH SURPRISES
Catalysts that see upside in Oil (deteriorating supply outlook, ease in demand fears, OPEC developments) could trigger bullish CAD reactions. As a risk sensitive currency, and catalyst that causes big bouts of risk on sentiment could trigger bullish reactions in the CAD. A bid surprise miss in Wednesday’s CPI should seal the deal for a 25bsp hike and should put more pressure on the CAD.
POSSIBLE BEARISH SURPRISES
Catalysts that trigger downside in oil (deteriorating demand outlook, ease in supply shortage, less supply constraints, OPEC developments) could be a negative catalyst for the CAD as well. As a risk sensitive currency, and catalyst that causes big bouts of risk offsentiment could trigger bearish reactions in the CAD. A surprise beat in CPI this week could see markets lean towards a 50bsp and support CAD (but we’ll look to fade strength).
BIGGER PICTURE
The bigger picture outlook for the CAD has shifted to bearish. Given the clear risks to the growth outlook (recent negative econ data, high inflation, stress in the housing market, exposure to a slowing US economy) we think the bias is titled lower for the currency from here. Also, with the currency still relatively close to cycle peaks, and with the BoC close to terminal rate expectations, our preferred way of trading the CAD is lower on clear short-term negative catalysts.
JPY
FUNDAMENTAL OUTLOOK: BEARISH
BASELINE
In recent weeks, yield differentials of course have been the biggest driver for the JPY with the BoJ keeping 10-year JGB yields capped at 0.25% with yield curve control while other central banks are hiking rates aggressively. However, Japan has intervened in the FX market twice buying JPY and selling USDs. The intervention saw short-term downside in XXXJPY pairs, but as the fundamental remains bearish it’ll take constant intervention to stop the JPY from falling. In the week ahead, focus will remain on any big moves in US yields (especially with further incoming US data).
POSSIBLE BULLISH SURPRISES
Catalysts that push US10Y lower (less hawkish Fed, lower UC CPI, lower growth) could trigger bullish reactions from the JPY. Any catalyst that triggers meaningful downside in key commodities like Oil (deteriorating demand outlook, ease in supply shortage) could trigger bullish JPY reactions. Any additional intervention from the BoJ or MoF.
POSSIBLE BEARISH SURPRISES
Any catalysts that push US10Y higher (more aggressive Fed, higher US CPI, better growth) could pressure the JPY. Catalyst that triggers meaningful upside in Oil (improving demand, decreased supply) could trigger JPY downside. Reluctance from BoJ and MoF for intervening around the 145 level in USDJPY could spark speculative buying.
BIGGER PICTURE
The fundamental outlook remains bearish for the JPY due to yield differentials and the impact of a weaker JPY on the current account balance. As long as US10Y remain elevated and the BoJ stays stubbornly dovish and no currency intervention occurs, the bias remains lower. But take note of positioning which means we don’t want to chase the JPY lower, especially with the risk of further currency intervention should the JPY continue to weaken. The best opportunities for now remain short-term focused on further intervention or strong moves lower in US yields.

USD & CAD not recoveringUSD & CAD not recovering from CPI reports, USOIL rising which will hit JPY as a Oil net export economy. Heading for mid November it's time of the year to short USD. Also because of FED's steady interest rate increments.

CADJPY Accumulation before pump?The CADJPY pair continues to follow our trading plan presented on September 20, as it repeats the fractal of late 2021 - early 2022:
As you see, the MACD Bearish Cross was the correct sell signal we needed and the price hit the 0.618 Fibonacci target and rebounded. Right now it appears that the price has entered a consolidation phase similar to the post January 20 MACD Bearish Cross. As long as the Green Support Zone holds, we should expect within a 5 week horizon a break above the September High, targeting the 2.0 Fibonacci extension.
A break below the Zone though, shouldn't stop on the 1D MA200 (orange trend-line) but instead target the 1W MA50 (red trend-line) for the first time since December 20 2021. An additional bullish confirmation would be a break of the RSI above its own Lower Highs trend-line, which in more than a year has delivered very strong and rapid rallies.
-------------------------------------------------------------------------------
** Please LIKE 👍, SUBSCRIBE ✅, SHARE 🙌 and COMMENT ✍ if you enjoy this idea! Also share your ideas and charts in the comments section below! This is best way to keep it relevant, support me, keep the content here free and allow the idea to reach as many people as possible. **
-------------------------------------------------------------------------------
You may also TELL ME 🙋♀️🙋♂️ in the comments section which symbol you want me to analyze next and on which time-frame. The one with the most posts will be published tomorrow! 👏🎁
-------------------------------------------------------------------------------
👇 👇 👇 👇 👇 👇
💸💸💸💸💸💸
👇 👇 👇 👇 👇 👇

Canadian Dollar / Japanese YenHello traders Good Day Ahead !
Here is my analysis about Canadian Dollar / Japanese Yen
Price is forming in V-angle and moving around at 108.600-700
major resistance level of this pair is at 110.700-800
Support level for this pair is 107.600-700 which is out 1st Target
wait for the breakout for next move for bearish or remain Bullish
Good Luck

CADJPYPrice held daily support zone
Price reacted very bullish off of daily support zone
Looking for entry at restest and ride to previous hights


InvestMate|CAD/JPY Will we go higher or is this already a peak?CAD/JPY Will we go higher or is this already a peak?
🍁Unemployment remaining low at 5.2%.
🍁Inflation slowly slowing The latest reading on 19 October indicated 6.9% which, compared to the peak of 8.1% recorded in June, offers a breath of optimism.
🍁Interest rates definitely higher than in the EU. At 3.25%. With the next rate hike due on 10 October, the market assumes it will be a 75 basis point hike to 4%.
🍁Trade balance at a high of C$1.52B in August. On 3 November we will find out how much it amounted to in September. Canada is now seeing very strong trade volumes. The highest in a decade.
🍁Manufacturing PMI low of 49.80 points.
tradingeconomics.com
🍁The Consumer Confidence Index is falling but neither all-time highs nor a "crisis" state is just low at 48.51 points.
tradingeconomics.com
🍁Will we see this reflected in the chart of these currencies?
🍁💴On the other side of the globe.
💴In Japan, no change.
💴Unemployment Rate low at 2.5%
💴Inflation low 3%. Japan is one of those countries that has not been hit by Inflation as much as Europe and the USA.
💴Interest rates at -0.1%. Still negative from 2016. Hence these falls in the Yen. When other countries raise rates causing their currencies to strengthen, their strength against the Yen increase.
💴For now, there are no increases on the horizon. The Bank of Japan says it has no intention of changing its monetary policy.
💴But the government doesn't want the Japanese Yen so cheap either, hence in recent days we have seen sharp falls which were interventions to stop the Yen weakening sharply against other currencies.
💴I don't think this will stop investors from pushing prices up again.
💴 Looking at the sytcajci of both currencies, I don't think anything has changed in the current trend over the months. The only threat could be unexpected monetary interventions to strengthen the Yen
📈Meanwhile on the chart.
📈On 21 October we made a double top and then after the intervention we went down into the support zone and there was a sharp overbought period.
📈Turning to the monthly chart, the first thing that catches our eye is a harmonic formation called gartley.
📈If the harmonic formation were to be fulfilled we can expect a rise to the range of the largest downward wave at the 0.786 level.
📈Assuming a stop below the post-intervention lows and a take profit at 0.786, this gives us a profit/risk range of 2.52.
🚀If you appreciate my work and effort put into this post I encourage you to leave a like and give a follow on my profile.🚀

Buy for CADJPYAs the is preparing to take another try.
The pullback is done and the daily trend is launching again.

CADJPY - Top In Place? 🤔CADJPY appears to have completed the bullish wave and now we could be at the start of the bearish wave.
We're currently looking to catch the bearish wave once we see confirmation. The confirmation we're looking for is rejection of fib and then break of the red trendline to indicate the next impulse has started.
Trade idea:
- Watch for rejection of fib levels
- risk entry on rejection of fib
- Safe entry on break of red trendline
- stoploss above correction once red trendline breaks
- Targets: 101.6 (670pips), 96 (1150pips)
See below for the weekly timeframe
Goodluck and as always, trade safe!
