CAD/JPY BEST PLACE TO SELL FROM|SHORT
Hello, Friends!
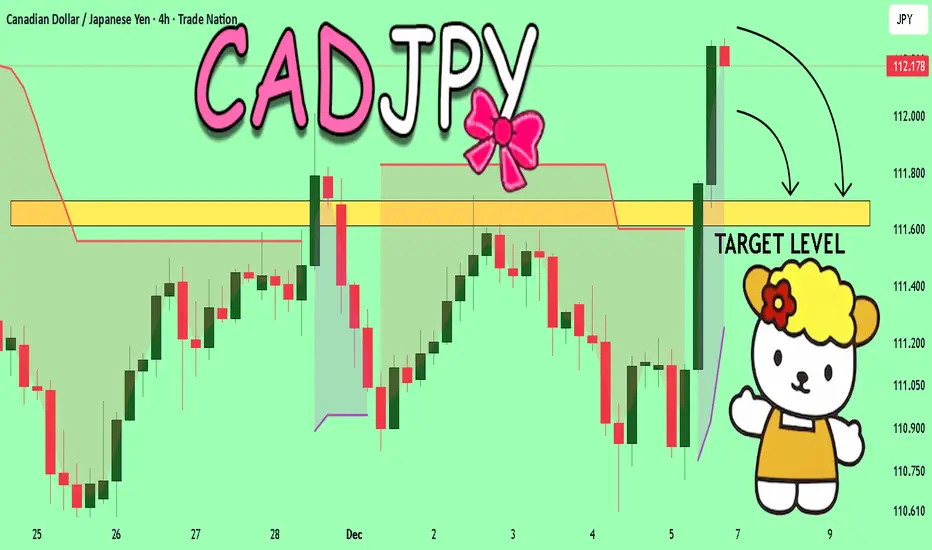
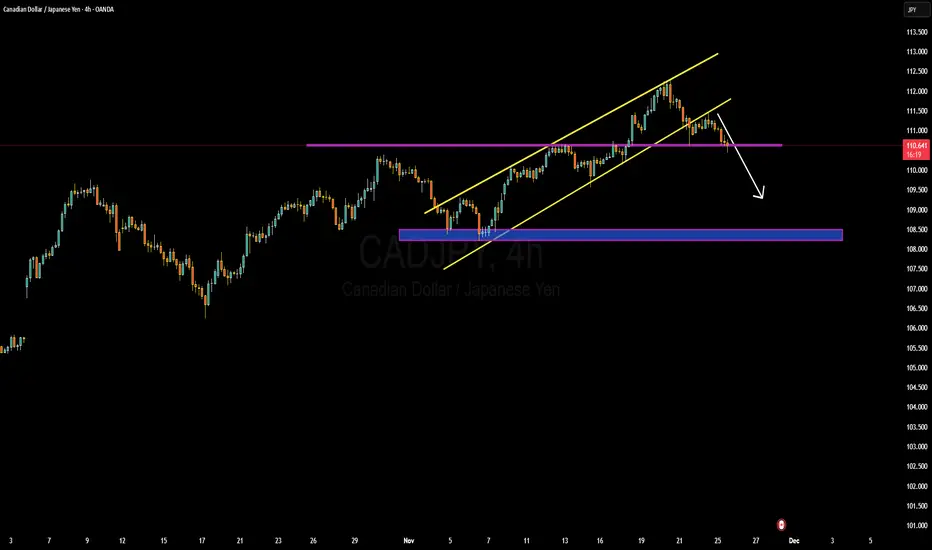
CAD/JPY pair is in the uptrend because previous week’s candle is green, while the price is clearly rising on the 4H timeframe. And after the retest of the resistance line above I believe we will see a move down towards the target below at 111.569 because the pair overbought due to its proximity to the upper BB band and a bearish correction is likely.
Disclosure: I am part of Trade Nation's Influencer program and receive a monthly fee for using their TradingView charts in my analysis.
✅LIKE AND COMMENT MY IDEAS✅
CADJPY

CADJPY – Final Diagonal Before the Drop!We’ve been tracking CADJPY for years, and price continues to follow Elliott Wave structure with precision.
The major decline in 2024 completed wave (1) and triggered a higher-timeframe correction. Since then, price has developed a clear W–X–Y structure.
- W topped in late 2024
- X completed after a clean ABC decline
- Price is now in wave Y, unfolding as a zigzag (5-3-5)
Within Y, waves (A) and (B) have completed, and price is now pushing through the final 5-wave structure of wave (C). This final diagonal is what will complete the entire W–X–Y correction before the next major bearish leg begins.
Our focus is now on the ending diagonal forming in wave (C). Once this diagonal structure breaks, it will confirm that wave Y has completed and that the higher-timeframe downtrend is ready to resume.
Trade Idea:
Entry: Break of the diagonal
Stops: Above the break candle / above the final high of the diagonal
Targets:
TP1: 101.50 (1200 pips)
TP2: 95.00 (1850 pips)
Optional runner: Keep a portion open for long-term continuation
Goodluck and as always, trade safe!
See below for our previous CADJPY analysis:
Swing 1:
Swing 2:
Swing 3:
Swing 4:

Will CAD/JPY Hold Demand and Push Toward the Next Target?🍁 CAD/JPY SWING TRADE SETUP 💴
═════════════════════════════════════════════════════════════
📊 CURRENT MARKET LEVEL: 111.115 (Real-time as of Nov 19, 2025)
🎯 TRADE DIRECTION
BULLISH MOMENTUM ⬆️ | Swing Trade Framework
📍 ENTRY STRATEGY: LAYERED LIMIT ORDER APPROACH
Advanced Multi-Entry Technique - "Thief Strategy"
Execute multiple buy limit orders across key support levels to optimize entry execution:
🔹 Layer 1 (Strong Support): 110.000 JPY
🔹 Layer 2 (Mid-Range): 110.500 JPY
🔹 Layer 3 (Technical Level): 111.000 JPY
💡 PRO TIP: Scale your position sizing inversely with each layer - allocate 40% at Layer 1, 35% at Layer 2, 25% at Layer 3 for optimal risk management
Customization: Adjust layers based on your risk tolerance, account size, and recent price action. Tighter layers = higher frequency fills; wider layers = better averaging down potential.
🛑 STOP LOSS FRAMEWORK
Hard Stop Level: 109.500 JPY
⚠️ CRITICAL DISCLAIMER: This SL is a reference point ONLY. Set YOUR stop loss based on:
Your personal risk management rules
Account equity tolerance (typically 1-2% risk per trade)
Market volatility assessment
Your trading experience level
Remember: Your capital, your rules, your responsibility.
🎁 PROFIT TAKING TARGETS
Primary Target (1st Pullback): 111.875 JPY (+0.75 exit point)
Secondary Target (Strong Resistance): 112.500 JPY
Moving Average acts as dynamic resistance + overbought zone
⚠️ CRITICAL DISCLAIMER: TP levels are analytical observations, NOT recommendations.
Exit Decisions Should Factor In:
Real-time momentum indicators (RSI, Stochastic)
Volume confirmation at resistance zones
Daily market volatility
News/economic calendar events
Your profit/loss objectives
Take profits according to YOUR strategy, not someone else's target.
📈 TECHNICAL CONFLUENCE FACTORS
✅ Support Holds: 109.500 provides structural support
✅ Resistance Zone: Moving averages clustered near 112.00-112.500
✅ Overbought Consideration: RSI compression near resistance
✅ Volume Profile: Historical resistance identified
💰 CORRELATED PAIRS TO MONITOR
Track these pairs for sentiment shifts and early signals
🔴 Positive Correlation Pairs (Move WITH CAD/JPY)
1. USD/JPY ($)
Why: Both pairs have JPY as base currency
Impact: Strong BoJ policy changes affect both equally
Watch For: If USD/JPY breaks above 155, CAD/JPY likely follows
Correlation Strength: 85%+ (Very Strong)
2. AUD/JPY ($)
Why: Commodity-linked currency vs JPY (like CAD)
Impact: Risk-on sentiment drives both higher
Watch For: Parallel breakouts suggest broader yen weakness
Correlation Strength: 78%+ (Strong)
3. NZD/JPY ($)
Why: Higher-yielding commodity currency vs defensive JPY
Impact: Carry trade unwinds hit both simultaneously
Watch For: If these turn bearish, CAD/JPY likely follows
Correlation Strength: 75%+ (Strong)
🔵 Negative Correlation Pairs (Move OPPOSITE to CAD/JPY)
1. USD/CAD ($)
Why: Direct inverse - one's strength is the other's weakness
Impact: If USD strengthens, CAD weakens = CAD/JPY falls
Watch For: USD/CAD above 1.3400 warns of CAD/JPY weakness
Correlation Strength: -85%+ (Strong Inverse)
2. CAD/CHF ($)
Why: Both carry safe-haven currencies but different way
Impact: CAD weakness = both pairs decline
Watch For: Divergence indicates currency-specific news
Correlation Strength: -70%+ (Moderate Inverse)
🔑 KEY MARKET DRIVERS FOR THIS PAIR
Bank of Canada (BoC) Actions: Interest rate decisions & forward guidance - bullish for CAD
Bank of Japan (BoJ) Stance: Keeps JPY weak; defensive policies support the pair
Crude Oil Prices: 80% correlation - oil strength = CAD strength
US/Canada Economic Data: Employment, GDP, inflation prints (CPI)
Risk Sentiment: Periods of risk-on favor higher-yielding CAD over safe-haven JPY
⏰ OPTIMAL TRADING WINDOWS
Best Liquidity: 16:00-20:00 GMT (Overlap of Asian-American sessions)
Second Choice: 08:00-12:00 GMT (London-Asian overlap)
Avoid: 20:00-08:00 GMT (Low liquidity, wide spreads)
📋 PRE-TRADE CHECKLIST
Check BoC & BoJ calendar for upcoming events (48-72 hour window)
Verify USD/JPY direction - confirms broader yen momentum
Confirm AUD/JPY & NZD/JPY for carry sentiment
Check crude oil price action (impacts CAD bias)
Assess current RSI levels - avoid entries in extreme zones
Confirm entry limits are BELOW current price (limit orders only)
Position sizing = (Account Risk %) / (Entry to SL pips)
Set alerts on all layer entry points + alert on SL breach
⚡ IMPORTANT LEGAL & TRADING DISCLAIMERS
🔺 This analysis is educational and observational only - NOT financial advice
🔺 You assume 100% responsibility for all trading decisions
🔺 Past performance ≠ Future results
🔺 Forex trading carries substantial risk of loss
🔺 Never risk more than you can afford to lose
🔺 Adjust ALL levels (Entry, SL, TP) per YOUR risk tolerance
🔺 Consult a licensed financial advisor for personal guidance
Happy Trading & Manage Risk First! 📊✅

CAD/JPY at Key Weighted Support – Is the Next Wave Up?💹 CAD/JPY – Bullish Layer Trap Setup | Weighted Power Play! 💥
Asset: CAD/JPY (Canadian Dollar vs Japanese Yen)
Market Type: Forex Market Profit Pathway Setup (Swing / Day Trade)
🎯 Plan: The Bullish Thief’s Weighted Move
The bullish plan is confirmed after a Weighted Moving Average (WMA) pullback — a classic thief-style momentum catch! 😎
We’re stalking the zone where price respects the WMA curve and bounces higher, hinting a continuation to the upside.
💡 Why Weighted MA?
Because it gives sharper precision and reacts faster to price volatility, giving us the edge in timing our entries before the crowd jumps in.
💰 Entry Zone (Layer Strategy Style)
The Thief Strategy uses a layered limit order entry method — stacking multiple buys to average a prime position during pullbacks:
Buy Limit Layers: 108.000 | 108.200 | 108.400 | 108.600
(You can adjust or add more layers based on your risk appetite)
🛡️ Stop-Loss: @ 107.700 (Thief SL Zone)
📈 Target Zone: @ 110.200 – 110.500
🧠 Trade Logic & Insight
🔹 Why Bullish?
The recent momentum shows buyers defending key structural lows near 108.000.
Weighted MA crossover supports bullish momentum continuation, backed by strong CAD fundamentals and stable oil prices (CAD often correlates positively with crude).
🌐 Correlated Pairs to Watch
💵 USD/JPY: Similar JPY-side weakness can confirm CAD/JPY upside.
💰 CAD/CHF: Often mirrors CAD strength in risk-on sentiment.
🛢️ XTI/USD (WTI Crude Oil): Rising oil prices can fuel CAD gains, providing extra confirmation for bullish CAD/JPY bias.
⚠️ Notes from the Thief OG’s Desk
Dear Ladies & Gentlemen (Thief OGs) — this setup is my personal style of entry planning.
Not a recommendation. You’re the driver — your profit, your risk, your rulebook! 📜
Police barricade near 110.500 is a trap zone — act smart, escape with profits before the correction hits.
Always manage risk wisely and use your judgment — that’s the real thief’s code! 🕶️
✨ If you find value in my analysis, a 👍 and 🚀 boost is much appreciated — it helps me share more setups with the community!
⚖️ Disclaimer
This is a Thief-style trading strategy shared just for fun and educational purposes.
Not financial advice — trade responsibly and always do your own analysis.
🔖 #CADJPY #Forex #SwingTrade #DayTrade #ThiefStrategy #TechnicalAnalysis #FX #WMA #WeightedMovingAverage #CAD #JPY #ForexSetup #RiskManagement #TradingCommunity #TrendTrader

Bullish Breakout Still Intact but Showing First Signs of ExhaustCAD/JPY 1H – Bullish Breakout Still Intact but Showing First Signs of Exhaustion at 111.95–112.00 Supply
Quick Professional Update & Current Status
Pair: CAD/JPY
Timeframe: 1-hour
Current Price: ≈111.78–111.83 (pulling back slightly from the 111.95 intraday spike)
What Has Changed in the Last ~13 Minutes:
Price spiked aggressively to 111.953 (new 2025 high) → hit the exact top of the annotated Strong Supply Zone (112.00–112.40).
Immediate sharp rejection with a long upper wick (shooting star–style candle) and a fast 15–20 pip drop.
Volume spiked on the rejection — clear evidence of heavy supply entering at that level.
Current Technical Picture:
The ascending triangle breakout remains 100 % valid — we are still above the former resistance (now support) at 111.40–111.60.
First real test of the breakout’s strength is happening right now.
Momentum indicators (RSI 1H) are rolling over from overbought territory for the first time since the breakout.
Key Levels Right Now (as of this candle):
Immediate support cluster: 111.60–111.70 (must hold for bulls)
Stronger support: 111.40–111.50 (breakout zone — critical)
Resistance overhead: 111.95–112.00 (today’s spike high + supply)
Next upside targets still in play: 112.20 → 112.70–112.80 (only if 112.00 is cleared decisively)
Updated Bias & Trade Management (Professional View)
Bias: Still bullish / LONG, but caution warranted — no longer “aggressive buy-the-dip” mode.
Active Scenarios:
Bullish continuation (70 % base case):
Healthy 30–50 pip pullback into 111.50–111.70, consolidates, then resumes higher toward 112.20+.
→ Add or hold longs on a successful retest of 111.60–111.70.
Failed breakout / bearish trap (30 % risk):
If we lose 111.40 on a closing basis → high probability of a fast drop back into the prior range (111.00–110.60).
→ Tighten stops or take partial/full profits.
Immediate Actionable Levels (next 1–4 hours):
Protective stop for fresh breakout longs: 111.38 (just below breakout zone)
Aggressive re-entry / add zone: 111.58–111.68
Take-profit scaling: 50 % off at 112.00, trail the rest

CAD/JPY BULLS ARE GAINING STRENGTH|LONG
Hello,Friends!
CAD/JPY pair is in the uptrend because previous week’s candle is green, while the price is obviously falling on the 4H timeframe. And after the retest of the support line below I believe we will see a move up towards the target above at 111.532 because the pair is oversold due to its proximity to the lower BB band and a bullish correction is likely.
Disclosure: I am part of Trade Nation's Influencer program and receive a monthly fee for using their TradingView charts in my analysis.
✅LIKE AND COMMENT MY IDEAS✅

CADJPY The Target Is DOWN! SELL!
My dear friends,
CADJPY looks like it will make a good move, and here are the details:
The market is trading on 112.19 pivot level.
Bias - Bearish
Technical Indicators: Supper Trend generates a clear short signal while Pivot Point HL is currently determining the overall Bearish trend of the market.
Goal - 111.69
About Used Indicators:
Pivot points are a great way to identify areas of support and resistance, but they work best when combined with other kinds of technical analysis
Disclosure: I am part of Trade Nation's Influencer program and receive a monthly fee for using their TradingView charts in my analysis.
———————————
WISH YOU ALL LUCK
CADJPY Short! Pair is too over extended! Mean reversion TradeThe most recent Canadian employment data from Statistics Canada's Labour Force Survey covers November 2025, released today (December 5, 2025). This follows the previous release on November 7, 2025, for October data. Key highlights indicate continued volatility in the labor market, with stronger-than-expected job gains in recent months (e.g., +66,600 in October) after earlier declines, but the unemployment rate remains elevated compared to pre-2025 levels. The data suggests stabilization amid economic uncertainties, including potential U.S. tariffs.

CADJPY Will Go Up From Support! Long!
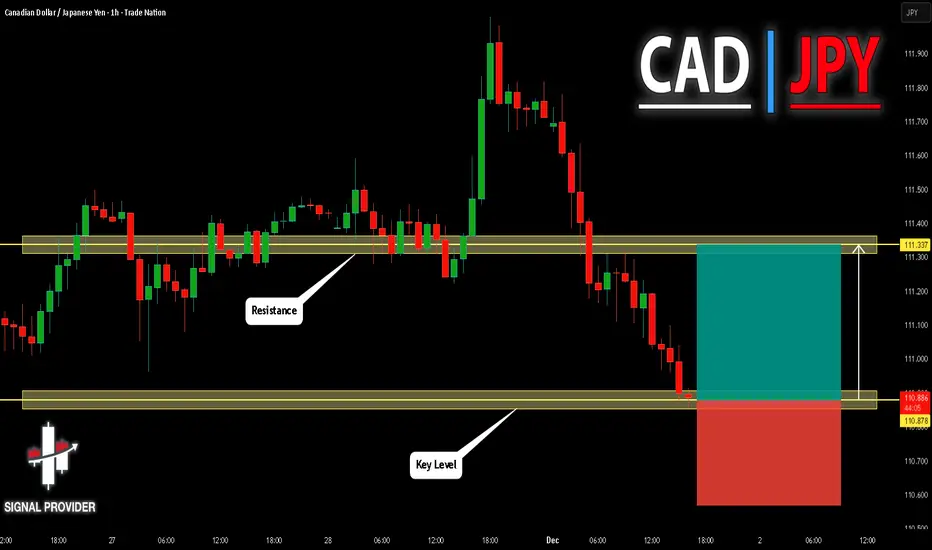
Please, check our technical outlook for CADJPY.
Time Frame: 1h
Current Trend: Bullish
Sentiment: Oversold (based on 7-period RSI)
Forecast: Bullish
The market is approaching a significant support area 110.878.
The underlined horizontal cluster clearly indicates a highly probable bullish movement with target 111.337 level.
P.S
Please, note that an oversold/overbought condition can last for a long time, and therefore being oversold/overbought doesn't mean a price rally will come soon, or at all.
Like and subscribe and comment my ideas if you enjoy them!
sell cadjpyI was expecting cadjpy to sell on monday or sunday but ONLY when FVG forms - which it did. so as price is going up, my expecting is that the 4hr fvg hold price and push it further down. Risk to reward is 1:3
Stop!Loss|Market View: USDCAD🙌 Stop!Loss team welcomes you❗️
In this post, we're going to talk about the near-term outlook for the USDCAD currency pair☝️
Potential trade setup:
🔔Entry level: 1.32468
💰TP: 1.33901
⛔️SL: 1.31035
"Market View" - a brief analysis of trading instruments, covering the most important aspects of the FOREX market.
👇 In the comments 👇 you can type the trading instrument you'd like to analyze, and we'll talk about it in our next posts.
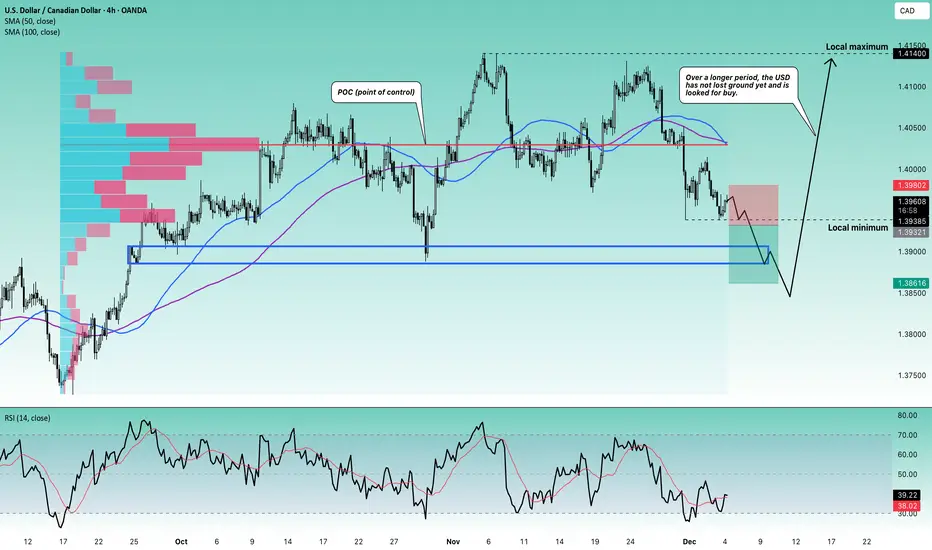
💬 Description: The USD will likely continue to decline in the short term, but the mid-term outlook remains favorable for buyers. For USDCAD, 1.39000 and 1.38500 are likely potential buying opportunities in the mid-term. Currently, given the price accumulation near the support level of 1.39385, a breakout to the levels outlined above is expected.
Thanks for your support 🚀
Profits for all ✅
CADJPY Will Explode! BUY!
My dear friends,
CADJPY looks like it will make a good move, and here are the details:
The market is trading on 111.25 pivot level.
Bias - Bullish
Technical Indicators: Supper Trend generates a clear long signal while Pivot Point HL is currently determining the overall Bullish trend of the market.
Goal - 111.43
Recommended Stop Loss - 111.15
About Used Indicators:
Pivot points are a great way to identify areas of support and resistance, but they work best when combined with other kinds of technical analysis
Disclosure: I am part of Trade Nation's Influencer program and receive a monthly fee for using their TradingView charts in my analysis.
———————————
WISH YOU ALL LUCK

CAD/JPY: Bullish Continuation Setup - Buy Above 111.33The CAD/JPY pair has completed a bullish wave structure and is now showing a healthy pullback, creating a high-probability continuation setup.
WAVE STRUCTURE ANALYSIS:
✅ Completed bullish wave formation
✅ Pullback has traded below Structure 4
✅ Continuation remains valid above Structure 2 (110.96)
TRADE SETUP:
📍 Entry: Buy above 111.33 (signals uptrend resumption)
🛑 Stop Loss: 110.96 (Structure 2 invalidation point)
🎯 Target 1: 112.46 (Fibonacci key ratio projection)
🎯 Target 2: 112.97 (Extended Fibonacci target)
FIBONACCI ANALYSIS:
Using key ratio Fibonacci measurement from the complete wave structure low to high, we've identified clear target zones for profit-taking.
RISK MANAGEMENT:
Price must hold above 110.96 for bullish bias to remain valid
Entry above 111.33 confirms momentum resumption
KEY LEVELS TO WATCH:
📌 Critical Support: 110.96
📌 Entry Trigger: 111.33
📌 Resistance 1: 112.46
📌 Resistance 2: 112.97
METHODOLOGY: WavesOfSuccess Price Behaviour Analysis

CAD/JPY — Key Resistance Rejection: Short Opportunity FormsThe pair recently approached a strong horizontal resistance zone where price previously reversed. Current price action suggests rejection from this level, signaling potential downside pressure.
Bearish candlestick patterns and weakening momentum indicate that sellers may be regaining control, making a short trade favorable for a tactical move.
If the price fails to break above resistance decisively, a retreat toward previous support levels is likely — this aligns with classic resistance‑flip failure / trend continuation to downside.
Key levels to watch:
Entry (sell): near current resistance (~where price rejection is confirmed)
Target: next major support / swing‑low zone
Stop‑loss: just above resistance zone to minimize risk in case of breakout
Professional takeaway: Wait for confirmation of resistance rejection (bearish candle or multiple rejections). Avoid entering prematurely before clear signs of seller dominance.

CADJPY Will Collapse! SELL!
My dear followers,
This is my opinion on the CADJPY next move:
The asset is approaching an important pivot point 111.45
Bias - Bearish
Safe Stop Loss - 111.62
Technical Indicators: Supper Trend generates a clear short signal while Pivot Point HL is currently determining the overall Bearish trend of the market.
Goal - 111.13
About Used Indicators:
For more efficient signals, super-trend is used in combination with other indicators like Pivot Points.
Disclosure: I am part of Trade Nation's Influencer program and receive a monthly fee for using their TradingView charts in my analysis.
———————————
WISH YOU ALL LUCK

CAD/JPY SENDS CLEAR BEARISH SIGNALS|SHORT
Hello, Friends!
The BB upper band is nearby so CAD-JPY is in the overbought territory. Thus, despite the uptrend on the 1W timeframe I think that we will see a bearish reaction from the resistance line above and a move down towards the target at around 109.581.
Disclosure: I am part of Trade Nation's Influencer program and receive a monthly fee for using their TradingView charts in my analysis.
✅LIKE AND COMMENT MY IDEAS✅

CADJPY Forming Falling WedgeCADJPY is currently forming a falling wedge pattern, which is often seen as a bullish reversal setup after a corrective decline. On the chart, price has pulled back from recent highs and is now compressing within descending support and resistance lines, showing decreasing volatility and seller exhaustion. This type of price action generally signals that buyers may soon step back in, especially if the pair breaks out above the wedge resistance with strong momentum. As a professional trader, I am monitoring the pattern for a potential upside continuation if the breakout confirms with volume and candle body expansion.
Fundamentally, CADJPY remains influenced by diverging central bank sentiment. The Bank of Canada continues to maintain a controlled policy stance as inflation remains stable within the expected range, while the Bank of Japan still operates with ultra-loose monetary policy. This interest rate differential keeps CADJPY attractive to carry traders and supports long-term bullish structure. If energy prices stay firm and Canada benefits from positive global risk sentiment, CADJPY could continue gaining strength after the wedge breakout.
However, short-term corrective movement is still visible as the market responds to profit taking and global risk fluctuations. If the wedge fails to break upward, price may retest lower support levels for liquidity before a new bullish trend leg begins. I remain focused on price reaction near structure, as break-and-retest confirmation will be key for high probability long positions.
On TradingView, falling wedge and CADJPY forecast are currently highly searched topics, reflecting strong interest in potential trend continuation setups across the Forex market. With a clean pattern, strong fundamentals, and supportive long-term structure, CADJPY holds the potential for profitable bullish opportunities once confirmation appears.
CADJPY DEMAND LEVEL AHEAD|LONG|
✅CADJPY is pulling into the higher-timeframe demand after clearing sell-side liquidity, setting up a bullish reaction. If displacement confirms, algos may reprice toward the next buy-side liquidity target above. Time Frame 10H.
LONG🚀
✅Like and subscribe to never miss a new idea!✅

CADJPYMarket Structure
Trend Before Reversal
Strong bullish move from early October to mid-November.
Structure formed a rising wedge → classic exhaustion pattern.
Liquidity Trap Identified
Price spiked above 111.440, grabbed liquidity, then immediately reversed.
This is labeled “TRAP” on your chart.
Such moves usually mark:
→ End of bullish trend
→ Beginning of distribution
This kind of wick is typically engineered to trap breakout buyers before institutions reverse price.

CADJPY Forming Falling WedgeCADJPY is currently forming a falling wedge pattern, which is often seen as a bullish reversal setup after a corrective decline. On the chart, price has pulled back from recent highs and is now compressing within descending support and resistance lines, showing decreasing volatility and seller exhaustion. This type of price action generally signals that buyers may soon step back in, especially if the pair breaks out above the wedge resistance with strong momentum. As a professional trader, I am monitoring the pattern for a potential upside continuation if the breakout confirms with volume and candle body expansion.
Fundamentally, CADJPY remains influenced by diverging central bank sentiment. The Bank of Canada continues to maintain a controlled policy stance as inflation remains stable within the expected range, while the Bank of Japan still operates with ultra-loose monetary policy. This interest rate differential keeps CADJPY attractive to carry traders and supports long-term bullish structure. If energy prices stay firm and Canada benefits from positive global risk sentiment, CADJPY could continue gaining strength after the wedge breakout.
However, short-term corrective movement is still visible as the market responds to profit taking and global risk fluctuations. If the wedge fails to break upward, price may retest lower support levels for liquidity before a new bullish trend leg begins. I remain focused on price reaction near structure, as break-and-retest confirmation will be key for high probability long positions.
On TradingView, falling wedge and CADJPY forecast are currently highly searched topics, reflecting strong interest in potential trend continuation setups across the Forex market. With a clean pattern, strong fundamentals, and supportive long-term structure, CADJPY holds the potential for profitable bullish opportunities once confirmation appears.

CADJPY Will Go Up! Long!
Please, check our technical outlook for CADJPY.
Time Frame: 3h
Current Trend: Bullish
Sentiment: Oversold (based on 7-period RSI)
Forecast: Bullish
The market is trading around a solid horizontal structure 111.244.
The above observations make me that the market will inevitably achieve 112.283 level.
P.S
Overbought describes a period of time where there has been a significant and consistent upward move in price over a period of time without much pullback.
Like and subscribe and comment my ideas if you enjoy them!

CAD/JPY – Wedge Breakout Pattern (21.11.2025)📝 Setup Overview OANDA:CADJPY
CAD/JPY has broken below a rising wedge structure, signaling weakening bullish momentum. After multiple rejections at the resistance zone, price is now losing steam below the Ichimoku cloud, showing early bearish pressure.A clean breakout + retest scenario opens the door for downside continuation toward the next demand zones.
📌 Trading Plan📍 Entry Idea:
Look for bearish continuation below the wedge support + cloud rejection.
🎯 Targets (Support Levels):
1st Support: 111.022
2nd Support: 110.561
🛑 Resistance Zone:
112.014 – 112.294
This zone continues to act as a strong supply area where sellers took control repeatedly.
📉 Today’s Fundamentals – Bearish CAD Bias
1️⃣ Crude Oil Pullback → Weakens CAD
Canada’s economy is heavily tied to oil prices. Today’s dip in crude oil puts pressure on the CAD, giving JPY an advantage.
2️⃣ Safe-Haven Demand Supports JPY
With global markets showing risk-off sentiment (concerns over slowing global growth + uncertain central bank guidance), investors favor safe-haven currencies like the Japanese Yen.
3️⃣ BoC Policy Tone Still Cautious
Recent Bank of Canada communications show limited confidence in economic momentum.
Markets expect slower growth → bearish CAD outlook.
➡️ Combination of oil weakness + JPY strength + wedge breakdown = bearish continuation setup.
🔖 Hashtags
#CADJPY #ForexAnalysis #PriceAction #WedgeBreakout #Ichimoku #FXTrading #TechnicalAnalysis #FundamentalAnalysis #SmartMoney #TradingViewCommunity #Kabhi_TA_Trading
⚠️ Disclaimer
This analysis is for educational purposes only.
Not financial advice. Always manage your risk and trade based on your plan.
💬 Support the Work
If you found this analysis helpful, please LIKE & COMMENT on the post ❤️
Your support motivates more high-quality setups daily!

CADJPY – Update & ExecutionYesterday, our CADJPY position was stopped out at 111.65. The trend-changing pattern between Wave 3 and Wave 4 remains valid.
The wave that broke the Wave 3 structure extended beyond expectations, and price has now confirmed a breakdown with a second lower low on the M5 timeframe.
We have re-entered short at 111.94, with a stop loss at the high of the day (112.28).
Our target remains 110.92.
