CAD/JPY BULLS ARE GAINING STRENGTH|LONG
Hello,Friends!
CAD/JPY pair is in the uptrend because previous week’s candle is green, while the price is obviously falling on the 4H timeframe. And after the retest of the support line below I believe we will see a move up towards the target above at 111.532 because the pair is oversold due to its proximity to the lower BB band and a bullish correction is likely.
Disclosure: I am part of Trade Nation's Influencer program and receive a monthly fee for using their TradingView charts in my analysis.
✅LIKE AND COMMENT MY IDEAS✅
CADJPY

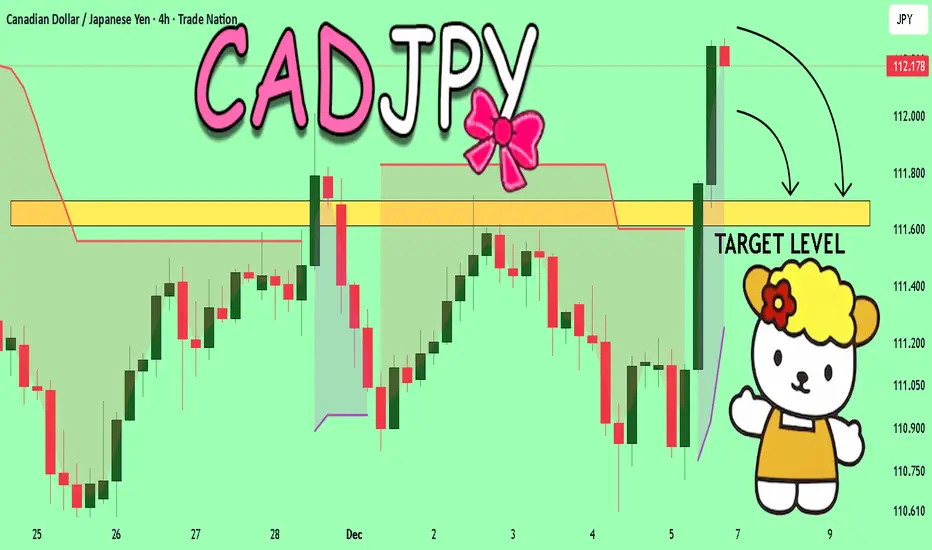
CADJPY The Target Is DOWN! SELL!
My dear friends,
CADJPY looks like it will make a good move, and here are the details:
The market is trading on 112.19 pivot level.
Bias - Bearish
Technical Indicators: Supper Trend generates a clear short signal while Pivot Point HL is currently determining the overall Bearish trend of the market.
Goal - 111.69
About Used Indicators:
Pivot points are a great way to identify areas of support and resistance, but they work best when combined with other kinds of technical analysis
Disclosure: I am part of Trade Nation's Influencer program and receive a monthly fee for using their TradingView charts in my analysis.
———————————
WISH YOU ALL LUCK
CADJPY Short! Pair is too over extended! Mean reversion TradeThe most recent Canadian employment data from Statistics Canada's Labour Force Survey covers November 2025, released today (December 5, 2025). This follows the previous release on November 7, 2025, for October data. Key highlights indicate continued volatility in the labor market, with stronger-than-expected job gains in recent months (e.g., +66,600 in October) after earlier declines, but the unemployment rate remains elevated compared to pre-2025 levels. The data suggests stabilization amid economic uncertainties, including potential U.S. tariffs.

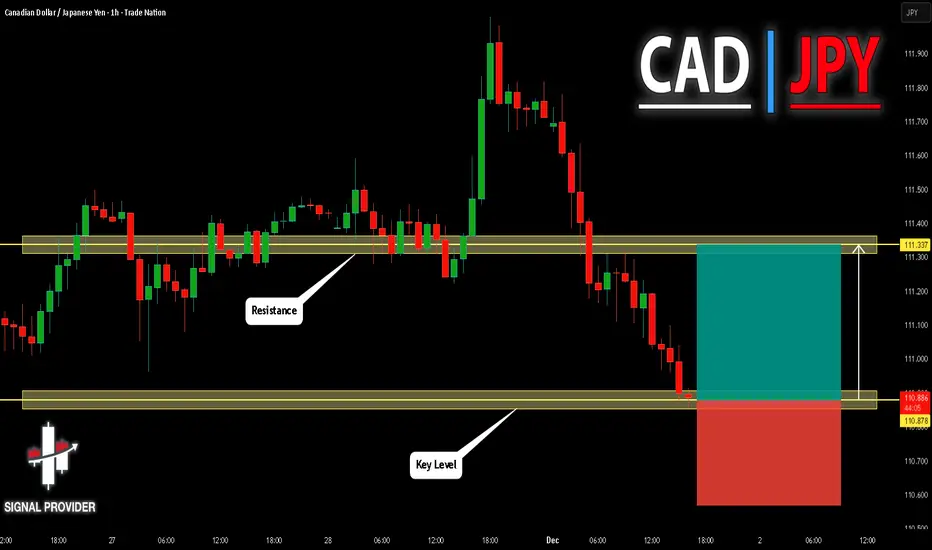
CADJPY Will Go Up From Support! Long!
Please, check our technical outlook for CADJPY.
Time Frame: 1h
Current Trend: Bullish
Sentiment: Oversold (based on 7-period RSI)
Forecast: Bullish
The market is approaching a significant support area 110.878.
The underlined horizontal cluster clearly indicates a highly probable bullish movement with target 111.337 level.
P.S
Please, note that an oversold/overbought condition can last for a long time, and therefore being oversold/overbought doesn't mean a price rally will come soon, or at all.
Like and subscribe and comment my ideas if you enjoy them!
sell cadjpyI was expecting cadjpy to sell on monday or sunday but ONLY when FVG forms - which it did. so as price is going up, my expecting is that the 4hr fvg hold price and push it further down. Risk to reward is 1:3
Stop!Loss|Market View: USDCAD🙌 Stop!Loss team welcomes you❗️
In this post, we're going to talk about the near-term outlook for the USDCAD currency pair☝️
Potential trade setup:
🔔Entry level: 1.32468
💰TP: 1.33901
⛔️SL: 1.31035
"Market View" - a brief analysis of trading instruments, covering the most important aspects of the FOREX market.
👇 In the comments 👇 you can type the trading instrument you'd like to analyze, and we'll talk about it in our next posts.
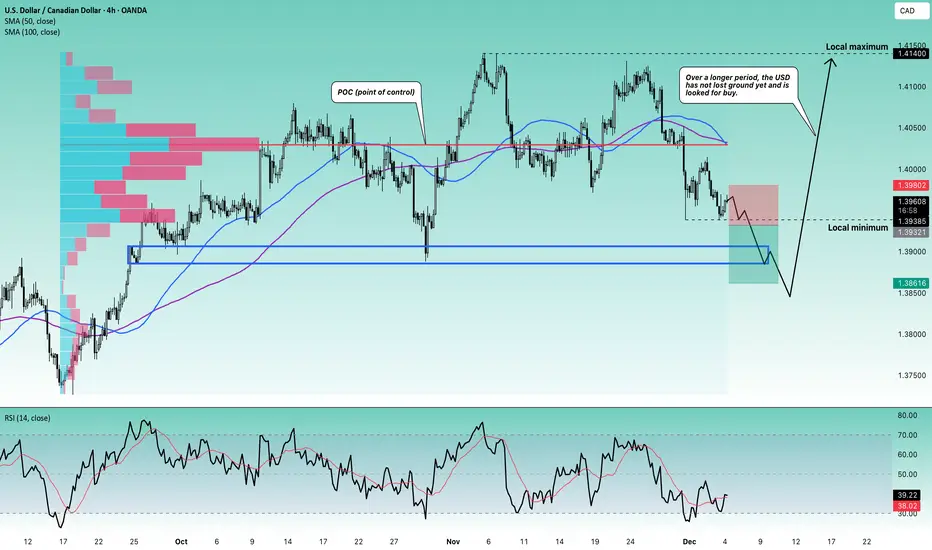
💬 Description: The USD will likely continue to decline in the short term, but the mid-term outlook remains favorable for buyers. For USDCAD, 1.39000 and 1.38500 are likely potential buying opportunities in the mid-term. Currently, given the price accumulation near the support level of 1.39385, a breakout to the levels outlined above is expected.
Thanks for your support 🚀
Profits for all ✅
CADJPY Will Explode! BUY!
My dear friends,
CADJPY looks like it will make a good move, and here are the details:
The market is trading on 111.25 pivot level.
Bias - Bullish
Technical Indicators: Supper Trend generates a clear long signal while Pivot Point HL is currently determining the overall Bullish trend of the market.
Goal - 111.43
Recommended Stop Loss - 111.15
About Used Indicators:
Pivot points are a great way to identify areas of support and resistance, but they work best when combined with other kinds of technical analysis
Disclosure: I am part of Trade Nation's Influencer program and receive a monthly fee for using their TradingView charts in my analysis.
———————————
WISH YOU ALL LUCK

CAD/JPY: Bullish Continuation Setup - Buy Above 111.33The CAD/JPY pair has completed a bullish wave structure and is now showing a healthy pullback, creating a high-probability continuation setup.
WAVE STRUCTURE ANALYSIS:
✅ Completed bullish wave formation
✅ Pullback has traded below Structure 4
✅ Continuation remains valid above Structure 2 (110.96)
TRADE SETUP:
📍 Entry: Buy above 111.33 (signals uptrend resumption)
🛑 Stop Loss: 110.96 (Structure 2 invalidation point)
🎯 Target 1: 112.46 (Fibonacci key ratio projection)
🎯 Target 2: 112.97 (Extended Fibonacci target)
FIBONACCI ANALYSIS:
Using key ratio Fibonacci measurement from the complete wave structure low to high, we've identified clear target zones for profit-taking.
RISK MANAGEMENT:
Price must hold above 110.96 for bullish bias to remain valid
Entry above 111.33 confirms momentum resumption
KEY LEVELS TO WATCH:
📌 Critical Support: 110.96
📌 Entry Trigger: 111.33
📌 Resistance 1: 112.46
📌 Resistance 2: 112.97
METHODOLOGY: WavesOfSuccess Price Behaviour Analysis

CADJPY Will Collapse! SELL!
My dear followers,
This is my opinion on the CADJPY next move:
The asset is approaching an important pivot point 111.45
Bias - Bearish
Safe Stop Loss - 111.62
Technical Indicators: Supper Trend generates a clear short signal while Pivot Point HL is currently determining the overall Bearish trend of the market.
Goal - 111.13
About Used Indicators:
For more efficient signals, super-trend is used in combination with other indicators like Pivot Points.
Disclosure: I am part of Trade Nation's Influencer program and receive a monthly fee for using their TradingView charts in my analysis.
———————————
WISH YOU ALL LUCK

CAD/JPY SENDS CLEAR BEARISH SIGNALS|SHORT
Hello, Friends!
The BB upper band is nearby so CAD-JPY is in the overbought territory. Thus, despite the uptrend on the 1W timeframe I think that we will see a bearish reaction from the resistance line above and a move down towards the target at around 109.581.
Disclosure: I am part of Trade Nation's Influencer program and receive a monthly fee for using their TradingView charts in my analysis.
✅LIKE AND COMMENT MY IDEAS✅

CADJPY Forming Falling WedgeCADJPY is currently forming a falling wedge pattern, which is often seen as a bullish reversal setup after a corrective decline. On the chart, price has pulled back from recent highs and is now compressing within descending support and resistance lines, showing decreasing volatility and seller exhaustion. This type of price action generally signals that buyers may soon step back in, especially if the pair breaks out above the wedge resistance with strong momentum. As a professional trader, I am monitoring the pattern for a potential upside continuation if the breakout confirms with volume and candle body expansion.
Fundamentally, CADJPY remains influenced by diverging central bank sentiment. The Bank of Canada continues to maintain a controlled policy stance as inflation remains stable within the expected range, while the Bank of Japan still operates with ultra-loose monetary policy. This interest rate differential keeps CADJPY attractive to carry traders and supports long-term bullish structure. If energy prices stay firm and Canada benefits from positive global risk sentiment, CADJPY could continue gaining strength after the wedge breakout.
However, short-term corrective movement is still visible as the market responds to profit taking and global risk fluctuations. If the wedge fails to break upward, price may retest lower support levels for liquidity before a new bullish trend leg begins. I remain focused on price reaction near structure, as break-and-retest confirmation will be key for high probability long positions.
On TradingView, falling wedge and CADJPY forecast are currently highly searched topics, reflecting strong interest in potential trend continuation setups across the Forex market. With a clean pattern, strong fundamentals, and supportive long-term structure, CADJPY holds the potential for profitable bullish opportunities once confirmation appears.
CADJPY DEMAND LEVEL AHEAD|LONG|
✅CADJPY is pulling into the higher-timeframe demand after clearing sell-side liquidity, setting up a bullish reaction. If displacement confirms, algos may reprice toward the next buy-side liquidity target above. Time Frame 10H.
LONG🚀
✅Like and subscribe to never miss a new idea!✅

CADJPYMarket Structure
Trend Before Reversal
Strong bullish move from early October to mid-November.
Structure formed a rising wedge → classic exhaustion pattern.
Liquidity Trap Identified
Price spiked above 111.440, grabbed liquidity, then immediately reversed.
This is labeled “TRAP” on your chart.
Such moves usually mark:
→ End of bullish trend
→ Beginning of distribution
This kind of wick is typically engineered to trap breakout buyers before institutions reverse price.

CADJPY Forming Falling WedgeCADJPY is currently forming a falling wedge pattern, which is often seen as a bullish reversal setup after a corrective decline. On the chart, price has pulled back from recent highs and is now compressing within descending support and resistance lines, showing decreasing volatility and seller exhaustion. This type of price action generally signals that buyers may soon step back in, especially if the pair breaks out above the wedge resistance with strong momentum. As a professional trader, I am monitoring the pattern for a potential upside continuation if the breakout confirms with volume and candle body expansion.
Fundamentally, CADJPY remains influenced by diverging central bank sentiment. The Bank of Canada continues to maintain a controlled policy stance as inflation remains stable within the expected range, while the Bank of Japan still operates with ultra-loose monetary policy. This interest rate differential keeps CADJPY attractive to carry traders and supports long-term bullish structure. If energy prices stay firm and Canada benefits from positive global risk sentiment, CADJPY could continue gaining strength after the wedge breakout.
However, short-term corrective movement is still visible as the market responds to profit taking and global risk fluctuations. If the wedge fails to break upward, price may retest lower support levels for liquidity before a new bullish trend leg begins. I remain focused on price reaction near structure, as break-and-retest confirmation will be key for high probability long positions.
On TradingView, falling wedge and CADJPY forecast are currently highly searched topics, reflecting strong interest in potential trend continuation setups across the Forex market. With a clean pattern, strong fundamentals, and supportive long-term structure, CADJPY holds the potential for profitable bullish opportunities once confirmation appears.

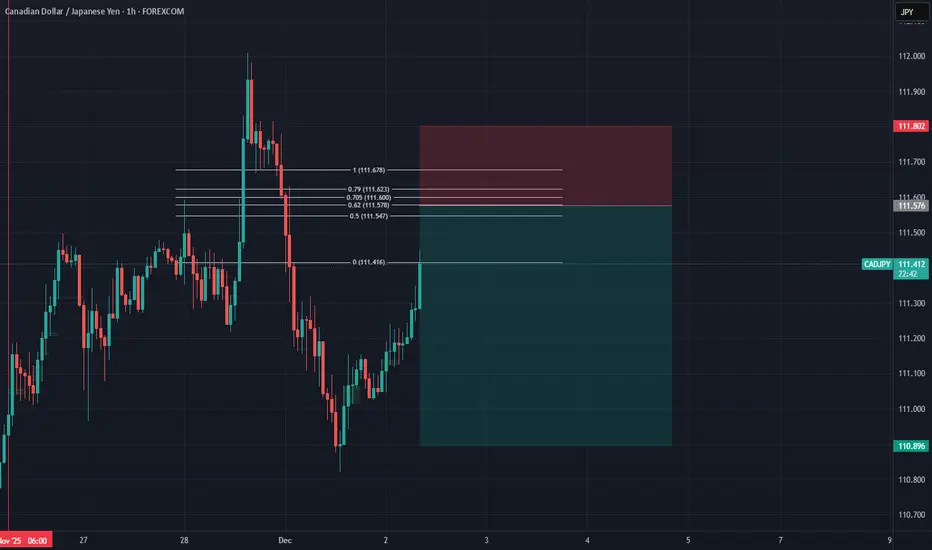
CADJPY Will Go Up! Long!
Please, check our technical outlook for CADJPY.
Time Frame: 3h
Current Trend: Bullish
Sentiment: Oversold (based on 7-period RSI)
Forecast: Bullish
The market is trading around a solid horizontal structure 111.244.
The above observations make me that the market will inevitably achieve 112.283 level.
P.S
Overbought describes a period of time where there has been a significant and consistent upward move in price over a period of time without much pullback.
Like and subscribe and comment my ideas if you enjoy them!

CAD/JPY – Wedge Breakout Pattern (21.11.2025)📝 Setup Overview OANDA:CADJPY
CAD/JPY has broken below a rising wedge structure, signaling weakening bullish momentum. After multiple rejections at the resistance zone, price is now losing steam below the Ichimoku cloud, showing early bearish pressure.A clean breakout + retest scenario opens the door for downside continuation toward the next demand zones.
📌 Trading Plan📍 Entry Idea:
Look for bearish continuation below the wedge support + cloud rejection.
🎯 Targets (Support Levels):
1st Support: 111.022
2nd Support: 110.561
🛑 Resistance Zone:
112.014 – 112.294
This zone continues to act as a strong supply area where sellers took control repeatedly.
📉 Today’s Fundamentals – Bearish CAD Bias
1️⃣ Crude Oil Pullback → Weakens CAD
Canada’s economy is heavily tied to oil prices. Today’s dip in crude oil puts pressure on the CAD, giving JPY an advantage.
2️⃣ Safe-Haven Demand Supports JPY
With global markets showing risk-off sentiment (concerns over slowing global growth + uncertain central bank guidance), investors favor safe-haven currencies like the Japanese Yen.
3️⃣ BoC Policy Tone Still Cautious
Recent Bank of Canada communications show limited confidence in economic momentum.
Markets expect slower growth → bearish CAD outlook.
➡️ Combination of oil weakness + JPY strength + wedge breakdown = bearish continuation setup.
🔖 Hashtags
#CADJPY #ForexAnalysis #PriceAction #WedgeBreakout #Ichimoku #FXTrading #TechnicalAnalysis #FundamentalAnalysis #SmartMoney #TradingViewCommunity #Kabhi_TA_Trading
⚠️ Disclaimer
This analysis is for educational purposes only.
Not financial advice. Always manage your risk and trade based on your plan.
💬 Support the Work
If you found this analysis helpful, please LIKE & COMMENT on the post ❤️
Your support motivates more high-quality setups daily!

CADJPY – Update & ExecutionYesterday, our CADJPY position was stopped out at 111.65. The trend-changing pattern between Wave 3 and Wave 4 remains valid.
The wave that broke the Wave 3 structure extended beyond expectations, and price has now confirmed a breakdown with a second lower low on the M5 timeframe.
We have re-entered short at 111.94, with a stop loss at the high of the day (112.28).
Our target remains 110.92.

CADJPY - Overbought at Resistance… Correction Ahead?⚔️CADJPY is approaching a major rejection zone around 111.00 , which aligns perfectly with the upper bound of the rising channel. Price is also showing clear overbought behavior, making this area a critical decision point for the next move.
For now, the pair remains overall bullish, trading inside a clean ascending structure. However, the current location leaves CADJPY vulnerable to a corrective move as long as the 111.00 resistance continues to hold.
If the bulls manage to break and hold above 111.00, the momentum could extend toward higher highs. But if the resistance rejects price again, we can expect a move back toward the lower trendline of the channel to reset the structure.📉
The market is now at a key inflection zone… will 111.00 act as a ceiling or fuel the next breakout? 🤔
⚠️ Disclaimer: This is not financial advice. Always do your own research and manage risk properly.
📚 Stick to your trading plan regarding entries, risk, and management.
Good luck! 🍀
All Strategies Are Good; If Managed Properly!
~Richard Nasr.

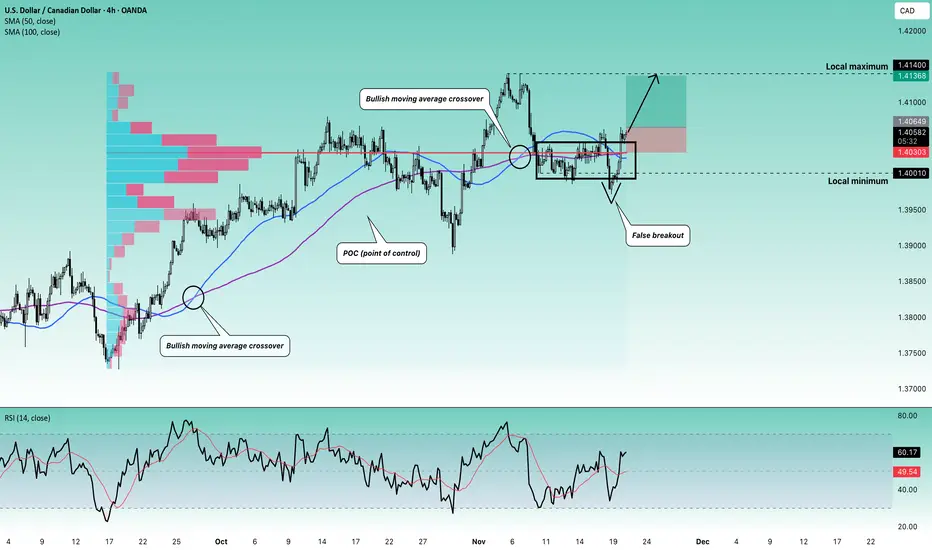
Stop!Loss|Market View: USDCAD🙌 Stop!Loss team welcomes you❗️
In this post, we're going to talk about the near-term outlook for the USDCAD currency pair☝️
Potential trade setup:
🔔Entry level: 1.40649
💰TP: 1.41368
⛔️SL: 1.40303
"Market View" - a brief analysis of trading instruments, covering the most important aspects of the FOREX market.
👇 In the comments 👇 you can type the trading instrument you'd like to analyze, and we'll talk about it in our next posts.
💬 Description: This currency pair was previously defined as a buy pair, and this one is proceeding exactly as per the previous analysis, with the buy priority remaining. Given the current context, namely, a breakout of the upper balance boundary above 1.40010, an additional, shorter-term buy trade can be considered with the same target as before, namely, near 1.41400.
Thanks for your support 🚀
Profits for all ✅
CADJPY: Ending Diagonal + RD(_) = Downtrend StartingToday, I’d like to share a Short positioning opportunity on the CADJPY pair .
In the current scenario, CADJPY is moving within a Resistance zone(112.100 JPY-109.500 JPY) and is close to a Potential Reversal Zone(PRZ) as well as the upper line of the ascending channel.
From an Elliott Wave perspective, it seems that CADJPY is completing the microwave 5 of the microwave C of the main wave Y , and the microwave 5 appears to be forming an Ending Diagonal .
Additionally, we can observe a negative Regular Divergence (RD-) between the peaks.
Fundamental analysis : Considering the above analysis, and also taking into account the fundamental conditions, Canada’s core inflation came in softer than expected, reinforcing the BoC’s easing path, while JPY benefits from the current risk-off tone. Fundamentally, CADJPY remains biased to the downside.
Finally, based on all the above, I expect that CADJPY will begin its downward trend, with a First target at 109.103 JPY
Take Profit(2): 108.543 JPY
Stop Loss(SL): 118.820 JPY(Worst)
Please respect each other's ideas and express them politely if you agree or disagree.
Canadian Dollar/ Japanese Yen Analysis (CADJPY), 4-hour time frame.
Be sure to follow the updated ideas.
Do not forget to put a Stop loss for your positions (For every position you want to open).
Please follow your strategy and updates; this is just my Idea, and I will gladly see your ideas in this post.
Please do not forget the ✅' like '✅ button 🙏😊 & Share it with your friends; thanks, and Trade safe.

CADJPY: Strong Reversal Setup - Daily MH RejectionCADJPY: Market Structure High Reversal @ Daily Momentum High
Setup Analysis:
The CADJPY has completed its wave structure followed by a Trend-Changing Pattern, signalling a potential major reversal.
Key Technical Points:
📍 The Setup:
Tuesday's high has been broken (manipulation move)
Price pushed up to the Daily Momentum High (MH)
This MH initiated the downside that created the major low
Classic liquidity grab before potential reversal
🎯 Trade Invalidation: 111.65
This is the critical level
Any trade above 111.65 invalidates the sell setup
Must respect this level for the bearish structure to remain valid
🎯 Main Target: H1 structure @ 109.55
Trade Logic:
Price manipulation above Tuesday's high swept liquidity at the Daily MH. This is where the previous major downtrend began. With wave structure complete and trend-changing pattern formed, we're watching for confirmation to trade the reversal back down to H1 structure support.
Key Principle: Let price prove the reversal. Structure breaks and manipulation moves often precede significant reversals.
👍 Hit the boost button if you found this valuable
👤 Follow for more high-probability setup analysis

Bullish momentum to extend?CAD/JPY is falling towards the pivot, which has been identified as a pullback support and could bounce to the 1st resistance, which aligns with the 100% Fibonacci projection.
Pivot: 110.59
1st Resistance: 112.07
1st Support: 109.83
Disclaimer:
The opinions given above constitute general market commentary and do not constitute the opinion or advice of IC Markets or any form of personal or investment advice.
Any opinions, news, research, analyses, prices, other information, or links to third-party sites contained on this website are provided on an "as-is" basis, are intended to be informative only, and are not advice, a recommendation, research, a record of our trading prices, an offer of, or solicitation for, a transaction in any financial instrument and thus should not be treated as such. The information provided does not involve any specific investment objectives, financial situation, or needs of any specific person who may receive it. Please be aware that past performance is not a reliable indicator of future performance and/or results. Past performance or forward-looking scenarios based upon the reasonable beliefs of the third-party provider are not a guarantee of future performance. Actual results may differ materially from those anticipated in forward-looking or past performance statements. IC Markets makes no representation or warranty and assumes no liability as to the accuracy or completeness of the information provided, nor any loss arising from any investment based on a recommendation, forecast, or any information supplied by any third party.

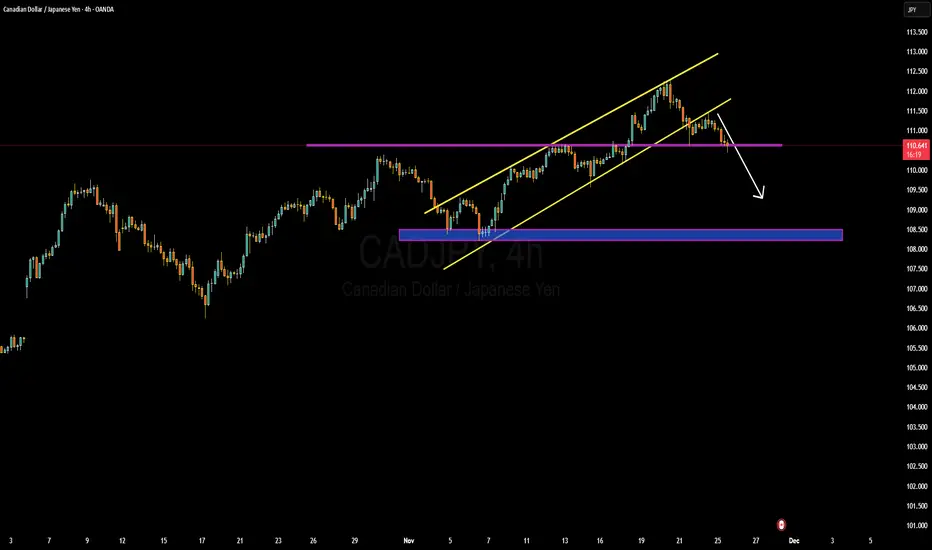
CAD/JPY SELLERS WILL DOMINATE THE MARKET|SHORT
Hello, Friends!
CAD/JPY pair is in the uptrend because previous week’s candle is green, while the price is clearly rising on the 1D timeframe. And after the retest of the resistance line above I believe we will see a move down towards the target below at 108.605 because the pair overbought due to its proximity to the upper BB band and a bearish correction is likely.
Disclosure: I am part of Trade Nation's Influencer program and receive a monthly fee for using their TradingView charts in my analysis.
✅LIKE AND COMMENT MY IDEAS✅
