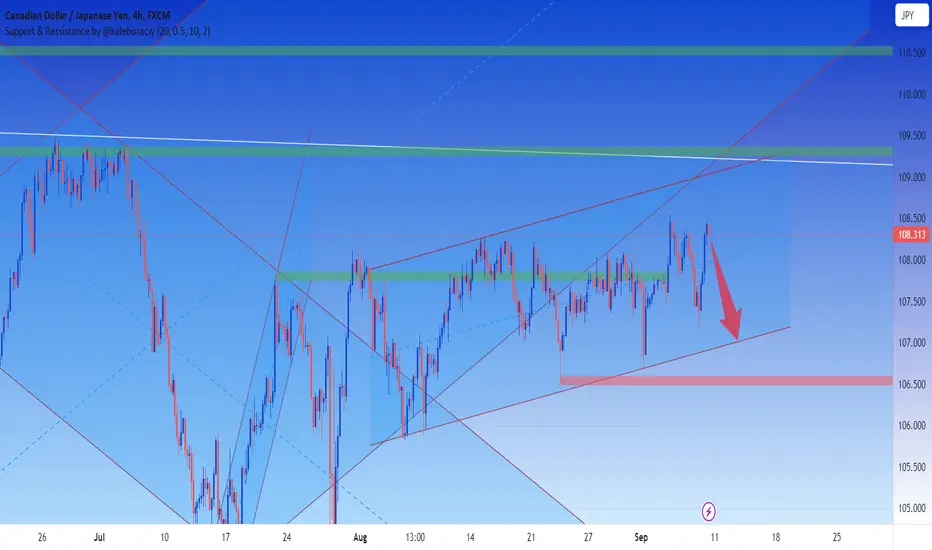
cadjpy sella good short setup for CADJPY, there is a good chance for CADJPY to start a bearish trend from here
CADJPY

CADJPY High probability of returnDue to the slowing down of the upward movement, the probability of returning from the red zone is very high.
Oscillators confirm this idea to a large extent.

CADJPY – holding for 109.50 While NOK (Norwegian krone) has the strongest statistical relationship with Brent and WTI crude, we can see a strengthening correlation between crude and the CAD. We see the 1-month correlation between crude and CADJPY at 0.68, so it's meaningful. We also see (on the daily) price breaking out of the top of its recent range of 108.50. While many will be concerned with being short JPY, given BoJ intervention risk, for now, traders remain happy to fade JPY strength as carry is still attractive (given the low volatility). Also, with crude on the rise the market sees this benefiting Canada’s terms of trade, while it negatively impacts Japan’s economics given, they are a big importer of energy. The bulls happy to hold for 109.50, stops on a daily close below the 5-Day EMA.

How I was able to Flawlessly Capture CADJPY moves all WeekHere is an explanation of how I was able to trade CADJPY without breaking a sweat. It is not hard you just need the right tools. (...And the right guy *wink*)( Just kidding.) But yes, I plug in my indicator set up and go to work. Building my account for the week. This keeps me consistent, check it out.

CADJPY Completing the shark patternAfter the completion of the shark pattern, the price had a jump towards the rise and will probably complete the 5-0 pattern

CADJPY H4 I Potential Bearish reversal?Based on the H4 chart analysis, we can see that the price is rising toward our sell entry at 107.85, which is a pullback resistance.
Our take profit will be at 107.00, an overlap support level. The stop loss will be placed at 108.47, a swing-high resistance level.
High Risk Investment Warning
Trading Forex/CFDs on margin carries a high level of risk and may not be suitable for all investors. Leverage can work against you.
Forex Capital Markets Limited (www.fxcm.com):
CFDs are complex instruments and come with a high risk of losing money rapidly due to leverage. 70% of retail investor accounts lose money when trading CFDs with this provider. You should consider whether you understand how CFDs work and whether you can afford to take the high risk of losing your money..
Stratos Europe Ltd, previously FXCM EU Ltd (www.fxcm.com):
CFDs are complex instruments and come with a high risk of losing money rapidly due to leverage. 74% of retail investor accounts lose money when trading CFDs with this provider. You should consider whether you understand how CFDs work and whether you can afford to take the high risk of losing your money.
FXCM Australia Pty. Limited (www.fxcm.com):
Trading FX/CFDs carries significant risks. FXCM AU (AFSL 309763), please read the Financial Services Guide, Product Disclosure Statement, Target Market Determination and Terms of Business at www.fxcm.com
Stratos Global LLC (www.fxcm.com):
Losses can exceed deposits.
Please be advised that the information presented on TradingView is provided to FXCM (‘Company’, ‘we’) by a third-party provider (‘TFA Global Pte Ltd’). Please be reminded that you are solely responsible for the trading decisions on your account. There is a very high degree of risk involved in trading. Any information and/or content is intended entirely for research, educational and informational purposes only and does not constitute investment or consultation advice or investment strategy. The information is not tailored to the investment needs of any specific person and therefore does not involve a consideration of any of the investment objectives, financial situation or needs of any viewer that may receive it. Kindly also note that past performance is not a reliable indicator of future results. Actual results may differ materially from those anticipated in forward-looking or past performance statements. We assume no liability as to the accuracy or completeness of any of the information and/or content provided herein and the Company cannot be held responsible for any omission, mistake nor for any loss or damage including without limitation to any loss of profit which may arise from reliance on any information supplied by TFA Global Pte Ltd.
The speaker(s) is neither an employee, agent nor representative of FXCM and is therefore acting independently. The opinions given are their own, constitute general market commentary, and do not

CADJPY RISING WEDGE Identified a rising wedge pattern on the daily CAD/JPY chart, indicating a potential upcoming downward movement with a bearish breakout. I anticipate the emergence of a bearish trend, which could result in a downward movement of over 250 pips.

CADJPY Trading IdeaBased on Simple Technical Analysis ( Trendline + Support & Resistance )
Risk Disclaimer:
Please be advised that I am not telling anyone how to spend or invest their money. Take all of my analysis as my own opinion, as entertainment, and at your own risk. I assume no responsibility or liability for any errors or omissions in the content of this page, and they are for educational purposes only. Any action you take on the information in these analysis is strictly at your own risk. There is a very high degree of risk involved in trading. Past results are not indicative of future returns. Good luck :-)
CADJPY: Swing Trading & Technical Analysis
Remember that we can not, and should not impose our will on the market but rather listen to its whims and make profit by following it. And thus shall be done today on the CADJPY pair which is likely to be pushed down by the bears so we will sell!
❤️ Please, support our work with like & comment! ❤️

CadJpy could drop to support levelSince mid-July, CadJpy has been trading inside an ascending triangle with price congestion in the last 3 weeks.
Ascending triangles are usually continuation patterns and considering the up trend of the pair, this could be the case also now.
However, a break under the support line could lead to a steep dive to important support at 102.
In my opinion, even if we have a break above the triangle's resistance, this will be a false one.
In conclusion, I'm looking to sell, either after the false break (if will be the case), or after the break of the ascending trend line down break.

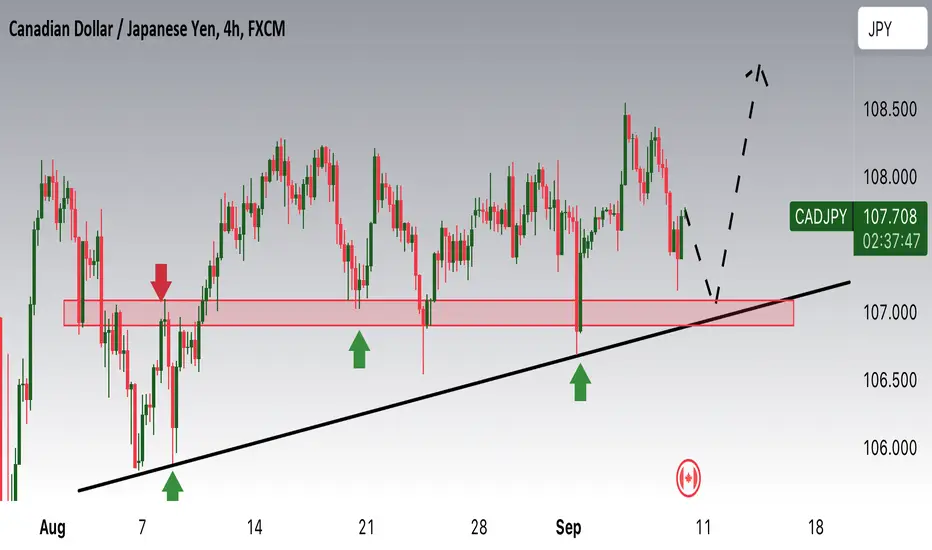
CADJPY Potential UpsidesHey Traders. In today’s trading session we are monitoring CADJPY for a buying opportunity around 107.100 zone, CADJPY is trading in an uptrend and currently is in a correction phase in which it is approaching the trend at 107.100 support and resistance area.
Trade safe, Joe.
cadjpy bearish ideacadyen is taken its previous liquidity and shifted its structure towards vdown side on on confirmatiomn we can go sells..also we have cad news later today good luck

CADJPY: The Thrilling Tale of Bulls, Flags, and Double Bottoms!The Epic Preamble
Ladies and gents, forex warriors, and chart whisperers, gather around! We've got a thriller unfolding in the grand arena of currency gladiators: the CADJPY pair! Yep, that's the Canadian Dollar squaring off against the Japanese Yen. Since the 15th of August, they've been dancing in a tight ring, neither gaining the upper hand—until now!
The Plot Thickens: Enter the Double Bottom!
Imagine the suspense in a James Bond movie when 007's trapped but finds a secret escape hatch at the last moment. That, my friends, is the CADJPY's Double Bottom Formation—a bullish signal that says, "Not today, sellers!" It's like a trampoline at the base of our range; the price bounces but doesn't break through.
The Bullish Flag: A Plot Twist We've Been Waiting For
The latest chapter in our epic saga features a glorious Bullish Flag! This wasn't just any flag; it was the Gandalf of flags, standing firm and saying, "You shall not pass!" for 21 tantalizing days. But wait, there's a twist—the flag has been shattered, and the bulls are running free! With a whopping 3.9 million USD traded during its formation, you can bet this flag was the real deal.
The Funda-Mental Supporting Cast
Now, no epic is complete without a compelling backstory:
The Canadian Chronicles: GDP figures in Canada are soaring like an eagle with a jetpack! Employment rates are holding steady like a lumberjack on a log.
The Land of the Rising Sun: Japan, known for its Samurai and sushi, isn't doing its currency any favours with an ultra-loose monetary policy.
Risk-on Showtime: The world seems to be in a mood for adventure, ditching safe havens like the Yen for more daring escapades with the Loonie (that's slang for the Canadian Dollar, eh!).
Strategy: No Room for Weak Knees!
Alright, thrill-seekers, we expect this epic tale to take a joyous turn for the Loonie. If you're in this rodeo, get ready for a wild ride upwards!
But beware, young squire, dragons still lurk in the forest of financial markets. Any slips, trips, or dips should be your cue to manage those positions like you're juggling flaming torches. Use those stop-loss orders like a knight uses a shield!
Roll Credits
There you have it—a full-on drama, comedy, and action-packed saga all rolled into one currency pair! But remember, while we might jest and jape, trading currencies is a serious business, fraught with peril and risks. Always do your due diligence, or consult your financial Gandalf before making any moves.
And that's a wrap, folks! Stay tuned for the next gripping episode in the CADJPY universe! 🎬🍿

CADJPY, Massive Ascending-Triangle, BREAKOUT Incoming!Hello There!
Welcome to my analysis about CADJPY on the 6-hour timeframe perspectives. Within the recent times CADJPY is forming a important formation that is likely to convert into a major bearish breakout to emerge in the next upcoming times especially when huge bearish volumes move in here and accelerate the trend-turning-dynamics to the downside this is a highly likely scenario to be expect next.
When looking at my chart CADJPY is forming there this paramount Descending-Channel-Formation in which CADJPY has several massive resistances within the structure firstly overly determined by the Descending-Resistance-Boundary within the Upper-Boundary of the channel formation. Furthermore, CADJPY is now completing the wave-count within the Ascending-Triangle-Formation which is pointing to a final breakout below the lower boundary to emerge in the near terms.
With a final breakout below the lower boundary CADJPY is going to setup the final continuation-origin-setup to continue into the lower spheres of the chart and accelerate heavy bearish momentum into these directions. Once CADJPY has broken out below the 65-EMA as well as the 200-EMA marked in my chart this will be a trigger for more massive and overly bearish momentum moving in to increase the bearish continuation.
Once the final targets marked in my chart have been reached it has to be determined how CADJPY continues from there on because especially when CADJPY continues with massive increased bearish momentum there is a high possibility given that CADJPY just continues into this direction and accelerates further bearish determinations. Otherwise when this is not the case and CADJPY manages to recover within this zone there is a possibility that CADJPY reverses in this zone. These determinations need to be assessed when the price-action developed here.
In this manner, thank you everybody for watching the analysis, support from your side is greatly appreciated.
VP

Text Book Cup and handle for CAD JPY- Nice buy soon!Notice I said the word SOON.
There has been a text book cup and handle formed on the CAD/JPY/
It's just about to complete the handle forming its brim (resistance).
Now only once the price breaks out, closes above and opens above the brim - will it signal a decent long.
Until then, I'm waiting.
We have other bullish signs along the way.
7>21>200
RSI >50
Target 123.20

CADJPY 1-Hour Analysis
Hey traders! 👋 Let's dive into a technical analysis of CADJPY on the 1-hour chart. We've got some interesting insights to share!
📊 **Analysis** 📊
- **Time Frame:** 1 Hour
- **Overall Trend:** Sideways
- **Divergence:** None
- **Trend Patterns:** None
- **Reversal Patterns:** None
Based on our analysis, we've identified potential buy and sell stop setups. Here are the details:
**Buy Stop Trade Plan** 📈
- **Entry:** 107.938
- **Stop Loss:** 107.828
- **Take Profit:** 108.047
**Sell Stop Trade Plan** 📉
- **Entry:** 107.576
- **Stop Loss:** 107.654
- **Take Profit:** 107.498
📊 **Trade Rationale** 📊
The CADJPY pair is currently in a sideways trend with no clear divergence or trend continuation/reversal patterns. We're looking for potential breakout opportunities.
💡 **Investment Advice** 💡
Please remember that trading carries risks, and it's essential to manage your risk accordingly. Make sure to set stop-loss orders and only invest what you can afford to lose. Also, consider diversifying your portfolio to minimize risk.
This analysis is for educational and informational purposes only. It's crucial to conduct your research and, if possible, consult with a financial advisor before making any trading decisions.
Stay tuned for updates, and happy trading! 🚀💰 #ForexTrading #TradingStrategy #InvestWisely
