CADJPYMarket Structure
Trend Before Reversal
Strong bullish move from early October to mid-November.
Structure formed a rising wedge → classic exhaustion pattern.
Liquidity Trap Identified
Price spiked above 111.440, grabbed liquidity, then immediately reversed.
This is labeled “TRAP” on your chart.
Such moves usually mark:
→ End of bullish trend
→ Beginning of distribution
This kind of wick is typically engineered to trap breakout buyers before institutions reverse price.
CADJPY

CADJPY Forming Falling WedgeCADJPY is currently forming a falling wedge pattern, which is often seen as a bullish reversal setup after a corrective decline. On the chart, price has pulled back from recent highs and is now compressing within descending support and resistance lines, showing decreasing volatility and seller exhaustion. This type of price action generally signals that buyers may soon step back in, especially if the pair breaks out above the wedge resistance with strong momentum. As a professional trader, I am monitoring the pattern for a potential upside continuation if the breakout confirms with volume and candle body expansion.
Fundamentally, CADJPY remains influenced by diverging central bank sentiment. The Bank of Canada continues to maintain a controlled policy stance as inflation remains stable within the expected range, while the Bank of Japan still operates with ultra-loose monetary policy. This interest rate differential keeps CADJPY attractive to carry traders and supports long-term bullish structure. If energy prices stay firm and Canada benefits from positive global risk sentiment, CADJPY could continue gaining strength after the wedge breakout.
However, short-term corrective movement is still visible as the market responds to profit taking and global risk fluctuations. If the wedge fails to break upward, price may retest lower support levels for liquidity before a new bullish trend leg begins. I remain focused on price reaction near structure, as break-and-retest confirmation will be key for high probability long positions.
On TradingView, falling wedge and CADJPY forecast are currently highly searched topics, reflecting strong interest in potential trend continuation setups across the Forex market. With a clean pattern, strong fundamentals, and supportive long-term structure, CADJPY holds the potential for profitable bullish opportunities once confirmation appears.

CADJPY Will Go Up! Long!
Please, check our technical outlook for CADJPY.
Time Frame: 3h
Current Trend: Bullish
Sentiment: Oversold (based on 7-period RSI)
Forecast: Bullish
The market is trading around a solid horizontal structure 111.244.
The above observations make me that the market will inevitably achieve 112.283 level.
P.S
Overbought describes a period of time where there has been a significant and consistent upward move in price over a period of time without much pullback.
Like and subscribe and comment my ideas if you enjoy them!

CAD/JPY – Wedge Breakout Pattern (21.11.2025)📝 Setup Overview OANDA:CADJPY
CAD/JPY has broken below a rising wedge structure, signaling weakening bullish momentum. After multiple rejections at the resistance zone, price is now losing steam below the Ichimoku cloud, showing early bearish pressure.A clean breakout + retest scenario opens the door for downside continuation toward the next demand zones.
📌 Trading Plan📍 Entry Idea:
Look for bearish continuation below the wedge support + cloud rejection.
🎯 Targets (Support Levels):
1st Support: 111.022
2nd Support: 110.561
🛑 Resistance Zone:
112.014 – 112.294
This zone continues to act as a strong supply area where sellers took control repeatedly.
📉 Today’s Fundamentals – Bearish CAD Bias
1️⃣ Crude Oil Pullback → Weakens CAD
Canada’s economy is heavily tied to oil prices. Today’s dip in crude oil puts pressure on the CAD, giving JPY an advantage.
2️⃣ Safe-Haven Demand Supports JPY
With global markets showing risk-off sentiment (concerns over slowing global growth + uncertain central bank guidance), investors favor safe-haven currencies like the Japanese Yen.
3️⃣ BoC Policy Tone Still Cautious
Recent Bank of Canada communications show limited confidence in economic momentum.
Markets expect slower growth → bearish CAD outlook.
➡️ Combination of oil weakness + JPY strength + wedge breakdown = bearish continuation setup.
🔖 Hashtags
#CADJPY #ForexAnalysis #PriceAction #WedgeBreakout #Ichimoku #FXTrading #TechnicalAnalysis #FundamentalAnalysis #SmartMoney #TradingViewCommunity #Kabhi_TA_Trading
⚠️ Disclaimer
This analysis is for educational purposes only.
Not financial advice. Always manage your risk and trade based on your plan.
💬 Support the Work
If you found this analysis helpful, please LIKE & COMMENT on the post ❤️
Your support motivates more high-quality setups daily!

CADJPY – Update & ExecutionYesterday, our CADJPY position was stopped out at 111.65. The trend-changing pattern between Wave 3 and Wave 4 remains valid.
The wave that broke the Wave 3 structure extended beyond expectations, and price has now confirmed a breakdown with a second lower low on the M5 timeframe.
We have re-entered short at 111.94, with a stop loss at the high of the day (112.28).
Our target remains 110.92.

CADJPY - Overbought at Resistance… Correction Ahead?⚔️CADJPY is approaching a major rejection zone around 111.00 , which aligns perfectly with the upper bound of the rising channel. Price is also showing clear overbought behavior, making this area a critical decision point for the next move.
For now, the pair remains overall bullish, trading inside a clean ascending structure. However, the current location leaves CADJPY vulnerable to a corrective move as long as the 111.00 resistance continues to hold.
If the bulls manage to break and hold above 111.00, the momentum could extend toward higher highs. But if the resistance rejects price again, we can expect a move back toward the lower trendline of the channel to reset the structure.📉
The market is now at a key inflection zone… will 111.00 act as a ceiling or fuel the next breakout? 🤔
⚠️ Disclaimer: This is not financial advice. Always do your own research and manage risk properly.
📚 Stick to your trading plan regarding entries, risk, and management.
Good luck! 🍀
All Strategies Are Good; If Managed Properly!
~Richard Nasr.

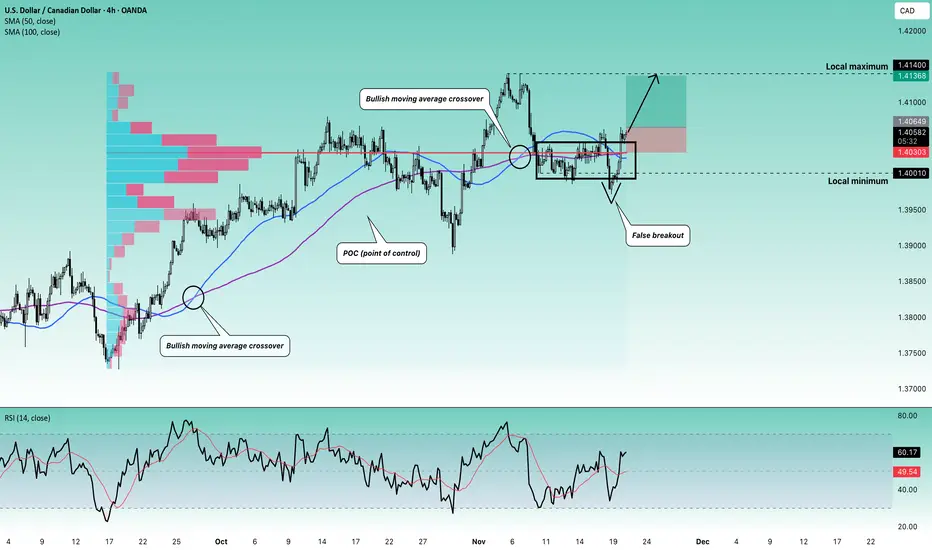
Stop!Loss|Market View: USDCAD🙌 Stop!Loss team welcomes you❗️
In this post, we're going to talk about the near-term outlook for the USDCAD currency pair☝️
Potential trade setup:
🔔Entry level: 1.40649
💰TP: 1.41368
⛔️SL: 1.40303
"Market View" - a brief analysis of trading instruments, covering the most important aspects of the FOREX market.
👇 In the comments 👇 you can type the trading instrument you'd like to analyze, and we'll talk about it in our next posts.
💬 Description: This currency pair was previously defined as a buy pair, and this one is proceeding exactly as per the previous analysis, with the buy priority remaining. Given the current context, namely, a breakout of the upper balance boundary above 1.40010, an additional, shorter-term buy trade can be considered with the same target as before, namely, near 1.41400.
Thanks for your support 🚀
Profits for all ✅
CADJPY: Ending Diagonal + RD(_) = Downtrend StartingToday, I’d like to share a Short positioning opportunity on the CADJPY pair .
In the current scenario, CADJPY is moving within a Resistance zone(112.100 JPY-109.500 JPY) and is close to a Potential Reversal Zone(PRZ) as well as the upper line of the ascending channel.
From an Elliott Wave perspective, it seems that CADJPY is completing the microwave 5 of the microwave C of the main wave Y , and the microwave 5 appears to be forming an Ending Diagonal .
Additionally, we can observe a negative Regular Divergence (RD-) between the peaks.
Fundamental analysis : Considering the above analysis, and also taking into account the fundamental conditions, Canada’s core inflation came in softer than expected, reinforcing the BoC’s easing path, while JPY benefits from the current risk-off tone. Fundamentally, CADJPY remains biased to the downside.
Finally, based on all the above, I expect that CADJPY will begin its downward trend, with a First target at 109.103 JPY
Take Profit(2): 108.543 JPY
Stop Loss(SL): 118.820 JPY(Worst)
Please respect each other's ideas and express them politely if you agree or disagree.
Canadian Dollar/ Japanese Yen Analysis (CADJPY), 4-hour time frame.
Be sure to follow the updated ideas.
Do not forget to put a Stop loss for your positions (For every position you want to open).
Please follow your strategy and updates; this is just my Idea, and I will gladly see your ideas in this post.
Please do not forget the ✅' like '✅ button 🙏😊 & Share it with your friends; thanks, and Trade safe.

CADJPY: Strong Reversal Setup - Daily MH RejectionCADJPY: Market Structure High Reversal @ Daily Momentum High
Setup Analysis:
The CADJPY has completed its wave structure followed by a Trend-Changing Pattern, signalling a potential major reversal.
Key Technical Points:
📍 The Setup:
Tuesday's high has been broken (manipulation move)
Price pushed up to the Daily Momentum High (MH)
This MH initiated the downside that created the major low
Classic liquidity grab before potential reversal
🎯 Trade Invalidation: 111.65
This is the critical level
Any trade above 111.65 invalidates the sell setup
Must respect this level for the bearish structure to remain valid
🎯 Main Target: H1 structure @ 109.55
Trade Logic:
Price manipulation above Tuesday's high swept liquidity at the Daily MH. This is where the previous major downtrend began. With wave structure complete and trend-changing pattern formed, we're watching for confirmation to trade the reversal back down to H1 structure support.
Key Principle: Let price prove the reversal. Structure breaks and manipulation moves often precede significant reversals.
👍 Hit the boost button if you found this valuable
👤 Follow for more high-probability setup analysis

Bullish momentum to extend?CAD/JPY is falling towards the pivot, which has been identified as a pullback support and could bounce to the 1st resistance, which aligns with the 100% Fibonacci projection.
Pivot: 110.59
1st Resistance: 112.07
1st Support: 109.83
Disclaimer:
The opinions given above constitute general market commentary and do not constitute the opinion or advice of IC Markets or any form of personal or investment advice.
Any opinions, news, research, analyses, prices, other information, or links to third-party sites contained on this website are provided on an "as-is" basis, are intended to be informative only, and are not advice, a recommendation, research, a record of our trading prices, an offer of, or solicitation for, a transaction in any financial instrument and thus should not be treated as such. The information provided does not involve any specific investment objectives, financial situation, or needs of any specific person who may receive it. Please be aware that past performance is not a reliable indicator of future performance and/or results. Past performance or forward-looking scenarios based upon the reasonable beliefs of the third-party provider are not a guarantee of future performance. Actual results may differ materially from those anticipated in forward-looking or past performance statements. IC Markets makes no representation or warranty and assumes no liability as to the accuracy or completeness of the information provided, nor any loss arising from any investment based on a recommendation, forecast, or any information supplied by any third party.

CAD/JPY SELLERS WILL DOMINATE THE MARKET|SHORT
Hello, Friends!
CAD/JPY pair is in the uptrend because previous week’s candle is green, while the price is clearly rising on the 1D timeframe. And after the retest of the resistance line above I believe we will see a move down towards the target below at 108.605 because the pair overbought due to its proximity to the upper BB band and a bearish correction is likely.
Disclosure: I am part of Trade Nation's Influencer program and receive a monthly fee for using their TradingView charts in my analysis.
✅LIKE AND COMMENT MY IDEAS✅

CADJPY: Trade Plan Pullback Setup Targeting External Range HighsTaking a closer look at CAD/JPY, the pair continues to hold a bullish trend structure, with higher-timeframe price action breaking to the upside 📈. When we look left on both the daily and weekly charts, we can clearly see two external liquidity targets — the external range highs, which remain the logical draw on price 🎯.
At this stage, I’m anticipating a retracement on the 30-minute timeframe. If price pulls back into discount and we then see a bullish market structure break, I’ll be looking for a long setup from that point 🚀.
Stop-loss placement is discussed in detail in the video.
Not financial advice. ⚠️

Currency Market State of Play - Week Ahead StrategyMONDAY MARKET OVERVIEW - Currency State of Play
Starting the week with a clear analysis of major currency pairs and potential trading opportunities.
📊 EURUSD
Bias: Sell opportunity
Key Level: Above 1.1624
Setup: Watching for sell signals above this level for downside continuation
📊 GBPUSD
Bias: Neutral
Status: Noisy price action with no clear directional reference
Strategy: Stay patient, wait for structure to develop
📊 USDJPY
Bias: Bearish lean
Key Level: 154.59
Setup: Sell on 2nd break below 154.59. Buy is technically possible, but overall price action shows weakness—proceed with caution
📊 CADJPY
Bias: Transitional
Friday's Action: Sold off and then reversed to buying
Current Status: Price searching for direction above the last Momentum High (MH)
Strategy: Best selling opportunity below 110.13
This Week's Approach:
This is my Monday overview to frame the week ahead. I'll be posting detailed analysis on individual pairs as price action develops throughout the week.
Key Principle: Wait for a clear structure, react to price behaviour, and let the setups come to you. Patience is part of the edge.
👍 Hit the boost button if you found this helpful
👤 Follow for detailed pair analysis throughout the week

Short cadjpyI waiting for Cadjpy to retrace into the Fvg of this 4hr timeframe. Risk to reward is 1:4. Use high of Fvg as stop loss

FINAL TRADE OF THE WEEK: CADJPY Follow-Through ExecutionSetup Analysis:
CADJPY formed a Momentum Low yesterday, followed by a sustained pullback/sideways pattern that established our structural point. This consolidation created the perfect setup for a continuation entry.
Trade Execution:
Entry triggered this afternoon after the break of the internal wave structure, confirming Sellers conviction and follow-through.
Trade Management:
Strong momentum immediately after entry
Target 2 (T2) achieved in under 2 hours
Profit: +50 pips
Exit Decision:
Position closed at T2 after price displayed strong reversal signals. This is mechanical trading—take profits when price action shows the move is exhausted.
Key Lesson:
The best trades are the ones where:
✅ Structure is clear
✅ Entry confirms momentum
✅ Price moves decisively in your favour
✅ You exit with discipline when reversal patterns emerge
This is the WavesOfSuccess methodology in action—patience for setup, precision on entry, discipline on exit.
Result: +50 pips in under 2 hours ✅
Have a blessed weekend! 🙏
👍 Hit the boost button if you found this valuable
👤 Follow for more educational trading content

CAD/JPY: Multiple Time Frame Analysis & PlanFollowing a breakthrough of a significant daily structural resistance yesterday.
📈CADJPY is currently consolidating within a horizontal range on an hourly timeframe.
For those seeking an intraday buying opportunity, a bullish breach of the range's resistance, specifically an hourly candle closing above 110.65, would provide a strong bullish confirmation.
A subsequent bullish continuation would then be anticipated, at least to the 111.00 level.

CAD/JPY BEST PLACE TO BUY FROM|LONG
Hello, Friends!
It makes sense for us to go long on CAD/JPY right now from the support line below with the target of 110.285 because of the confluence of the two strong factors which are the general uptrend on the previous 1W candle and the oversold situation on the lower TF determined by it’s proximity to the lower BB band.
Disclosure: I am part of Trade Nation's Influencer program and receive a monthly fee for using their TradingView charts in my analysis.
✅LIKE AND COMMENT MY IDEAS✅

CADJPY carry trade gains traction with iH&S, targets 118+The CADJPY carry trade is in focus as the yen stays weak and risk appetite lifts CAD toward a bigger breakout from an inverse head-and-shoulders base.
Japan’s new PM, Takaichi, leans pro‑stimulus, while the BOJ signals no December hike, leaving JPY structurally soft. At the same time, Canada benefits from improved risk tone and a stable BOC policy, which supports CAD strength.
Key drivers
Structural JPY weakness: A stimulus-first stance and low-rate BOJ keep carry demand elevated, but intervention talk remains a headline risk.
CAD tailwinds: US reopening-driven risk-on, oil support, and BOC on hold underpin the loonie.
Technicals: An inverse H&S with a neckline projection toward 116–117, with a recent retest near 108–109 holding the line and RSI having room to push higher.
Levels: supports at 110.00, then 109.50/108.30, and resistances at 111.50, 112.20, and 115.10, with the measured move pointing toward 116.5–118 from the neckline break.
Bias stays long above 110. Buy dips, invalidate below 108, and scale targets at 111.50, 112.20, and 115.10, leaving a runner at 116.5–118 if the first neckline peak holds.
This content is not directed to residents of the EU or UK. Any opinions, news, research, analyses, prices or other information contained on this website is provided as general market commentary and does not constitute investment advice. ThinkMarkets will not accept liability for any loss or damage including, without limitation, to any loss of profit which may arise directly or indirectly from use of or reliance on such information.

Stop!Loss|Market View: USDCAD🙌 Stop!Loss team welcomes you❗️
In this post, we're going to talk about the near-term outlook for the USDCAD currency pair☝️
Potential trade setup:
🔔Entry level: 1.39721
💰TP: 1.41321
⛔️SL: 1.39021
"Market View" - a brief analysis of trading instruments, covering the most important aspects of the FOREX market.
👇 In the comments 👇 you can type the trading instrument you'd like to analyze, and we'll talk about it in our next posts.
💬 Description: Strengthening of the USD is expected in the near future, as noted in previous reviews. Against this backdrop, the Canadian dollar could demonstrate one of the most effective moves in favor of the USD. The buying zone is currently located in the range of 1.39400 - 1.40010. The most likely scenario is an upward reversal from this area with a target of resistance at 1.41400.
Thanks for your support 🚀
Profits for all ✅
❗️ Updates on this idea can be found below 👇

CADJPY FREE SIGNAL|LONG|
✅CADJPY swept equal lows and shifted structure bullish after tapping a key discount zone. Price is likely to rebalance inefficiency toward premium liquidity above.
—————————
Entry: 110.512
Stop Loss: 110.239
Take Profit: 110.969
Time Frame: 4H
—————————
LONG🚀
✅Like and subscribe to never miss a new idea!✅

CADJPY: Two Key Scenarios for the Next Pro-Trend LongAfter breaking out of the global range, the instrument has started a correction on the 4H structure, which could potentially transition to the daily structure.
If the corrective decline continues, there will be two potential reversal levels on the price's path inside the Daily Order Block for a continuation of the uptrend. The minimum target is an update of the January 6 high.
The first scenario involves a reversal from the Daily 61.8% Fibonacci retracement level . Upon reaching it, the price must find acceptance above it.
If this level is broken, the next opportunity to consider a long position will be upon reaching the 78.6% Fib level . The condition for the long setup to form will also be the price finding acceptance above this level upon its arrival.
~~~~~~~~~~~~~~~~~~~~~~~~~~~~~~~~~~~~~~~~~~~~~~~~~~~~~~~~~~~~~~~~~
The principles and conditions for forming the manipulation zones I show in this trade idea are detailed in my educational publication, which was chosen by TradingView for the "Editor's Picks" category and received a huge amount of positive feedback from this insightful trading community. To better understand the logic I've used here and the general principles of price movement in most markets from the perspective of institutional capital, I highly recommend checking out this guide if you haven't already. 👇
P.S. This is not a prediction of the exact price direction. It is a description of high-probability setups that become valid only if specific conditions are met when the price reaches the marked POI. If the conditions are not met, the setups are invalid. No setup has a 100% success rate, so if you decide to use this trade idea, always apply a stop-loss and proper risk management. Trade smart.
~~~~~~~~~~~~~~~~~~~~~~~~~~~~~~~~~~~~~~~~~~~~~~~~~~~~~~~~~~~~~~~~~
If you found this analysis helpful, support it with a Boost! 🚀
Have a question or your own view on this idea? Share it in the comments. 💬
► Follow me on TradingView for timely updates on THIS idea (entry, targets & live trade management) and not to miss my next detailed breakdown.
~~~~~~~~~~~~~~~~~~~~~~~~~~~~~~~~~~~~~~~~~~~~~~~~~~~~~~~~~~~~~~~~~

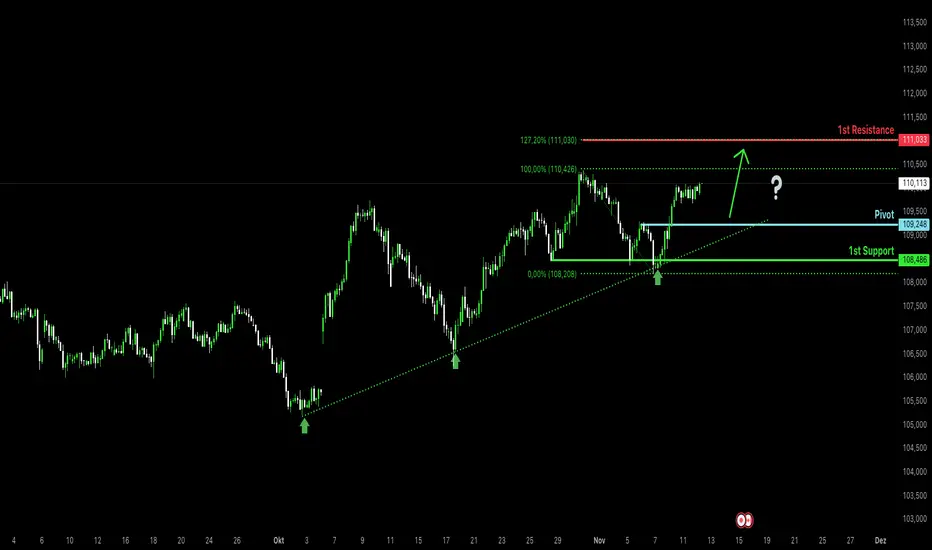
Bullish momentum to extend?CAD/JPY is declining toward the pivot level, which has been identified as a pullback support. A rebound from this area could target the first resistance level, aligning with the 127.2% Fibonacci extension.
Pivot: 109.24
1st Support: 108.8
1st Resistance: 111.03
Disclaimer:
The above opinions given constitute general market commentary, and do not constitute the opinion or advice of IC Markets or any form of personal or investment advice.
Any opinions, news, research, analyses, prices, other information, or links to third-party sites contained on this website are provided on an "as-is" basis, are intended only to be informative, is not an advice nor a recommendation, nor research, or a record of our trading prices, or an offer of, or solicitation for a transaction in any financial instrument and thus should not be treated as such. The information provided does not involve any specific investment objectives, financial situation and needs of any specific person who may receive it. Please be aware, that past performance is not a reliable indicator of future performance and/or results. Past Performance or Forward-looking scenarios based upon the reasonable beliefs of the third-party provider are not a guarantee of future performance. Actual results may differ materially from those anticipated in forward-looking or past performance statements. IC Markets makes no representation or warranty and assumes no liability as to the accuracy or completeness of the information provided, nor any loss arising from any investment based on a recommendation, forecast or any information supplied by any third-party.
CADJPY Downtrend Continuation - WavesOfSuccess MethodologyTrade Execution:
Wednesday, 11th November 2025 @ 09:35 GMT
Entry triggered after price closed below the Momentum Low bar at 110.01, confirming downtrend continuation.
Trade Management:
Entry: 110.01
Stop Loss (Invalidation): 110.08
Risk: -8.6 pips
Target: 109.73 (Fibonacci 76.4% retracement to -23.6% extension)
Risk: Reward Ratio: 3.06:1 (Risking 8.6 pips to capture 26.1 pips)
Result:
Target achieved at 13:28 GMT after New York session open. ✅
The Psychological Edge - How to Behave While in Trade
This is MORE important than technical analysis. Master these five fundamental truths:
1️⃣ Anything can happen in the market
2️⃣ Every moment is unique
3️⃣ An edge is just an indication of higher probability
4️⃣ There will be random distribution between wins and losses
5️⃣ I don't need to know what happens next
The key: Follow your mechanical rules, manage your risk, and let probability work in your favour over time.
This is mechanical trading. This is the WavesOfSuccess methodology.
If you found this valuable:
👍 Hit the boost button
👤 Follow for more trade breakdowns and education
