SHORT ON CAD/JPYCAD/JPY has pulled back to a major supply area and is currently showing bearish pressure/momentum on the lower timeframe.
The Jpy index is also starting to rise from a demand are which will impact cad/jpy falling more.
I am looking to catch 300-400 pips this week selling cadjpy to the next demand zone.
Cadjpyshort

CADJPY Will Go Down!
HI,Traders !
#CADJPY made a bearish
Breakout of the rising support
And is now consolidating
Below the line so we are
Bearish biased and we will
Be expecting a further
Bearish continuation !
Comment and subscribe to help us grow !

CADJPY Sell Opportunity (Retracement)Price will sell off and test the 50.0-61.8 Fib level before bullish trend continuation.
The retracement and test of the 50.0 fib level will create a HL.

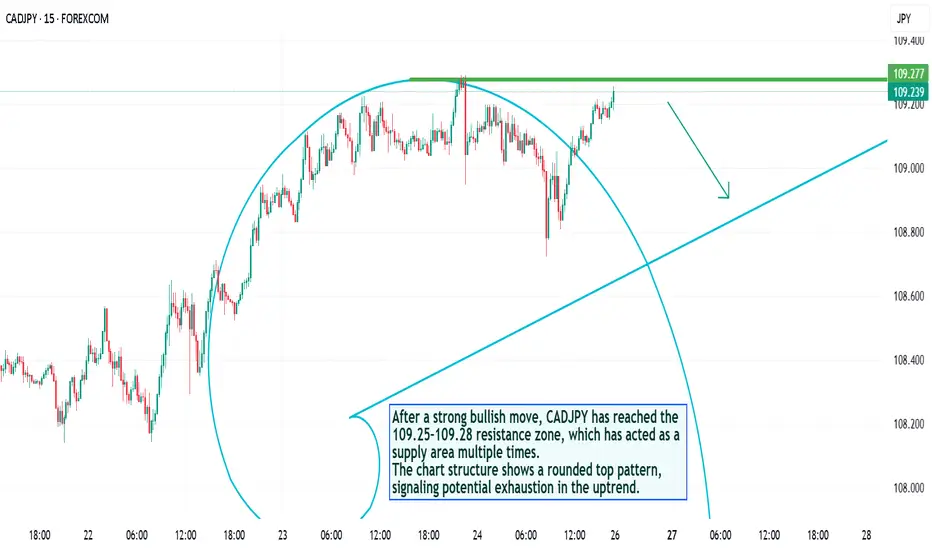
CADJPY – Rounded Top Reversal Forming at Key ResistanceAfter a strong bullish move, CADJPY has reached the 109.25–109.28 resistance zone, which has acted as a supply area multiple times.
The chart structure shows a rounded top pattern, signaling potential exhaustion in the uptrend.
💡 Technical View:
Price repeatedly rejected from 109.27 zone.
Rounded top indicates weakening buying momentum.
A descending curve formation suggests upcoming bearish correction.
Rising trendline below (around 108.80–108.60) could be the next target zone.
📉 Trade Setup (Signal):
Entry (Sell): below 109.20
Stop Loss: 109.35
Take Profit 1: 108.90
Take Profit 2: 108.60
🧭 Bias: Short-term bearish
💬 Expecting price to turn down after testing resistance. If the pair breaks above 109.35 with volume, bearish view becomes invalid.
CAD/JPY: Bearish Breakdown to 101.92?FX:CADJPY is displaying strong bearish signals on the daily chart , with price adhering to a downward trendline established since July 11th, forming successive lower highs that underscore persistent downward momentum . The highlighted " Compress Pattern " at the lower end suggests a period of consolidation and price compression, often preceding a volatile breakout to the downside as sellers build pressure against key supports.
Entry zone between 108.86-109.75 for a short position. First target at 101.75 (risk-reward >1:2.5) , second at 101.92 (risk-reward >1:5.5) near major support zones. Set a stop loss on a close above 110.05 to guard against an upside reversal. Seek confirmation through a decisive break below the entry with elevated volume. 🌟
Fundamentally , this week we have Canada's inflation rate report, which significantly impacts CAD—recent data shows September YoY inflation at 1.9% and core at 2.6%, potentially influencing BoC policy. Additionally, Japan's trade balance report this week could introduce volatility to JPY, with the Merchandise Trade Balance Total scheduled for October 22st. 💡
📝 Trade Plan:
✅ Entry Zone: 108.86 – 109.75 (short entry near resistance/trendline)
❌ Stop Loss: Close above 110.05
🎯 Targets:
TP1: 107.75 (R:R > 1:2.5)
TP2: 101.92 (R:R > 1:5.5)
What's your perspective on this setup? Share in the comments! 👇

mrmoney limited CAD/JPY position trading ideaprice is reacting from our key monthly resistance level which gave us bearish momentum just waiting for the present monthly candle to close below the resistance level we look for shorts

CADJPY Fading the Rally Bears Target 105.40 After Sharp ReversalCADJPY surged to fresh highs near 109.70 but quickly lost momentum, with sellers stepping in and pushing the pair lower. This sharp rejection hints at a possible top formation, especially as oil prices soften and Canadian data highlight labor market slack. With the Bank of Japan still dovish but domestic politics increasing uncertainty, CADJPY now looks vulnerable to deeper retracements, bringing key support zones into focus.
Current Bias
Bearish – Recent rejection at resistance strengthens the case for a corrective move lower toward 107.30 and potentially 105.40.
Key Fundamental Drivers
Canada: September labor force survey showed employment gains (+60k) but unemployment steady at 7.1%, signaling economic slack despite wage growth cooling to ~3.3% y/y.
Japan: BOJ policy remains accommodative, but political uncertainty and wage negotiations add a backdrop of yen volatility.
Commodities: Oil, Canada’s key export, has softened from recent highs, weighing on CAD support.
Macro Context
Interest Rates: BoC seen as patient, with markets pricing slower easing despite elevated unemployment. BOJ stays dovish, but political pressures could gradually shift expectations.
Economic Growth: Canada is slowing, while Japan’s growth remains modest but wage-driven improvements keep the yen in play.
Geopolitics & Trade: Trump tariffs and global trade risks weigh more heavily on CAD than JPY, as Japan benefits from safe-haven flows.
Primary Risk to the Trend
A sharp rebound in oil or a dovish shift in BoJ communication could limit JPY gains and re-strengthen CADJPY.
Most Critical Upcoming News/Event
Canada CPI – inflation readings will determine how patient the BoC can remain.
BOJ commentary – any shift in tone on policy normalization could lift JPY across the board.
Leader/Lagger Dynamics
CADJPY tends to be a lagger, following moves in oil and USDJPY. It often amplifies volatility seen in broader JPY crosses like EURJPY and GBPJPY.
Key Levels
Support Levels:
107.30
105.40
Resistance Levels:
109.20
110.10
Stop Loss (SL): 110.10
Take Profit (TP): 105.40
Summary: Bias and Watchpoints
CADJPY has shifted into bearish territory after rejecting 109.70, with momentum now pointing to downside targets at 107.30 and 105.40. The fundamental backdrop favors JPY resilience amid global risk caution and CAD softness tied to weaker oil and labor slack. A protective stop sits at 110.10, while take profit aligns with the 105.40 zone. Keep an eye on Canada CPI and BOJ rhetoric, as either could trigger sharp swings.

CADJPY Bearish Breakout!
HI,Traders !
#CADJPY made a bearish
Breakout of the key horizontal
Level of 106.048 and the
Breakout is confirmed so
We are bearish biased and
We will be expecting a
Further bearish move down !
Comment and subscribe to help us grow !

CADJPY Momentum Stalls, Sellers Look for ControlCADJPY has tested the 107.40 zone but failed to sustain a breakout, suggesting fading bullish momentum. With oil prices struggling to find direction and the yen attempting to stabilize after weeks of weakness, sellers are circling. The chart structure points to a potential corrective leg lower if the pair breaks under near-term support.
Current Bias
Bearish – the pair shows signs of exhaustion near resistance, with downside levels now in focus.
Key Fundamental Drivers
Bank of Japan: Still accommodative, but the risk of verbal intervention increases as yen weakness deepens.
Bank of Canada: Expected to lean dovish after weak GDP and labor data, leaving CAD vulnerable.
Oil Prices: CAD remains tied to energy performance; lower oil tends to weaken CAD.
Macro Context
Interest Rates: BoC rate cut bets have increased, while BoJ policy remains ultra-loose, although rising JGB yields may offer some yen support.
Growth Trends: Canadian economy shows signs of stagflation risk (weak growth, sticky inflation), reducing CAD’s appeal.
Commodity Flows: Oil volatility directly impacts CADJPY, with recent weakness adding to pressure.
Geopolitics: Energy trade flows and Middle East tensions could ripple into oil and CAD sentiment.
Primary Risk to the Trend
A sharp rebound in oil prices or BoJ hesitation to tolerate further yen strength could invalidate the bearish case.
Most Critical Upcoming News/Event
Canada GDP and inflation reports
BoJ commentary/intervention signals
OPEC-related oil output headlines
Leader/Lagger Dynamics
CADJPY often acts as a lagger, following moves in oil and broader yen crosses like USDJPY and EURJPY. Watch USDJPY for early signals on yen direction and oil prices for CAD momentum.
Key Levels
Support Levels: 106.45, 105.95, 104.98
Resistance Levels: 107.44, 108.05
Stop Loss (SL): 108.05 (above recent highs)
Take Profit (TP): 106.45 (first target), 105.95 (secondary target), 104.98 (extended target)
Summary: Bias and Watchpoints
CADJPY carries a bearish bias as resistance holds at 107.40–108.00 and sellers push for a move toward 106.45 and below. Stop loss sits just above 108.05 to protect against false breakouts, while take profit levels extend toward 105.95 and 104.98. The pair remains heavily influenced by oil and yen sentiment, making it more of a lagger than a leader. Watch oil headlines and BoJ remarks closely, as they could shift momentum quickly.

CADJPY Sellers Target Key Support as Momentum FadesCADJPY has slipped after failing to sustain momentum above the 107 handle, and the price action now leans toward renewed downside pressure. The chart structure shows repeated rejections and lower highs forming, which opens the door for a deeper pullback. With oil prices struggling to hold gains and JPY catching periodic safe-haven bids, this cross looks vulnerable to further declines.
Current Bias
Bearish – CADJPY is showing weakness with sellers eyeing lower support levels.
Key Fundamental Drivers
CAD: Weak Canadian labor market data and rising BoC rate cut expectations pressure CAD. Oil prices remain soft, removing an important support pillar.
JPY: The yen continues to benefit from safe-haven demand, especially during global risk-off waves and BoJ’s gradual steps toward yield control adjustments.
Yield spreads: Narrowing spreads between CAD and JPY rates reduce CADJPY’s carry appeal.
Macro Context
Interest rates: The BoC is leaning dovish after weak jobs and growth numbers, while the BoJ’s cautious shift away from ultra-loose policy provides structural support to the yen.
Growth trends: Canada faces slowing growth amid weaker domestic demand, while Japan’s growth remains modest but steady.
Commodities: Oil weakness weighs on CAD.
Geopolitical: Risk-off events (tariff disputes, Middle East tensions) tend to favor JPY strength, amplifying CADJPY downside.
Primary Risk to the Trend
A sharp recovery in oil prices or a stronger-than-expected Canadian economic release could lift CAD and cap downside momentum in this pair.
Most Critical Upcoming News/Event
Canada CPI and retail sales for confirmation of BoC’s dovish outlook.
BoJ policy commentary for clarity on yield control and inflation stance.
Leader/Lagger Dynamics
CADJPY tends to act as a lagger, often following broader risk sentiment and oil price movements. It also reacts to USDJPY moves, meaning JPY flows largely set the pace.
Key Levels
Support Levels: 105.95, 104.98
Resistance Levels: 106.93, 107.54
Stop Loss (SL): 107.54 (above resistance zone)
Take Profit (TP): 104.98 (major support)
Summary: Bias and Watchpoints
CADJPY bias is bearish, with SL set at 107.54 and TP aimed at 104.98. Oil weakness, dovish BoC expectations, and resilient JPY flows all lean in favor of further downside. The key watchpoints are Canada’s CPI/retail sales and BoJ commentary. Unless oil rebounds strongly, sellers are likely to stay in control, with price action favoring a test of 105.95 and potentially 104.98.

CADJPY Rejection at Key Supply Zone – Bearish Move Ahead?Hello Traders! 👋
CADJPY is showing signs of weakness after testing the 107.478 – 108.504 supply zone. Price broke below the ascending trendline and is now retesting it as resistance. If this rejection holds, we could see strong bearish momentum pushing price toward the 104.644 support zone.
🔑 Key Levels to Watch:
Resistance Zone: 107.478 – 108.504
Current Price: 106.85
Next Bearish Target: 104.644
⚡ Bias: Bearish if rejection holds below 107.478. A clean close above 108.504 would invalidate this setup.
📌 Technical Confluence:
Trendline break ✅
Supply zone retest ✅
Lower highs forming ✅
What do you think? Will CADJPY respect this supply zone and drop, or will the bulls reclaim control?
💬 Drop your thoughts below & let’s discuss!
👍 Don’t forget to like, share, and follow for more setups. ❤️

Potential CADJPY downside
🚨 Potential Forex trade: CADJPY short 🚨
TA:
The weekly chart is forming lower swing highs
The daily has broken diagonal support and is testing the area as resistance
FA:
The BOC's rate cutting may continue. Unemployment remains high and is continuing to rise, while GDP growth is low.
The yen may strengthen if stock markets continue to fall, or if the bond yield crisis continues, due to its safe-haven status.
I'm looking for confirmation on lower time-frames.

CAD/JPY - Channel Breakout (29.08.2025)The CAD/JPY Pair on the M30 timeframe presents a Potential Selling Opportunity due to a recent Formation of a Channel Breakout Pattern. This suggests a shift in momentum towards the downside in the coming hours.
Possible Short Trade:
Entry: Consider Entering A Short Position around Trendline Of The Pattern.
Target Levels:
1st Support – 106.47
2nd Support – 106.30
🎁 Please hit the like button and
🎁 Leave a comment to support for My Post !
Your likes and comments are incredibly motivating and will encourage me to share more analysis with you.
Best Regards, KABHI_TA_TRADING
Thank you.
Disclosure: I am part of Trade Nation's Influencer program and receive a monthly fee for using their TradingView charts in my analysis.

CADJPY Sellers Defend Resistance, Bears Eye Deeper CorrectionCADJPY is stalling once again at the 107.10–107.50 resistance zone, where sellers have stepped in multiple times over the past sessions. Price is forming a clear rejection pattern after retesting supply, suggesting that momentum is shifting in favor of the bears. With crude oil volatility weighing on CAD and safe-haven demand supporting JPY, this setup looks poised for a potential downside leg.
Current Bias
Bearish — short-term rejections at resistance open the door for a move lower toward 106.30 and 105.20.
Key Fundamental Drivers
Crude oil dynamics: CAD’s correlation with oil remains strong; lower oil prices weaken CAD and reinforce downside risk in CADJPY.
BoJ normalization risks: Any hint of a shift in Japanese monetary policy or discussions around yield control tends to boost JPY.
Risk sentiment: Risk-off flows typically drive JPY higher, while CAD suffers under global growth concerns.
Macro Context
Interest rate expectations: BoC is seen as close to its peak rate, with limited room for further hikes, while the BoJ is slowly signaling normalization steps.
Economic growth: Canada’s growth is vulnerable to commodity fluctuations, while Japan’s economy, though modest, is gaining traction from external demand and JPY’s relative undervaluation.
Commodity flows: Oil weakness puts pressure on CAD, while defensive flows boost JPY.
Geopolitical themes: Tariffs, trade disruptions, or Middle East tensions could amplify demand for JPY as a safe haven.
Primary Risk to the Trend
A strong rebound in crude oil or dovish BoJ messaging could support CADJPY and push the pair back above 107.50 resistance, invalidating the bearish setup.
Most Critical Upcoming News/Event
Canada CPI / Retail Sales (key for BoC policy outlook)
BoJ statements on monetary policy or FX stability
Leader/Lagger Dynamics
CADJPY often trades as a lagger, following oil and USDJPY trends.
It tends to be influenced by WTI crude prices and USDJPY moves, which dictate directional bias.
Key Levels
Support Levels: 106.35, 105.95, 105.20
Resistance Levels: 107.10, 107.50
Stop Loss (SL): 107.55
Take Profit (TP): 106.35 (first target), 105.20 (extended target)
Summary: Bias and Watchpoints
CADJPY is showing rejection at a major resistance zone, with sellers stepping in to cap upside momentum. The bearish bias remains valid as long as the pair stays below 107.50, with downside targets set at 106.35 and 105.20. A stop loss above 107.55 protects against a breakout reversal, while oil price fluctuations and BoJ rhetoric remain the most important watchpoints. Unless crude oil rallies sharply or Japan signals dovish backpedaling, the path of least resistance appears to favor the bears.

CAD/JPY Finally Broke C.T.L , Ready For Sell Now To Get 100 PipsHere is my 2H T.F CAD/JPY Chart and we have a very clear breakout and the price confirmed already by amazing bearish candle closed below my C.T.L , So we can sell now and targeting from 50 to 100 pips .
Reasons :
1- Clear Breakout
2- Bearish P.A .
3- Clear Confirmation .

CADJPY Bearish Breakout!
HI,Traders !
#CADJPY made a bearish
Breakout of the key horizontal
Level around 107.376 and the
Breakout is confirmed After retesting the key
level which has now become resistance we
Will be expecting a further
Bearish move down !
Comment and subscribe to help us grow !

CADJPY H1 : Bearish Scenario!The 1-hour timeframe shows that after grabbing trend liquidity, the price reaches an unmitigated order block, which could drop the price from 107.84 to 107 or lower

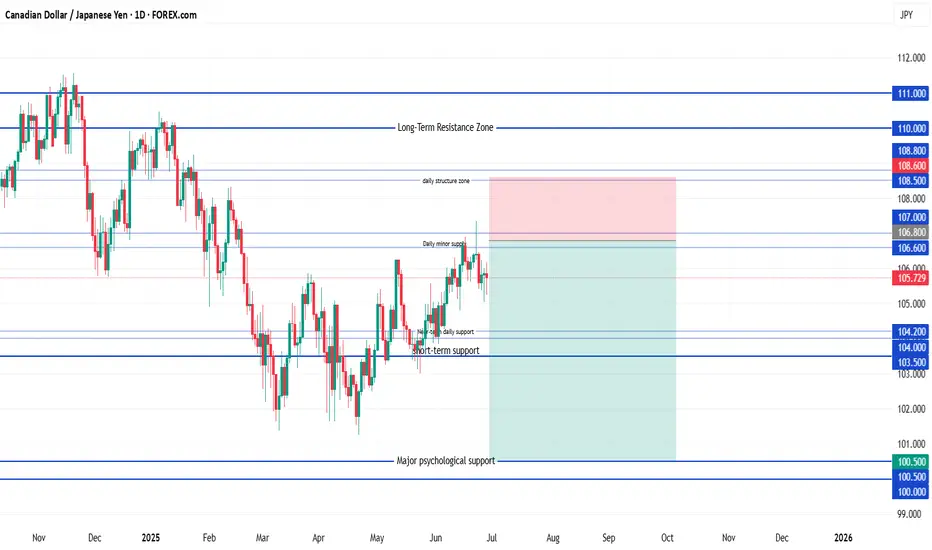
CAD/JPY ShortSell Limit Entry: 106.80
(Just under the resistance trap zone: 106.60–107.00)
Stop Loss: 108.60
Target 1: 104.20
(First minor support zone)
Target 2: 103.00
(Deeper support + recent structure base)
Target 3 (Optional hold): 100.50
(Long-term structural support zone)
CADJPY SELLBy utilizing levels, historical patterns, , we can formulate a hypothesis that the market might follow a similar trajectory if bearish sentiment prevails.

CADJPY - Looking To Sell Pullbacks In The Short TermM15 - Strong bearish move.
No opposite signs.
Currently it looks like a pullback is happening.
Expecting bearish continuation until the two Fibonacci resistance zones hold.
If you enjoy this idea, don’t forget to LIKE 👍, FOLLOW ✅, SHARE 🙌, and COMMENT ✍! Drop your thoughts and charts below to keep the discussion going. Your support helps keep this content free and reach more people! 🚀
--------------------------------------------------------------------------------------------------------------------

CADJPY Bearish Breakout!
HI,Traders !
#CADJPY made a bearish
Breakout of the rising support
Which is a resistance now and
The breakout is confirmed
So we are bearish biased
And we will be expecting
A further bearish move down !
Comment and subscribe to help us grow !

Bearish Bias Holds as Oil Rises & Rate Differentials NarrowUSDCAD – Bearish Bias Holds as Oil Rises & Rate Differentials Narrow
🌍 Macro & Fundamental Outlook
The Canadian Dollar (CAD) continues to gain ground this week, supported by two key drivers:
Crude oil prices surged due to Middle East tensions and renewed demand optimism — boosting CAD as a commodity-linked currency.
US-Canada yield spreads narrowed, following revised expectations that the Bank of Canada (BoC) may keep rates higher for longer, while the Fed is seen pausing.
Short-term event risks to watch:
🇨🇦 Canadian Manufacturing Sales data today at 13:30 GMT
🇨🇦 G7 Summit in Alberta from June 15–17, which may influence oil and energy policy sentiment
Our latest fair value estimate for USDCAD has shifted lower to 1.3613, reflecting tighter rate spreads and stronger oil. Technical structure remains tilted to the downside.
📉 Technical Outlook – M30 Chart
🔹 Structure:
Price remains in a short-term downtrend, with a well-defined descending trendline capping upside attempts.
The pair recently tested the EMA 89–200 zone and failed, suggesting continued bearish pressure.
🔹 Key Zones:
Dynamic Resistance: 1.3638 – 1.3660 (trendline + EMA cluster)
Support Area: 1.3592 → 1.3578
A break below 1.3578 could expose deeper downside toward 1.3420 (September lows)
🔹 Momentum Indicators:
RSI has bounced from oversold (30) but remains in bearish territory.
The current rebound looks corrective — potentially a dead cat bounce.
🧠 Market Sentiment
Flows favour commodity-backed currencies like CAD, especially with energy prices rising.
USD has weakened slightly as the Fed is expected to hold rates steady next week.
Sentiment is leaning toward "sell the rallies" on USDCAD for now.
🎯 Trade Setup Scenarios
🔻 SELL SCENARIO – If price retests and rejects 1.3638 – 1.3660
Entry: 1.3640 – 1.3655
Stop-Loss: 1.3685
Targets: 1.3592 → 1.3578 → 1.3510
🔺 BUY SCENARIO – If strong bullish reaction occurs at 1.3592 – 1.3578
Entry: 1.3580
Stop-Loss: 1.3545
Targets: 1.3620 → 1.3640
⚠️ Focus on trend continuation. Only consider buys if clear rejection or bullish confirmation appears at support.
✅ Conclusion
The current trend in USDCAD favours sellers, with fundamental momentum supporting CAD via higher oil and narrowing yield differentials. Key resistance at 1.3638–1.3660 remains the pivot zone to monitor. With Canadian data and the G7 Summit ahead, volatility could increase.

EURJPY and other crossesYou can see that JPY has becoming stronger over the last couple of days, and today it broke previous structure and broke above the recent low.
If this continues, we will see the JPY crosses continue to head lower.
