Hello traders, let’s break down the CADUSD pair today!Canada’s CPI came in below expectations , yet CAD is still holding near its three-month highs , showing that the market views the Canadian dollar as stable and not under strong selling pressure. Meanwhile, the Bank of Canada keeping interest rates at 2.25% helps clarify policy expectations. As long as BoC does not signal further easing , CAD has a solid foundation to maintain relative strength against the USD.
On the U.S. side, the spotlight remains on NFP, the unemployment rate, and average hourly earnings . If these figures come in weaker than expected, the USD is likely to face pressure, creating a favorable scenario for CADUSD to extend higher. Conversely, very strong U.S. data may only trigger short-term volatility, not enough to break the current trend.
From a technical perspective, CADUSD is moving within a clear rising wedge , with price respecting the trendline and being supported from below by the Ichimoku cloud. The 0.7260 area is acting as near-term support, where price is consolidating firmly. The pattern of higher lows confirms that buyers remain in control.
As long as 0.7260 holds, the probability is high that price will continue its upward momentum toward 0.7310, a key psychological resistance . Current pullbacks should therefore be seen as “pauses to build momentum”, rather than signals of a trend reversal.
CADUSD

USDCAD reached a key daily demand zone (61.8% Fib)Expanded analysis (for the idea details)
Context & setup
Price has dropped sharply into a well-defined daily demand/congestion zone (≈ 1.3765–1.3714) and is currently testing the lower boundary. This area lines up with a key 61.8% retracement cluster and a multi-timeframe support region — a clear confluence of supply/demand and Fibonacci support.
Why this matters
The move into the zone is a strong liquidation leg; the first reaction here will tell us whether buyers are stepping in.
If price shows a clean bullish rejection (wicks, close back above the zone, or a bullish engulf), the probability of a corrective swing higher increases.
The 200/100-type moving averages and higher-timeframe structure act as resistance above, making this a high-reward countertrend/swing setup if buyers defend the zone.
Trade idea (example, for discussion — not trading advice)
Entry: buy area 1.376 – 1.379 after a confirmed bullish price action signal.
Stop loss: below 1.366 (monthly lower invalidation level).
Take profits: partial at 1.4026 (short-term swing target / area of interest), final at 1.4128 (monthly 61.8 / higher resistance).
Invalidation: clear daily close below 1.366 would invalidate the long idea and favors continuation lower.
Risk management & notes
Use position sizing so that the stop equals an acceptable percentage of your account. Aim for positive R:R (this plan targets ~2–4R depending on exact entry).
Watch for news and liquidity events — large catalysts can blow through technical zones.
Wait for a clean price-action confirmation before committing full size.
Summary
This is a classic demand-zone vs. fib confluence trade: if buyers defend 1.3765–1.3714, expect a corrective rally toward 1.402–1.413. If the zone breaks decisively, look for continuation toward 1.366 and below.
Not financial advice. Trade your plan and respect risk.
OANDA:USDCAD FX:USDCAD FOREXCOM:USDCAD BMFBOVESPA:CAD1! TFEX:USD1!

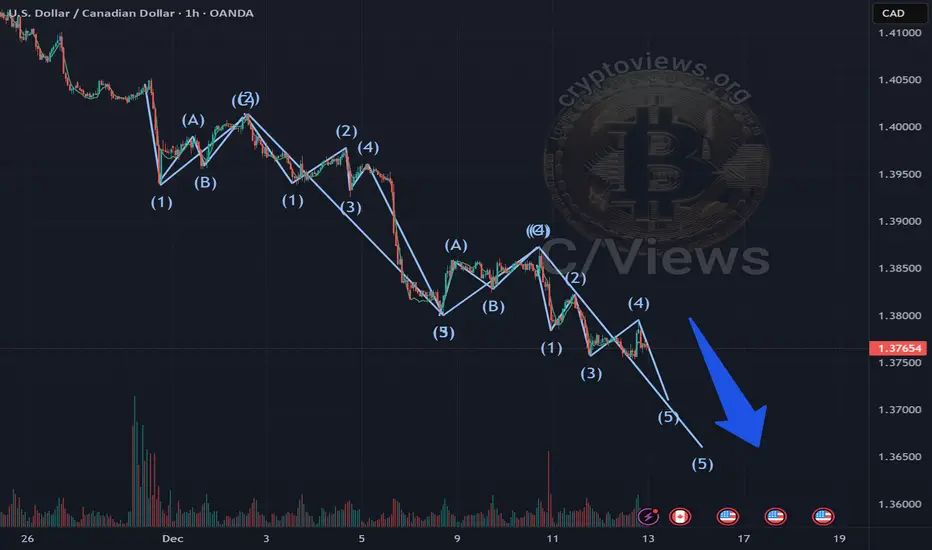
CADX Showing Potential Completion of Elliott Wave StructureCADX is forming a 5th Elliott wave, which suggests the movement is more likely to continue downwards
Based on the 2nd wave, we can estimate the approximate length of the 5th wave
Price movement levels are more likely to be determined using Fibonacci numbers
Full breakdown with levels and graphs on the website
LONG USD/CADAs we seek last week, the sharp decline that happened in last Friday which was affected by strong jobs 53 k versus-1.5k , this decline was a trap for loonie then the fed will cut rates with 25 basis points with 90 % confirmation and central bank of Canada will hold rates this week , so the fed rate is still higher and more attractive than CAD after cut off with 1.5% increase for USD ( 3.75% for US 2.25 % for CAD) so still more good for USD to be bullish in the next week

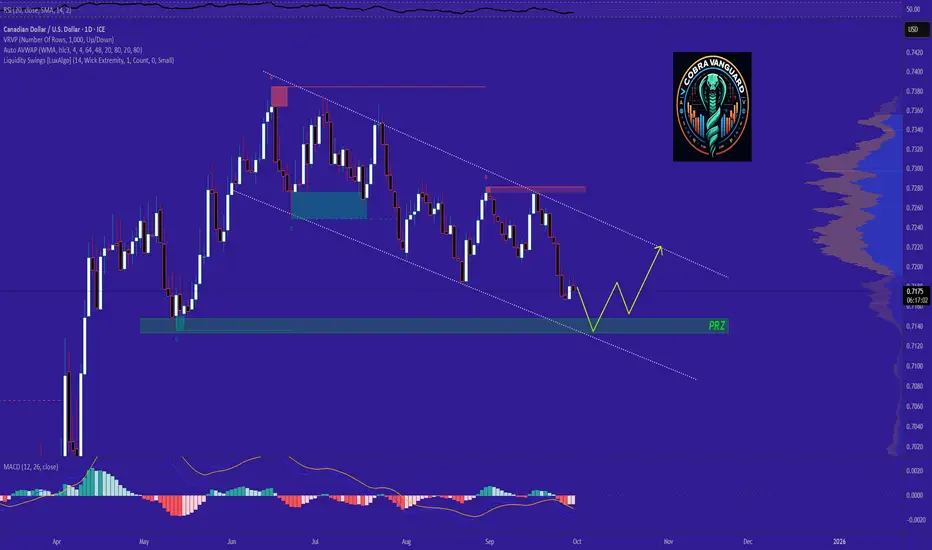
CADUSD → Bearish 𝐏𝐫𝐞𝐬𝐬𝐮𝐫𝐞 !!!As you can see, the price could drop to the bottom of the descending channel and then turn bullish. The PRZ (Potential Reversal Zone) is a good area for an upward move.
USDCAD - Outlook Short on all IndicatorsUSDCAD - Outlook Short on all Indicators
TVC:DXY
FRED:TREASURY
ECONOMICS:USGD
US CONS
- The US Treasury is under $353.5 Billion.
- DXY will continue to fall.
- The Decline of the US Dollar will continue.
- US Debt has exceeded $36 Trillion
- US Federal Debt Deficiency of over $2 Trillion (Must be paid prior to Interest Payments)
- US Federal Interest (over $1 Trillion)
- War in Iran
- USD could be converted to GOLD and moved to BTC
- Moody's US credit rating reduce.
- Interest Rate Cuts
US PROS
- Trump could get funding from another country.
- Interest Rate increases
- Positive FOMC in July

Canadian Dollar vs US Dollar: Recovering from The Bearish HugsIn previous posts, we have already begun to look at the key factors that have driven the U.S. outperformance over the past decade.
The U.S. market dominance is largely due to the rapid rise of tech giants (such as Apple, Microsoft, Amazon, and Alphabet), which have benefited from strong profit growth, global market reach, and significant investor inflows.
Underperforming Internationally
Markets outside the U.S. have faced challenges such as multiple stifling sanctions and tariffs, slowing economic growth, political uncertainty (especially in Europe), a stronger U.S. dollar, and the decline of high-growth tech sectors.
The Valuation Gap
By 2025, U.S. equities will be considered relatively expensive compared to their international peers, which may offer more attractive valuations in the future.
Recent Shifts (2025 Trend)
Since early 2025, international equities have begun to outperform the S&P 500, and European and Asian equities have regained investor interest. Global market currencies are also heavily dependent on the US dollar.
Factors include optimism around the following three main themes.
DE-DOLLARIZATION. DE-AMERICANIZATION. DIVERSIFICATION.
De-dollarization is the process by which countries reduce their reliance on the US dollar (USD) as the dominant global reserve currency, medium of exchange, and unit of account in international trade and finance. This trend involves a shift away from the centrality of the US dollar in global economic transactions and towards alternative currencies, assets or financial systems.
Reasons for De-dollarization
The move towards de-dollarization is driven by geopolitical and economic factors:
Backlash against US economic hegemony: The US often uses the dollar's dominance to impose sanctions and exert political pressure, encouraging countries to seek financial sovereignty.
Rise of emerging economic powers: Emerging economies such as China and groups such as the BRICS are seeking to reduce their vulnerability to US influence and promote regional integration and alternative financial infrastructures.
Geopolitical tensions: Conflicts such as the war in Ukraine have increased efforts by countries such as Russia to withdraw dollars from their reserves to avoid sanctions.
Summary
De-dollarization is a complex, ongoing process that reflects a gradual shift away from the global dominance of the US dollar. It involves diversifying reserves, using alternative currencies and assets, and creating new financial systems to reduce reliance on the dollar.
Driven by geopolitical tensions and the rise of emerging economic powers, de-dollarization is challenging the entrenched role of the dollar, but is unlikely to completely replace it anytime soon.
Instead, it is leading to a more multi-polar monetary system in international finance, increasing demand for alternative investments in the US.
Technical Test
The main technical chart is presented in a weekly perspective, reflecting the performance of the Canadian dollar against the US dollar FX_IDC:CADUSD over the long term.
With the positive dynamics of the relative strength indicator RSI(14) continuing, a breakout of flat resistance near the level of 0.72 is noted, with the prospect of a possible price increase to 0.80, parity in the currency pair and strengthening of the Canadian dollar to historical maximums, in the horizon of the next five years.
--
Best wishes,
@PandorraResearch Team 😎


CAD/USD 15-Minute Analysis: Head & Shoulders BreakoutCAD/USD 15-Minute Analysis: Head & Shoulders Breakout
On the 15-minute time frame, CAD/USD has formed a Head and Shoulders pattern, and the price has broken below the neckline trendline, signaling potential bearish momentum. Here's my idea:
Entry:AT 0.4146$
Target: The next significant support level, marked in the green zone.
This pattern suggests further downside, but as always, manage your risk carefully and monitor price action as we approach the target zone.
Let me know your thoughts and share your analysis below! 👍

USDCAD BULLISH OPPORTUNITIES CANDLE CLOSED ABOVE THE IDENTIFIED RESISTANCE ZONE
We wait for a retest and mitigation on the corrective structures zone on the same
Impulsive leg.
Since today there are high impact news, probable wait or a reentry around the area identified, to acquire the volume for a bullish push.

CADUSD LONG VERY SOONM/M CAD coming tomorrow
In the green zone, looking for an escape with a lower low then an explosion at the top
Combining fundamentals and technicals, seems safe to say that after a liitle zig-zag tonight, any CAD asset will go through the roof

NOT buying USDCADThe USDCAD price has moved into the Daily sell zone, which suggests the possibility of new sell positions entering the market, potentially driving the price down. In the case that the zone is broken, there is a high likelihood of further price increases (which, in my opinion, is less likely).
For those looking to short, I would recommend looking for a simple breakout pattern on lower timeframes and participating accordingly. BUT make sure to wait until after the NFT news and observe what market will do with price.
Good luck, and stay cautious, don't forget it's Friday!

AUDCAD Long - SLs Patiently Waiting To Get DestroyedWell, there is not much to be explained besides of: Look at the weekly and the higher lows. How much of confirmation do you need, that we want to attack the upper range? Look at the 4h and tell me what you see? I see dozens of Shorts trapped and begging to stay alive. Green line needs to hold to validate this idea. Good luck.

USD/CADHello again!
As you liked the previous analysis and signal, here comes the second one. Please try to be patient and wait for confirmation before entering at the right place. This way, you won't have to place your stop loss far away from the entry point.
The most important thing in trading is having a plan and always aiming for the win. However, you should never underestimate the market, as it can go in any direction possible. There are no "have to" or "had to" in the market.
Thank me later!

USDCAD Sell-Short Trade Idea15minute timeframe entry
After NFP session Friday price has reached new highs. Scaling into lower timeframes we're anticipating the sell off to rebalance market structure.

💱 EURCAD - Retests as support breakout attempts The currency pair is forming preconditions for a possible break of the trend support and an attempt to change it. The price forms consolidation near the support even after the level retest. there is no expected reaction - bounce from the level. Bears are trying to dominate
We are getting a chance to see a trend change.
But again, since a bullish trend is forming, there is a high chance of a bounce from support.
A fall is possible provided:
1) Breakout of the trend support and the level of 1.4868
2) Pre-breakout consolidation is formed
3) The market is not updating the highs, it is creeping closer to the support.

TRADE SETUP_CADUSDSpotted a 5 wave move on CADUSD from NOV 1- NOV 6.
The Pair is currently at 61.8% of the 5 wave rise.
Looks like a decent trading set up.
Note*- I do not trade in currency pairs. Please do your own research/analysis before taking up any positions.

Last Dance of the Loonie and WTI? The correlation between WTI and Canadian Dollar seems to be breaking down, at least in the short term. Not sure the reasons for this, but posting to hear thoughts. For those unfamiliar with the WTI/CAD correlation, I have added some context.
The Correlation: How Are They Connected?
Commodity-Driven Economy : Canada is known for its abundant natural resources, including oil. The Canadian economy is heavily reliant on its energy sector, which includes the production and export of oil. When WTI crude oil prices rise, Canadian oil exports become more valuable, leading to an influx of foreign capital into Canada. This increased demand for the Canadian dollar can result in its appreciation against other currencies.
Economic Health : The Canadian economy's overall health is closely tied to the energy sector's performance. When WTI prices surge, it often indicates increased economic activity, which can benefit Canada's economy and, consequently, the loonie. Conversely, when oil prices plummet, it can have a negative impact on the Canadian economy and lead to a weaker Canadian dollar.
Risk Appetite : Like many commodity currencies, the Canadian dollar tends to strengthen during periods of risk appetite. When global economic conditions are stable, investors often flock to assets like oil, which can lead to higher oil prices and, in turn, boost the loonie.

CADUSD, Possible FLAG-FORMATION In The MAKING!Hello,
Welcome to this analysis about CADUSD on the daily timeframe perspectives. As when looking at my chart we can watch there that CADUSD already initiated a bearish development with the first impulse wave A into the bearish direction. From there on CADUSD showed up with this channel-formation in which it is also forming a local wave-count which is actually building the global wave B of the wave-count to the downside. As CADUSD now heavily pulled back off the upper boundary of the channel formation and already forms the pullbacks below the 400- as well as 800-EMA there is a high possibility given that the whole channel-formation will be completed as a bear-flag if CADUSD moves finally below the lower boundary of the channel and shows up with a similar confirmation-formation as it is seen in my chart. Once the whole channel-formation has been completed as a bear-flag it will activate the lower target zones seen in my chart, once these have been reached the situation needs to be elevated again, it will be an interesting development.
In this manner, thank you for watching the analysis, all the best!
"Trading effectively is about assessing possibilities, not certainties."
Information provided is only educational and should not be used to take action in the markets.

USDCAD ..A Very Big Decline Coming in on USDCADHello guys, My Idea on USDCAD is for a Big Push to the Downside , Which from the Daily Timeframe Down to the H4 Timeframe we are Overall Bearish and Which the H4 has Currently Switched Bearish and We are Expecting the Continuation Trend to the Downside for a Good Selling Opportunity from Level 1.36110 . Like and Drop your Comments ❤

GBPCAD Bullish Trend continuationThe Canadian dollar fell past the 1.34 per USD level, an over two-month low, as the greenback remains strong amid bets the Fed will need to keep interest rates elevated for longer. At the same time, oil prices fell from recent highs and Canada posted the largest trade deficit since November 2020, highlighting the extent of net outflows of the domestic currency from the economy, and pressuring the Loonie. On the other hand, annual inflation rate in Canada rose more than expected in July and the core rate failed to slow as anticipated, keeping a range of possibilities open for the Bank of Canada, as the bank considers the need for another rate hike in September. So from my side of view Cad will remain weak..... looking at my analysis on GBPCAD we had a breakout of 1.71262 Level and a retest so we might continue buying the dip until 1.73236 which will be my TP.

USDCAD | Could be a good buyHey Traders!
Our examination primarily focused on extended timeframes. The daily chart exhibits a robust double bottom coupled with a validated falling wedge. Given its yet-to-be-realized profit trajectory, aligning with the prevailing market trend, I recommend a continued buying approach.

USDCAD is giving a good opportunity -LONG hey traders, i am back with some profitable ideas. dont forget to BOOST and follow my account. USDCAD is ready for the next long term bull run. Kindly use lots according to your accounts thanks
